
JHVEPhoto
Thesis
Dave & Buster’s Entertainment. Inc. (NASDAQ:PLAY) has demonstrated commendable financial performance in Q1 2023, with record revenue and robust cash flow. However, challenges pertaining to overvaluation, substantial debt, a high-pressure competitive scene, and uncertain outcomes of strategic remodeling initiatives, punctuate this otherwise promising trajectory. Despite these concerns, the company’s strategic growth initiatives, cost optimization measures, and innovative culinary revisions set the stage for potential success. This article presents a balanced viewpoint, advocating a cautious, wait-and-watch approach to the stock given the mixed bag of encouraging strengths and looming uncertainties.
Company Overview
Dave & Buster’s Entertainment, Inc., rooted in Coppell, Texas, is a player in the North American entertainment and dining scene that has etched its signature across the industry since its inception in 1982. With their business model targeting adults and families, they’ve managed to carve a niche in an otherwise crowded marketplace. At the core of their operations, Dave & Buster’s venues encompass a diverse culinary spectrum, ranging from appetizers to entrées, but what sets them apart, however, is the infusion of entertainment attractions within these venues that’s a combination of games, live sports, and other televised events, thereby merging dining with entertainment.
Expectations
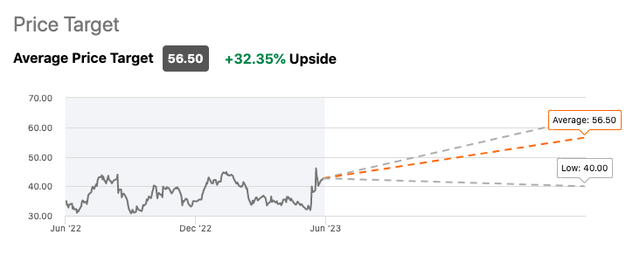
Currently, Dave & Buster’s is followed by 9 Wall Street analysts who have an average “buy” rating on the stock with 30%+ forecasted upside on the stock’s share price.
Seeking Alpha
Performance
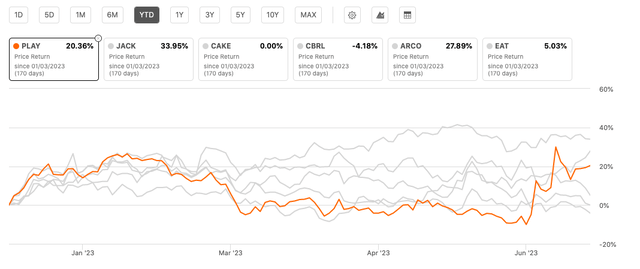
YTD, while stocks like EAT, CAKE and CBRL are experiencing a slight downturn in their price performance, PLAY has been bucking that trend since announcing their Q1 results and has notched an impressive 20% return.
Seeking Alpha
Valuation
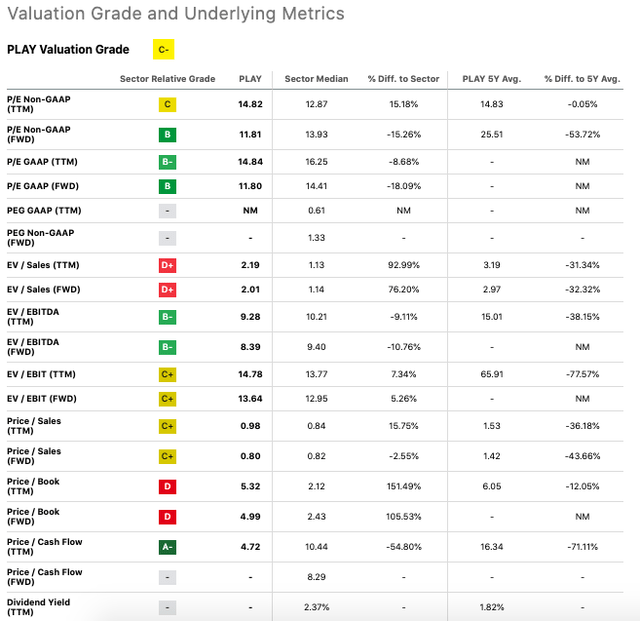
Starting with the positives, the P/E Non-GAAP (TTM and FWD) valuation metrics for PLAY are strikingly robust (see table below). PLAY’s current TTM and FWD non-GAAP P/E ratios of 14.82 and 11.81 respectively are rather appealing when compared to both the sector median and PLAY’s five-year average. The forward-looking P/E metrics showing a 15.26% and a staggering 53.72% decline compared to the sector and five-year average respectively, suggest that the market may have been overly punitive on PLAY’s future earnings potential.
Seeking Alpha
Equally interesting is the Price/Cash Flow (TTM) metric, where PLAY is scoring an impressive A-. At a ratio of 4.72, this represents a massive 54.8% discount to the sector median and a dramatic 71.11% plunge against its five-year average, suggesting PLAY is generating cash flow at a rate that the market is not fully appreciating.
However, I am deeply concerned by the EV/Sales metrics. PLAY’s current EV/Sales (TTM and FWD) ratios of 2.19 and 2.01 indicate a vast 92.99% and 76.20% premium to the sector median. This suggests that PLAY might be overvalued, and its enterprise value may not be justified by its current sales figures.
Price/Book (TTM and FWD) metrics don’t give me any relief either, with a D rating. With TTM and FWD metrics at 5.32 and 4.99, these are 151.49% and 105.53% above the sector median, suggesting that PLAY’s market price is not well grounded in its book value, which might be indicative of overvaluation.

Seeking Alpha
And finally, looking at the capital structure, PLAY’s total debt is far larger than its market cap, which makes me raise an eyebrow. With a total debt of $2.88B against a market cap of $1.83B, the debt load might prove to be a strain on PLAY’s finances, potentially affecting future profitability and cash flows.
Q1 2023 Bullish Earnings Takeaways
Regarding Dave & Buster’s financial trajectory in the first quarter of fiscal 2023, it’s clear the firm has not just hit but surpassed its mark, with both revenue and adjusted EBITDA establishing new records. The company raked in a revenue of $597 million coupled with an adjusted EBITDA of $182 million – an affirmation of its strength in maintaining robust financial performance and the successful leverage of strategic growth opportunities.
Culinary Innovations
In an attempt to spice up the food and beverage offerings, Dave & Buster’s has significantly overhauled its culinary team. With a two-pronged approach of enhancing food quality and simplifying the menu, the company has managed to raise the dining experience bar while simultaneously improving operational efficiencies. Further, they have upgraded guest-facing technology to ensure a more integrated and superior experience for guests. These initiatives are predicted to not only elevate the overall guest experience but also fuel revenue growth.
Cost Optimization Prospects
Through the realization of synergy targets and strict cost control measures, Dave & Buster’s has already gleaned $25 million in cost reductions. However, the company identifies enormous untapped potential for additional cost savings across various facets including cost of goods sold, store labor, store operating expenses, and corporate overhead. According to management, these meticulous cost curbing endeavors are anticipated to lower the cost base, broaden profit margins, and enhance cash flow generation.
Margin Enhancement
Dave & Buster’s has seen a marked improvement in the adjusted EBITDA margin in Q1 compared to the same period in the previous year, signaling effective cost management and the successful optimization of the business model. The company remains confident in its ability to safeguard and even boost its margin profile through strategic cost reduction measures. As Mike Quartieri, Chief Financial Officer, noted on the conference call:
We produced a 30.5% adjusted EBITDA margin in the first quarter, an improvement of 20 basis points versus the prior year period on a pro forma basis, Our margin profile remains one of our strongest attributes of our business and we are confident in the levers we have on the cost side to defend it.
Also, our strategic investments to lower our overall cost base will be a meaningful catalyst to expand margins as we continue to grow and consumer confidence improves. Pro forma comparable store sales decreased 4.1% versus 2022 as we lapped a very robust prior-year period. Recall that in March and April of 2022, we saw outsized comp performance of 15% and 26% respectively as the country emerged from the Omicron variant. When we look back at a more normalized level of business, we were up 10.3% versus 2019 on a consolidated basis.
Revival and Growth of Special Event Segment
Furthermore, Dave & Buster’s Special Event business has witnessed notable comparable store growth, reminiscent of the 2019 levels. By sharpening focus on this segment, the company is on a direct trajectory towards substantial future growth, effectively capitalizing on the segment’s recovery.
Solid Cash Flow
With strong operating cash flow in the first quarter, Dave & Buster’s has bolstered its cash balance and overall liquidity. Such substantial cash flow generation gives the company the flexibility to invest in system improvements, open new stores, and repurchase shares, thereby amplifying shareholder value. To that end, CFO Mike Quartieri also elaborated:
Our Special Events business continued to grow in Q1 2023 with our combined comps now flat to pro forma 2019 levels. We generated $92.4 million in operating cash flow during the first quarter, contributing to an ending cash balance of $91.5 million, for total liquidity of over $581 million when combined with the $490 million available on our $500 million revolving credit facility, net of outstanding letters of credit. We ended the quarter with total leverage ratio of 2 times. Our strong cash flow generation and conversion gives us the ability to simultaneously invest in our system, grow new stores and repurchase shares.
Expansion and Share Buyback Strategies
And finally, Dave & Buster’s unfurled new stores in Q1 and is on course to open a total of 16 new stores in fiscal 2023. This expansion, coupled with the company’s share repurchase initiatives, clearly highlights Dave & Buster’s commitment to strategic capital deployment and growth.
Risks & Headwinds
According to management, a slight respite has been bestowed upon Dave & Buster’s courtesy of deflationary patterns reflected in wages and commodities. Nonetheless, one should not lose sight of the fact that the overall impact on the company’s financial performance could be trivial at best. A diverse range of operating costs persistently lies beyond the realms of cost of goods sold and general and administrative (G&A) expenditures, potentially acting as persistent financial thorns in their side.
Question Marks Over Remodeling Strategy
In their efforts to rejuvenate and revitalize, Dave & Buster’s has opted for a remodeling strategy. However, this strategy teeters precariously on the precipice of uncertainty and we’ve yet to witness the unveiling of a single remodel in the market, and the completion rate stands at a mere half of the planned dozen remodels for this year. Along those lines, CEO Chris Morris pointed out:
We strongly see remodels as one of the catalysts to — one of the key catalyst to get our topline moving on a sustainable basis.
Right now the first remodel to open will be late July, early August. So we don’t have a remodel yet in the market. We are — we have 12 units that are — we are going through the permitting process and we expect to have six of those 12 done this year.
As of this writing, whether these redesigns will inject a much-needed sustainable growth impetus remains shrouded in mystery.
The Cutthroat Competitive Scene
In the tumultuous ocean of the entertainment and gaming industry, Dave & Buster’s strive to stay afloat amidst the relentless waves of competition. The danger lies in the potential inadequacy of their aforementioned remodeling efforts to create a unique and compelling proposition capable of drawing in customers and maintaining their loyalty. This intensified competition has the potential to destabilize their customer attraction and retention efforts.
Sales Momentum Running Out of Steam
A worrisome trend of deceleration in same-store sales has emerged over the previous three quarters when juxtaposed with 2019 figures. This flagging momentum and intensifying pressure may be symptomatic of the company’s grappling with various challenges, such as the release of pent-up demand post-pandemic and the gradual depletion of excess dollars from relief and stimulus measures.
Promotional Campaigns with Ambiguous Impact
The company’s optimism for their current promotional drive, anticipated to outshine previous years, raises eyebrows amidst the doubts surrounding its potency to fuel increased foot traffic. The ghost of past campaigns, such as the Summer Games, lingers, serving as a reminder of the lack of substantial success in sales uplift. The verdict on the efficacy of the current campaign is still up in the air.
Equilibrium Between Share Buybacks and Debt
The strategic decision to favor share buybacks over debt repayment has cast doubts over the company’s approach to capital allocation. Given the debt cost standing at around 10%, some investors might prefer a tilt towards a more debt-conscious strategy in order to bolster the company’s overall financial footing.
Dwindling Comps
And finally, a decline of 4% in same-store sales on a year-to-year basis, notwithstanding assertions of unfavorable comparisons and no perceptible shifts in consumer behavior, causes alarm. A consistent slide in comps, particularly when compared to the pre-pandemic era, might signal hurdles in consistently attracting and retaining patrons.
Final Takeaway
Given Dave & Buster’s strong Q1 performance and robust cash flow, alongside concerns about overvaluation and a high debt load, I believe holding the stock is the prudent move. The company’s strategic growth and cost optimization measures are promising, yet uncertainty around remodeling success and potential market headwinds makes this a wait-and-watch scenario for me.
Credit: Source link