

pagadesign
Like nearly all other developed nations, the United States is facing a severe debt problem.
Today, public debt is nearly $35 trillion, rising approximately 23% in the last four years alone.
But public debt only tells one half of the entire story: what the government owes.
The United States also has $66 trillion of private debt – what companies and households owe.
So, in this article, we’ll not only break apart the debt situation in the public sector, but we’ll also analyze the private sector debt burden. At the end of this article, we’ll discuss the consequences of such a crushing public and private debt burden.
BEA, BLS, Federal Reserve, Census Bureau, EPB Research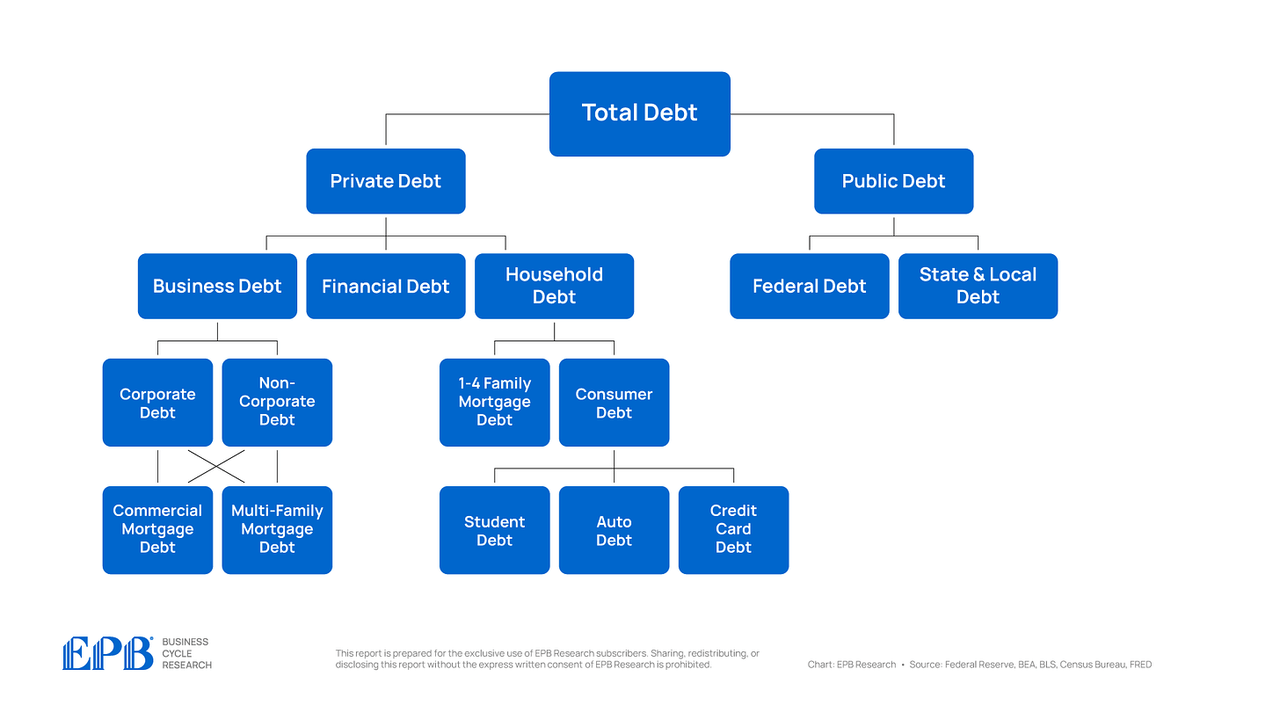
From 1955 through 1980, total debt averaged 150% of GDP, but that has more than doubled over the last 40 years.
BEA, BLS, Federal Reserve, Census Bureau, EPB Research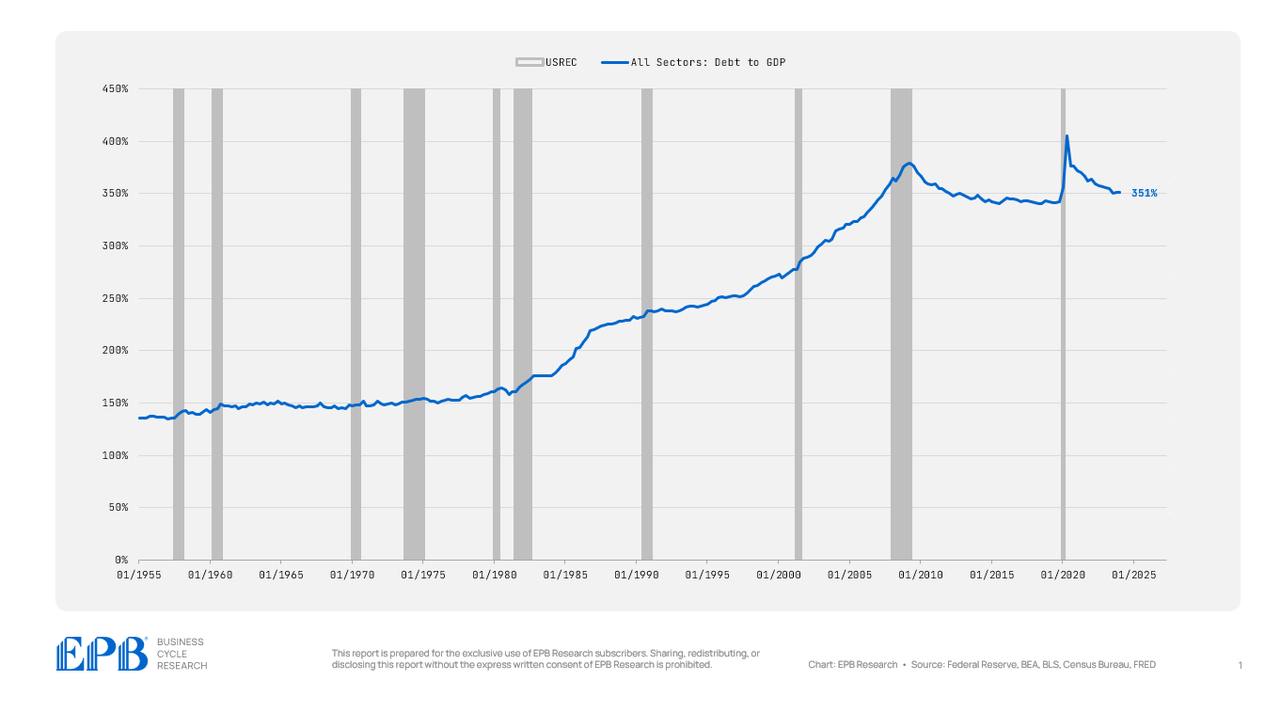
For all sectors of the economy, we’re going to look at the debt levels today, the debt levels in 2007 before the last major debt crisis, and the average debt level from 2012 to 2019 to get an idea of whether the economy or a particular sector is at significant risk.
For example, if we look at the first line in the chart below, we can see that federal government debt is 106% of GDP today. It averaged 82% from 2012 through 2019 and 41% in 2007. Compared to 2007, debt to GDP has increased 156%, a massive increase in the federal government’s debt burden.
BEA, BLS, Federal Reserve, Census Bureau, EPB Research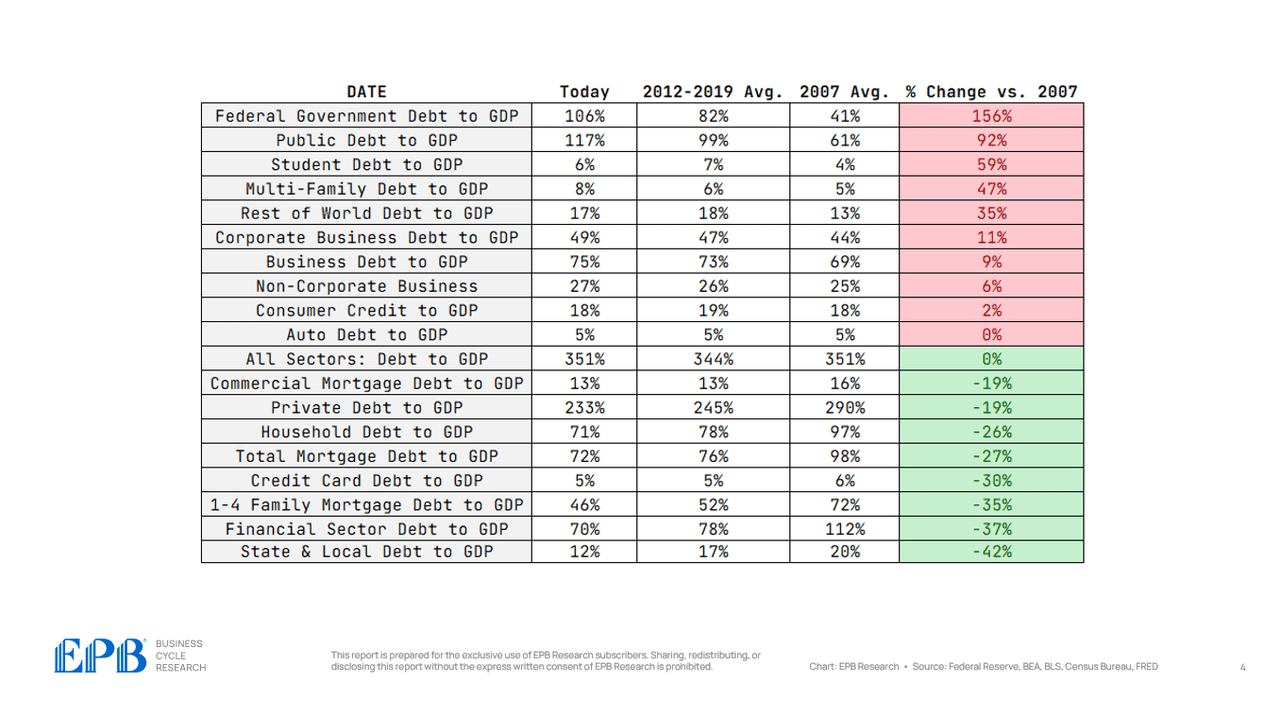
We will go through a process like this for each layer of debt to uncover the biggest issues facing the US economy today.
Let’s start by looking at total debt to GDP, which includes all sectors of the economy, both the private sector and the government sector.
The economy has a total debt to GDP ratio of 351%. This compares to an average of 344% from 2012 to 2019 and 351% in 2007. So the economy, as a whole, has not deleveraged at all from the 2007 crisis and the years that followed.
There’s a massive build-up of debt that’s crushing the average American, leading to weaker economic prospects as there was no net reduction in debt.
BEA, BLS, Federal Reserve, Census Bureau, EPB Research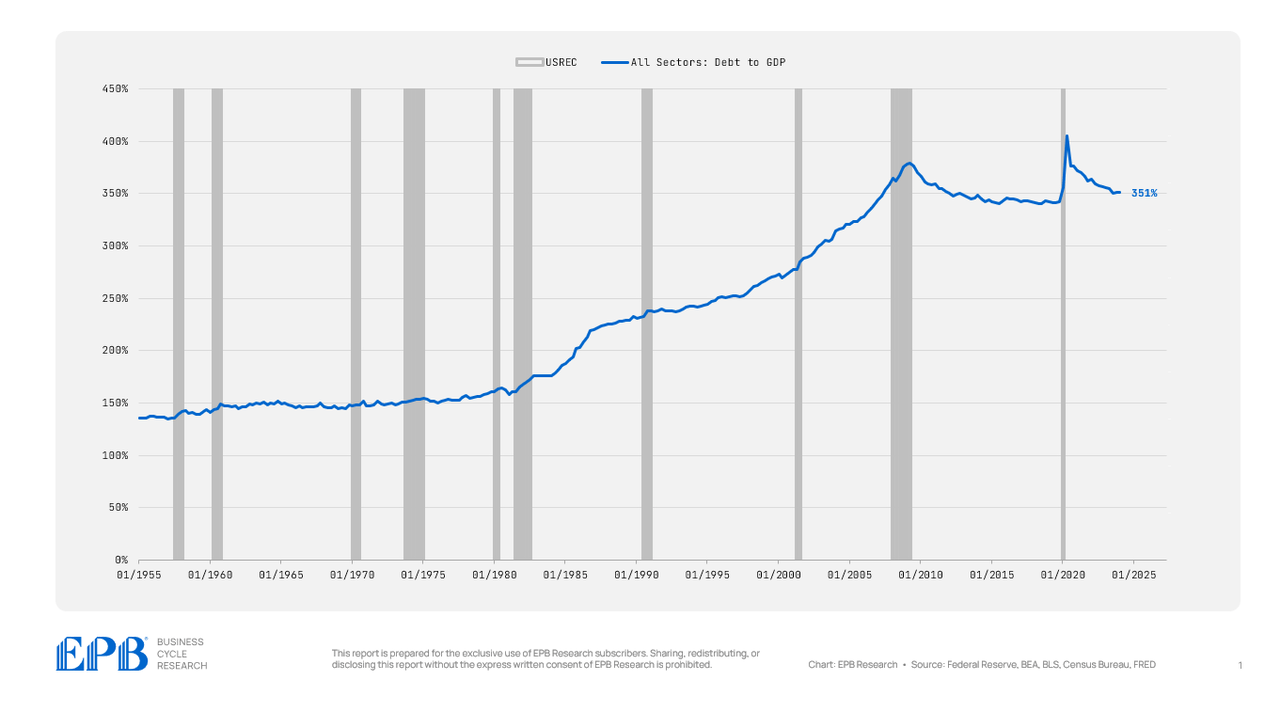
If we go one layer deeper, and we analyze private sector debt and government sector debt, we can see some changes.
BEA, BLS, Federal Reserve, Census Bureau, EPB Research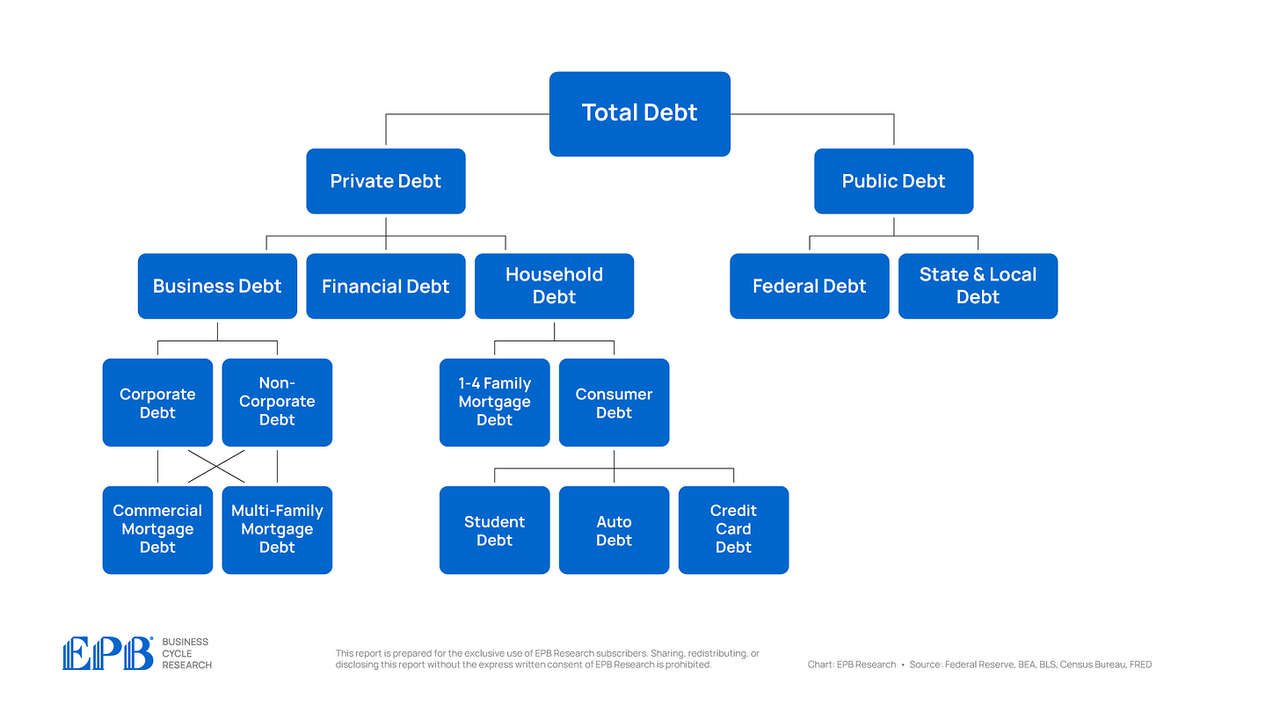
The private sector which includes the business sector, household sector and financial sector, has a total debt to GDP level of 233% compared to an average of 245% from 2012 to 2019 and 290% in 2007.
So, the private sector has reduced its debt burden, but on the flip side, the government sector has 117% debt to GDP, an increase from 99% from 2012 to 2019 and 61% in 2007.
BEA, BLS, Federal Reserve, Census Bureau, EPB Research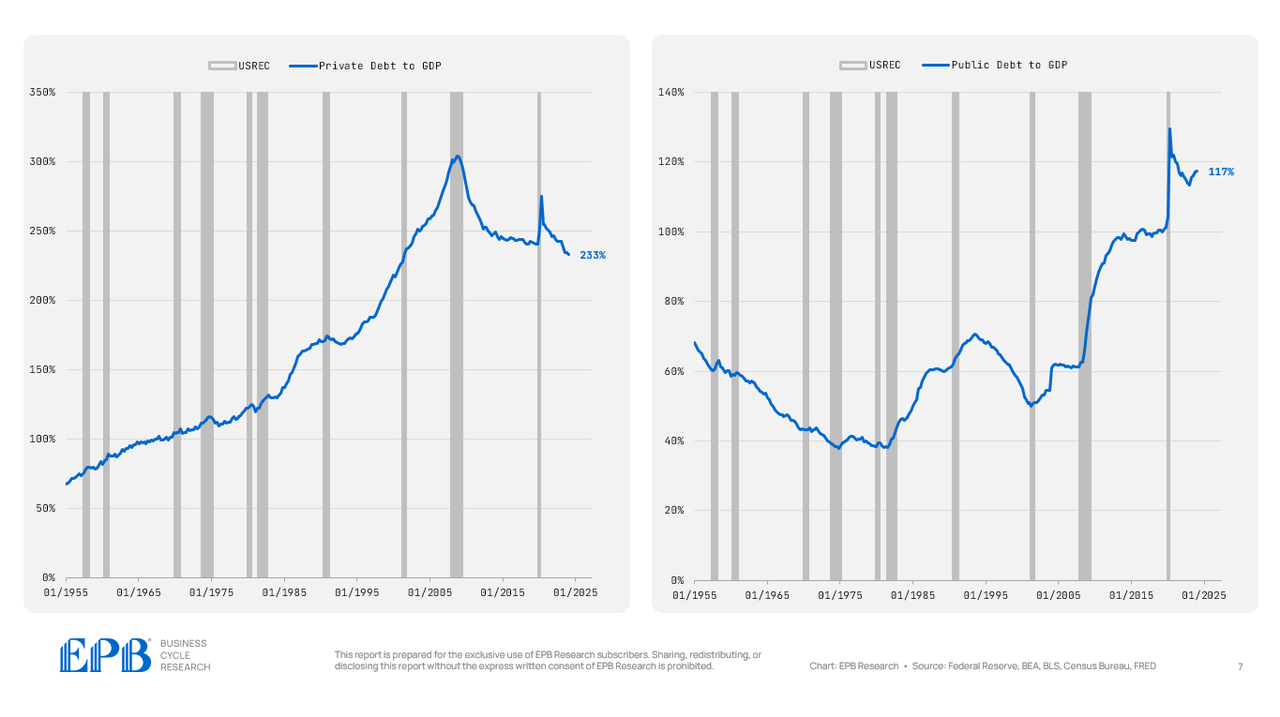
So there was no net reduction in debt burden across the entire economy, we simply shifted debt from the private sector balance sheet to the government balance sheet, keeping aggregate debt levels almost exactly the same.
Let’s dig one layer deeper, starting with public debt, which is comprised of the federal government and the state & local governments.
BEA, BLS, Federal Reserve, Census Bureau, EPB Research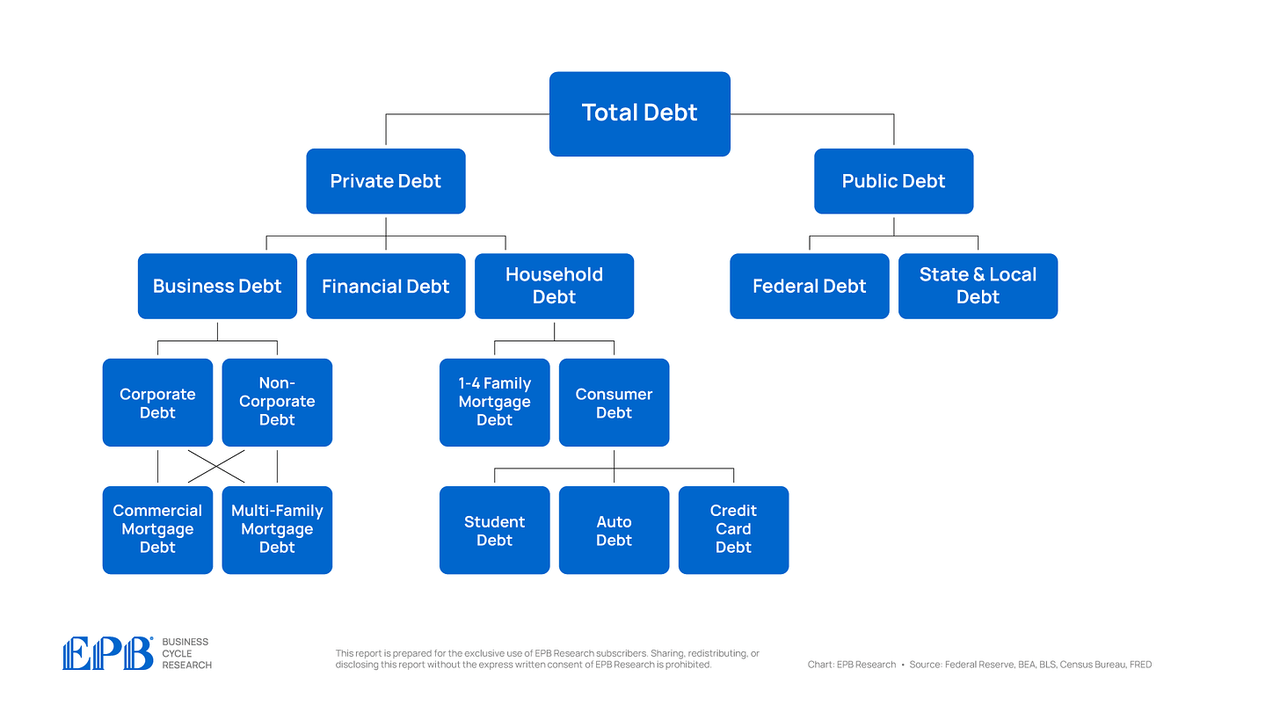
So we know the total government sector has massively increased debt over the last several years, up to a total of 117% of GDP as of the start of 2024.
Almost all of this debt is being driven by the federal government, which has a debt burden of 106% to start 2024, compared to an average of just 41% in 2007.
BEA, BLS, Federal Reserve, Census Bureau, EPB Research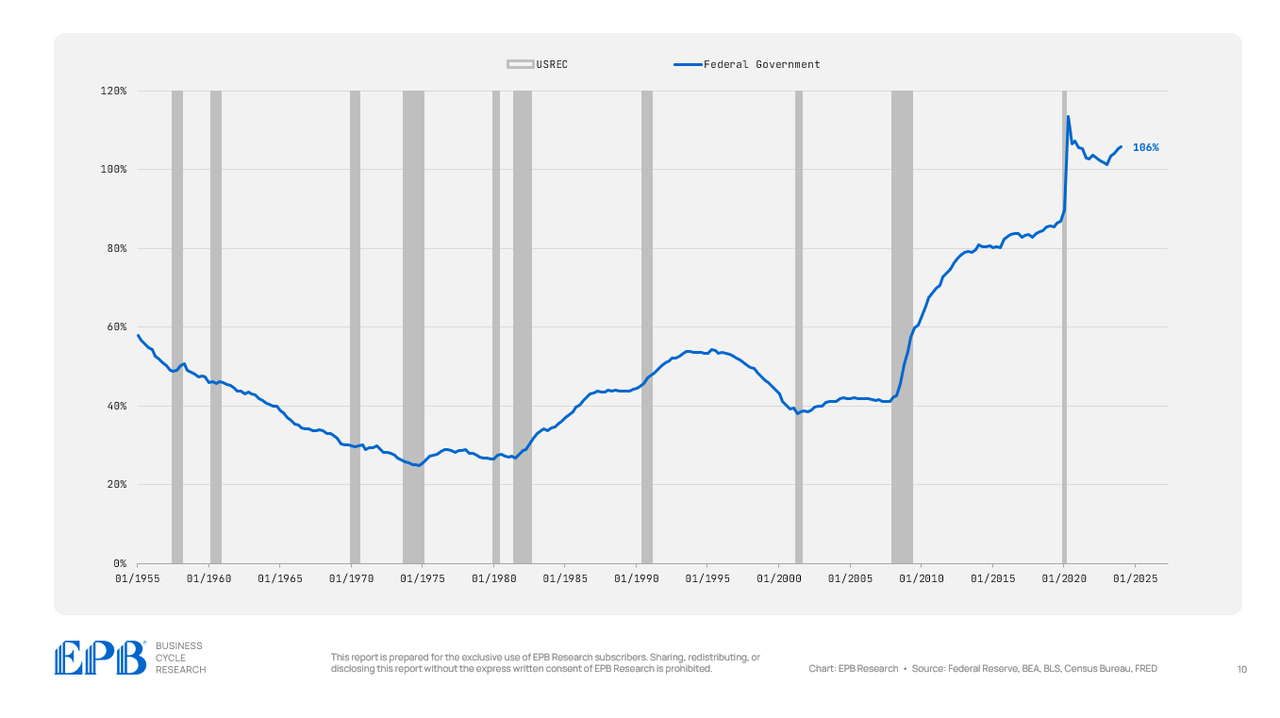
The state and local government debt burden has actually decreased quite dramatically, falling to just 12%.
Now, this does not mean state and local governments are being more fiscally responsible; rather, we are just rolling the debt up to the federal sector by the federal government providing support to state and local governments.
BEA, BLS, Federal Reserve, Census Bureau, EPB Research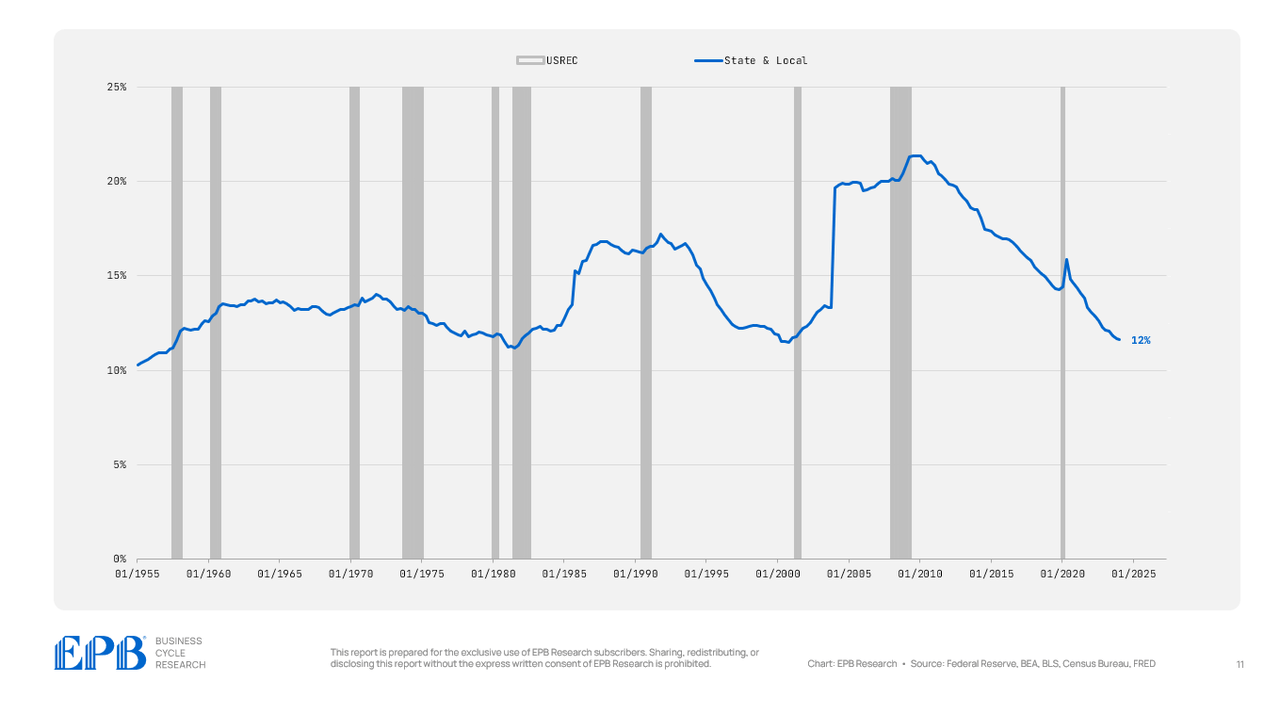
We are concentrating more debt or spending at the federal level.
In 2007, roughly 65% of government debt was federal debt. Today, almost 90% of government debt is federal debt.
BEA, BLS, Federal Reserve, Census Bureau, EPB Research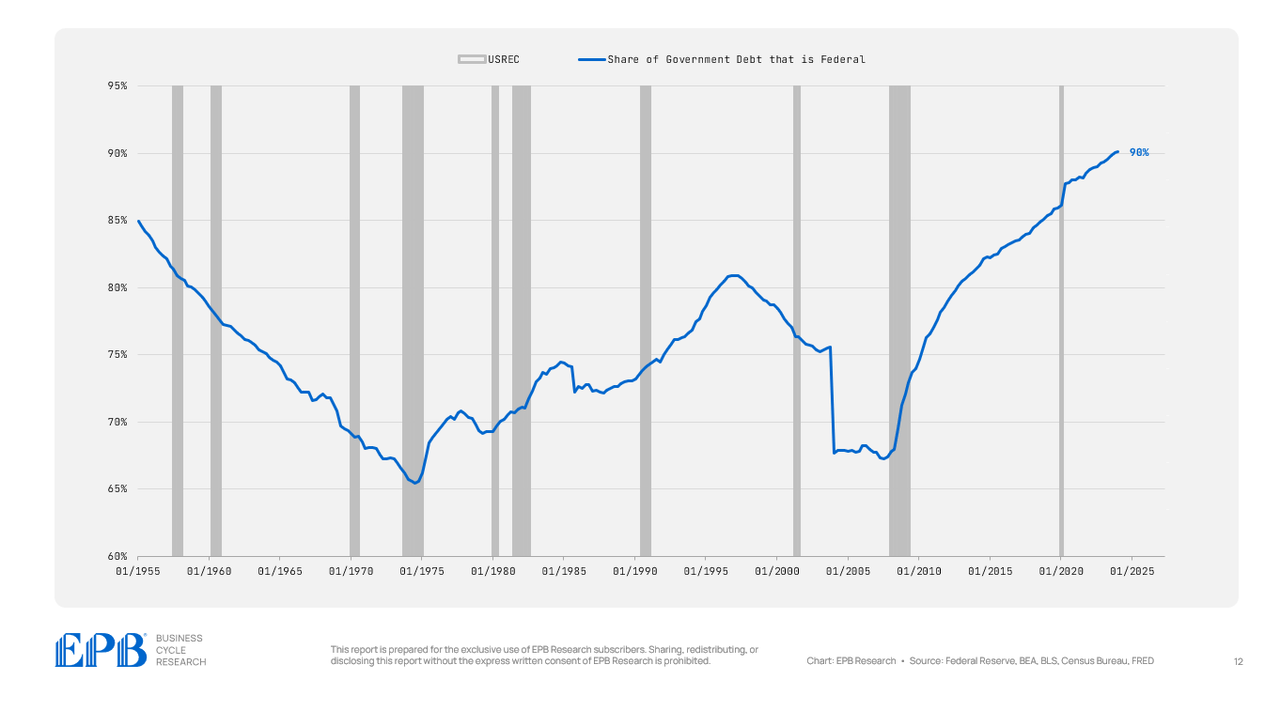
So not only are we shifting debt from the private sector to the public sector, we are rolling all the debt upwards to the federal government balance sheet.
So as we keep referencing this debt map, we can mark where the debt buildup is. We haven’t reduced total debt at all since 2007, but we’ve shifted debt to the public sector and more specifically to the federal government.
BEA, BLS, Federal Reserve, Census Bureau, EPB Research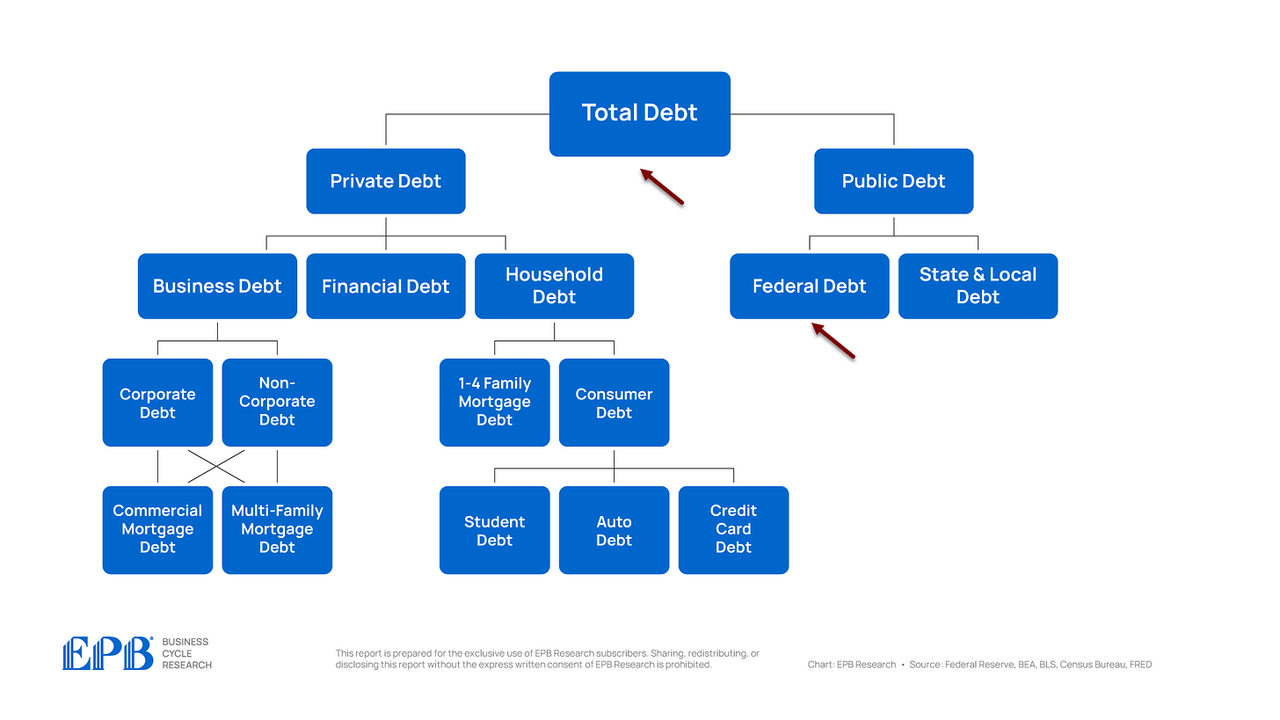
Let’s now move to the private sector and look at the three major sectors: the business sector, the financial sector, and the household sector. The aggregate private sector is in better shape than in 2007, but there are absolutely troubled pockets.
The business sector, which includes corporate and noncorporate businesses, currently holds a debt level equal to 75% of GDP, more than the 73% averaged from 2012 to 2019 and the 69% averaged in 2007. So, the overall business sector remains highly leveraged.
BEA, BLS, Federal Reserve, Census Bureau, EPB Research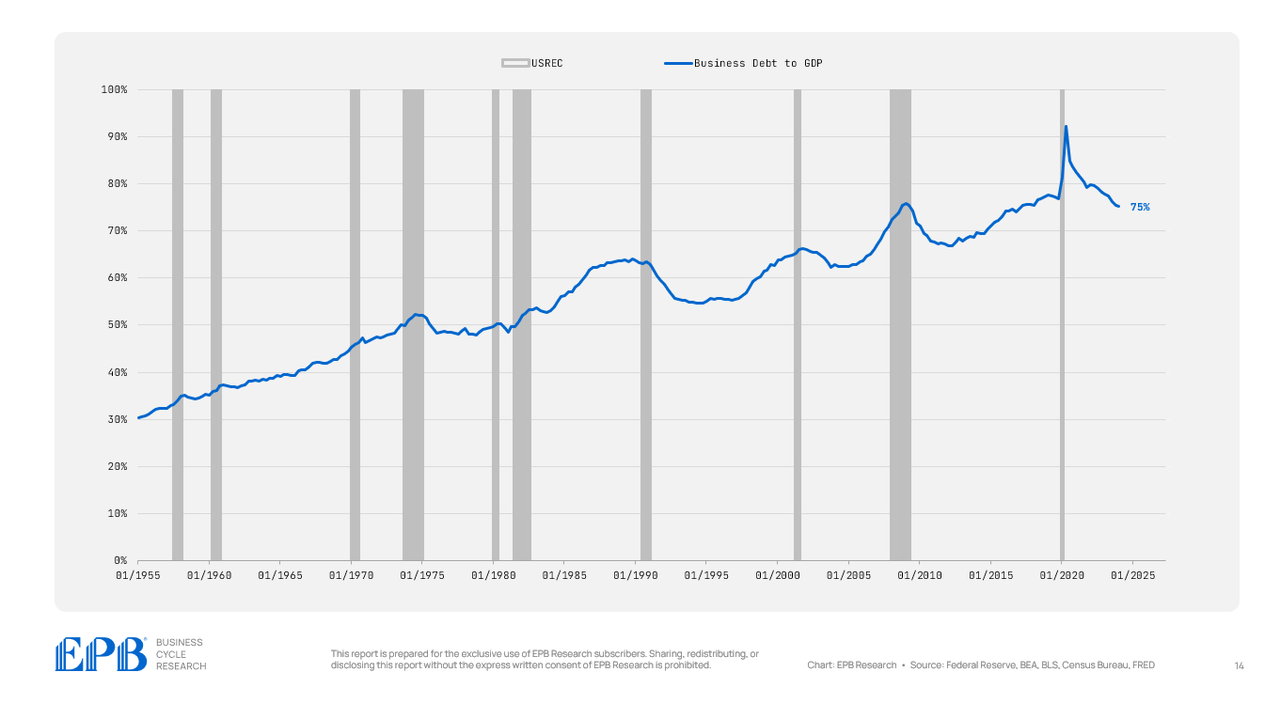
The financial sector was one of the major sources of trouble in the 2007 crisis, with average debt levels equal to 112% of GDP compared to 70% today. So the financial sector deleveraged in a big way.
BEA, BLS, Federal Reserve, Census Bureau, EPB Research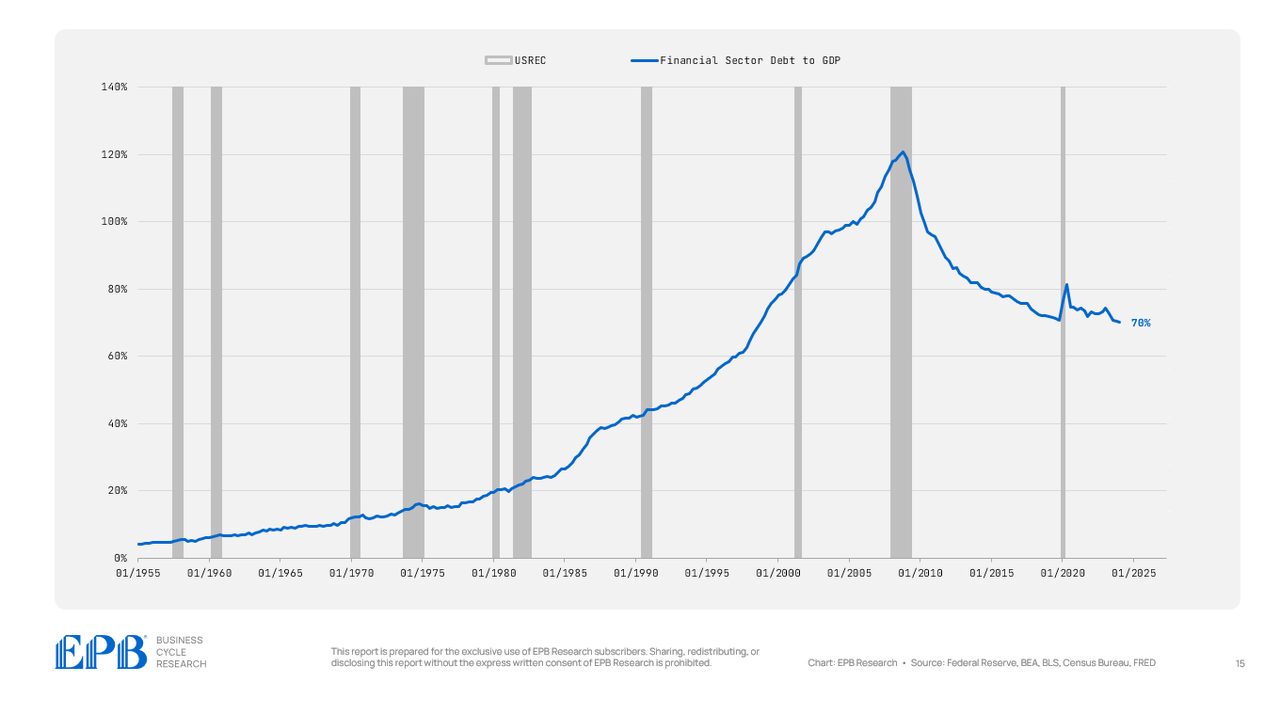
The household sector also deleveraged with a debt level of 71% of GDP today compared to almost 100% in 2007.
BEA, BLS, Federal Reserve, Census Bureau, EPB Research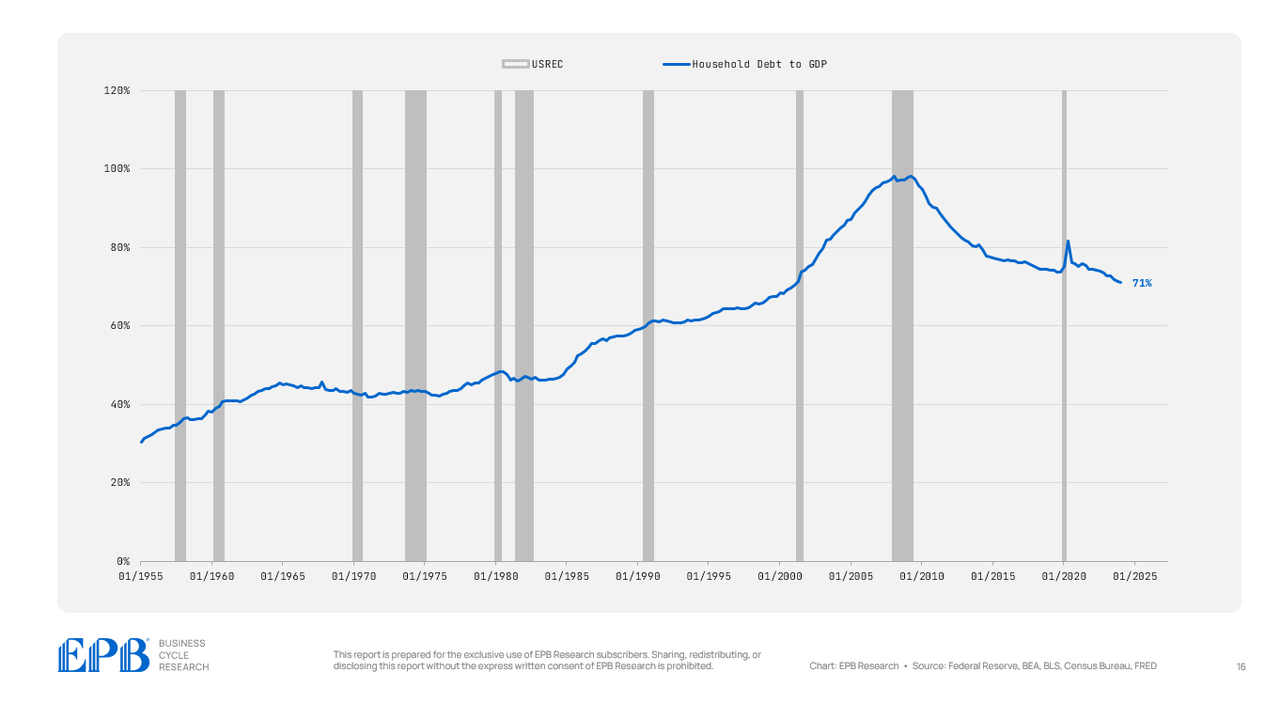
So the whole private sector deleveraged while the public sector massively increased leverage.
Within the private sector, the financial sector and household sector reduced debt while the business sector maintains a very highly leveraged position.
Let’s now move one layer deeper within the business and household sectors.
BEA, BLS, Federal Reserve, Census Bureau, EPB Research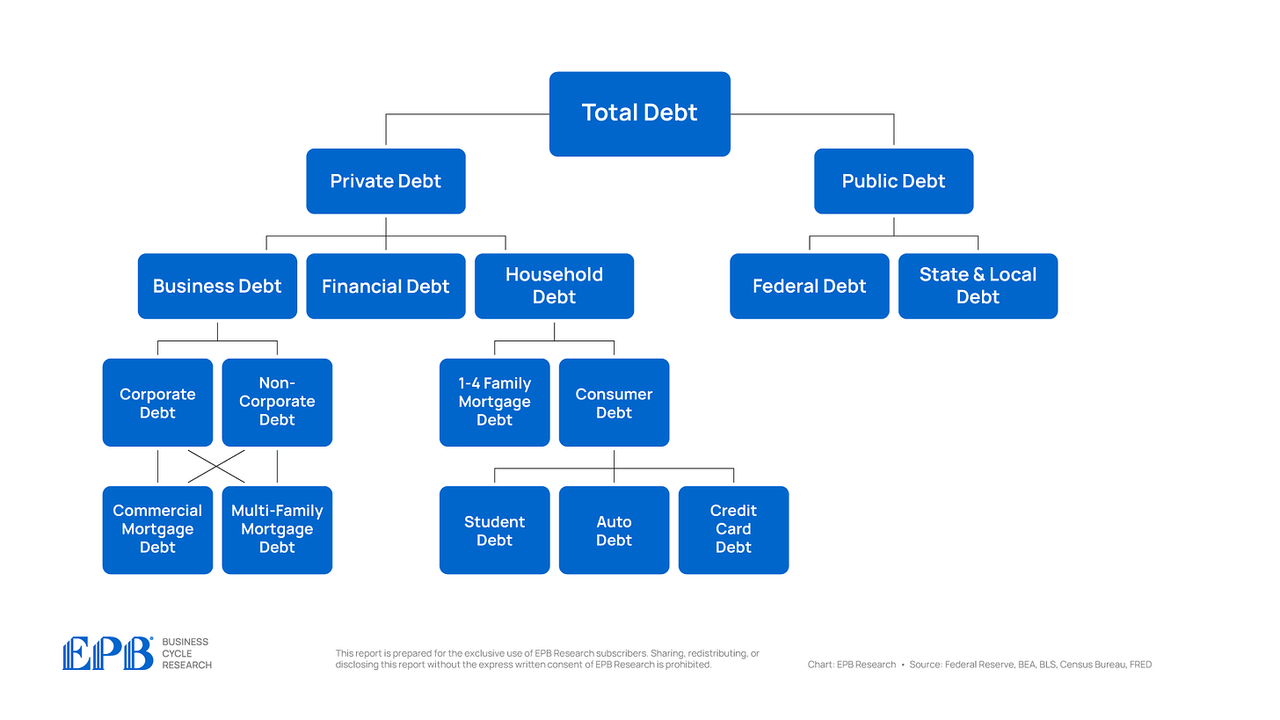
The business sector is made up of corporate and non-corporate businesses.
There’s no material difference between the corporate and non-corporate sectors – both have maintained a highly leveraged position. The corporate sector has a debt level of 49% of GDP compared to 44% in 2007.
The non-corporate business sector has a debt level of 27% of GDP today compared to 25% in 2007.
BEA, BLS, Federal Reserve, Census Bureau, EPB Research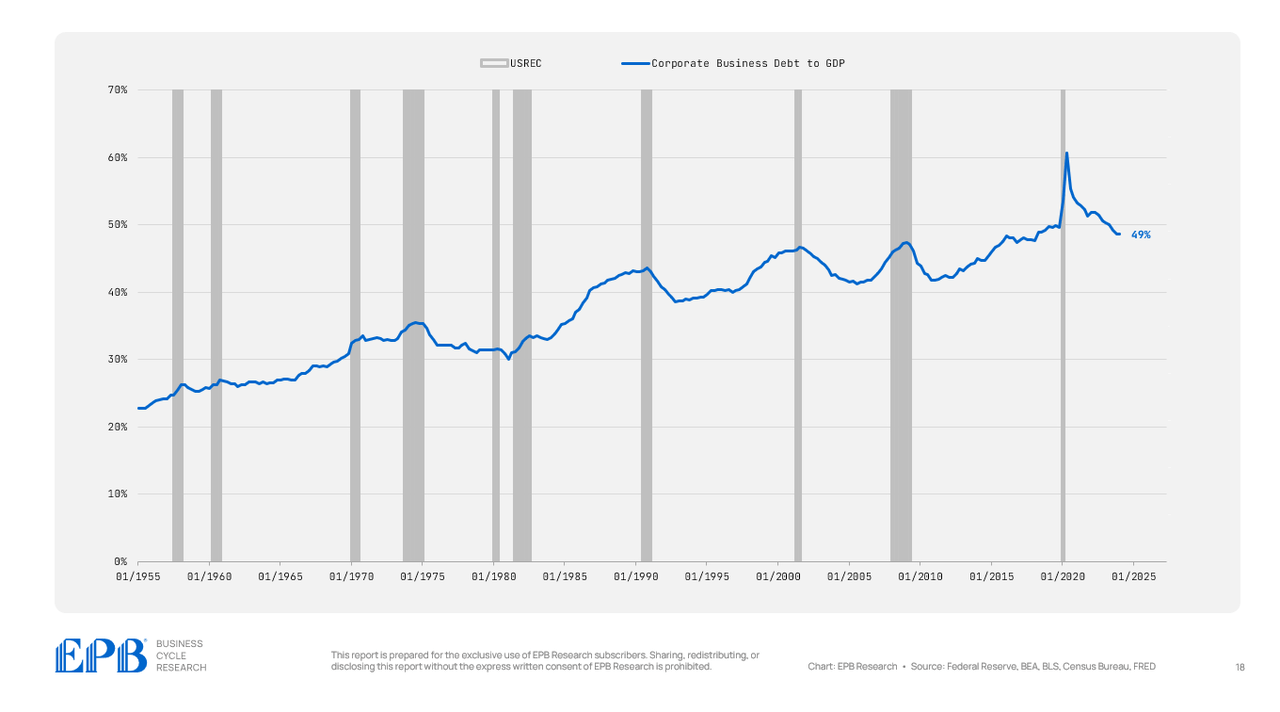
BEA, BLS, Federal Reserve, Census Bureau, EPB Research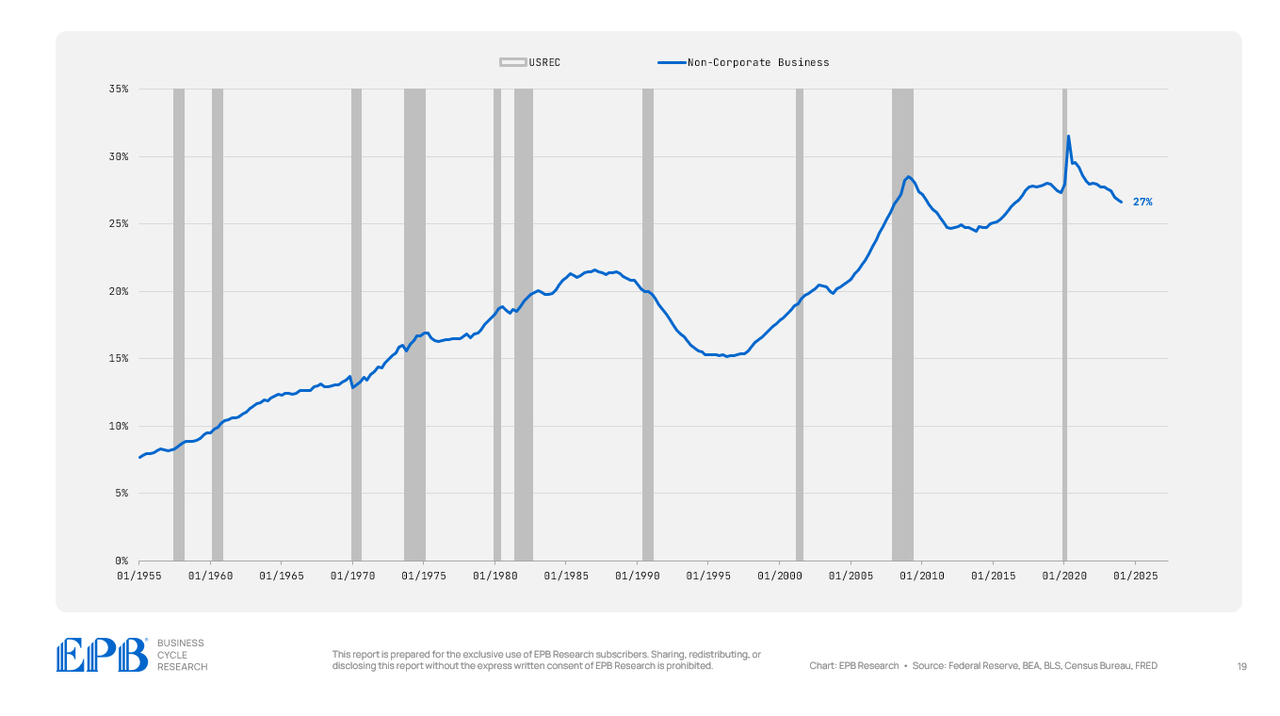
So, within the business sector, which is holding one of the highest debt burdens of all time, both the corporate and non-corporate sectors are contributing to the lack of deleveraging.
Household debt is made of two major categories, mortgage debt and consumer debt.
BEA, BLS, Federal Reserve, Census Bureau, EPB Research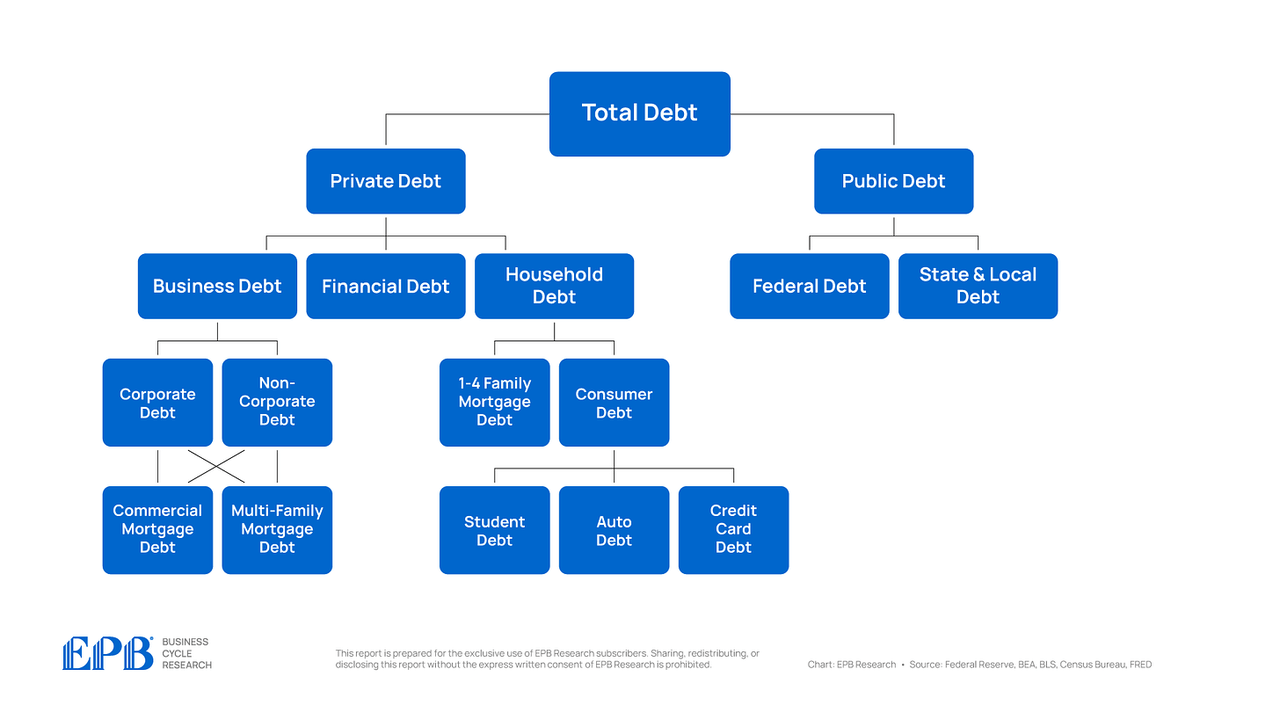
Let’s take a look at the fourth layer of our debt map for the household sector.
Mortgage debt has been dramatically reduced in the household sector, falling from 72% of GDP in 2007 to 52% in the 2012 to 2019 period to 46% today.
The household sector massively reduced mortgage debt.
BEA, BLS, Federal Reserve, Census Bureau, EPB Research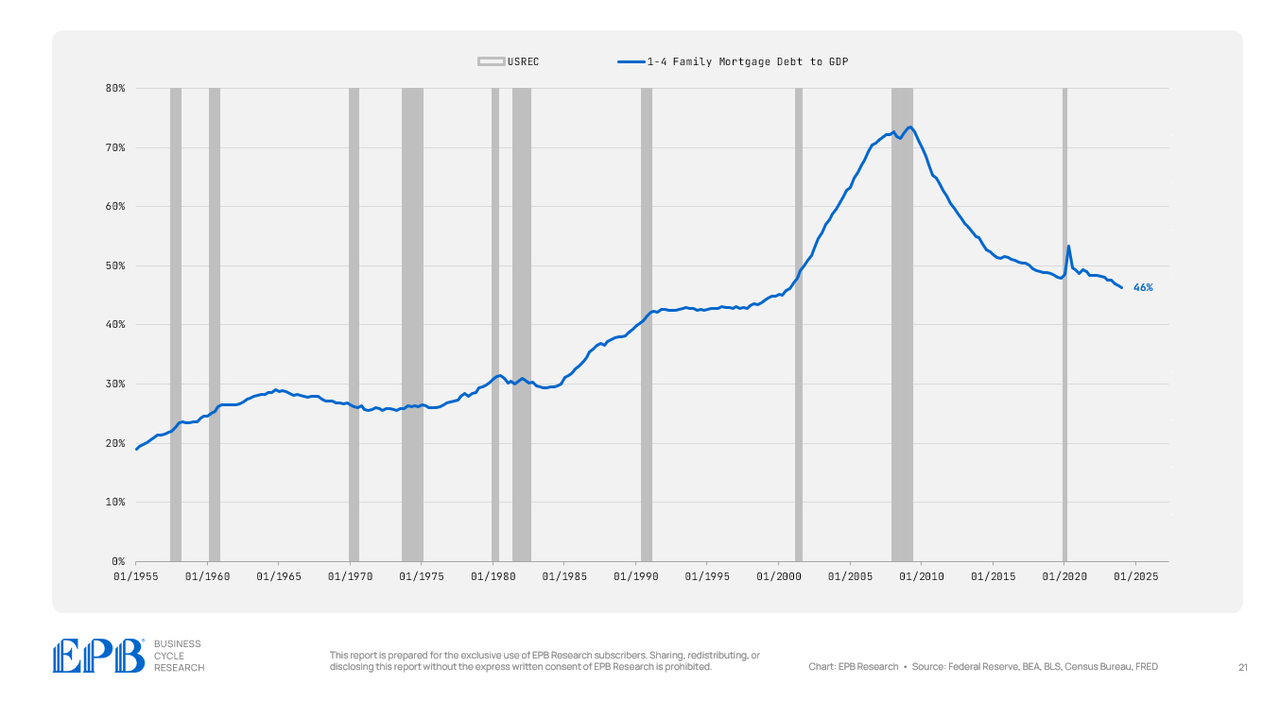
Consumer debt, on the other hand, which is student loans, auto loans, and credit card loans, is 18% today compared to virtually the same level in 2007 and the average from 2012 to 2019.
BEA, BLS, Federal Reserve, Census Bureau, EPB Research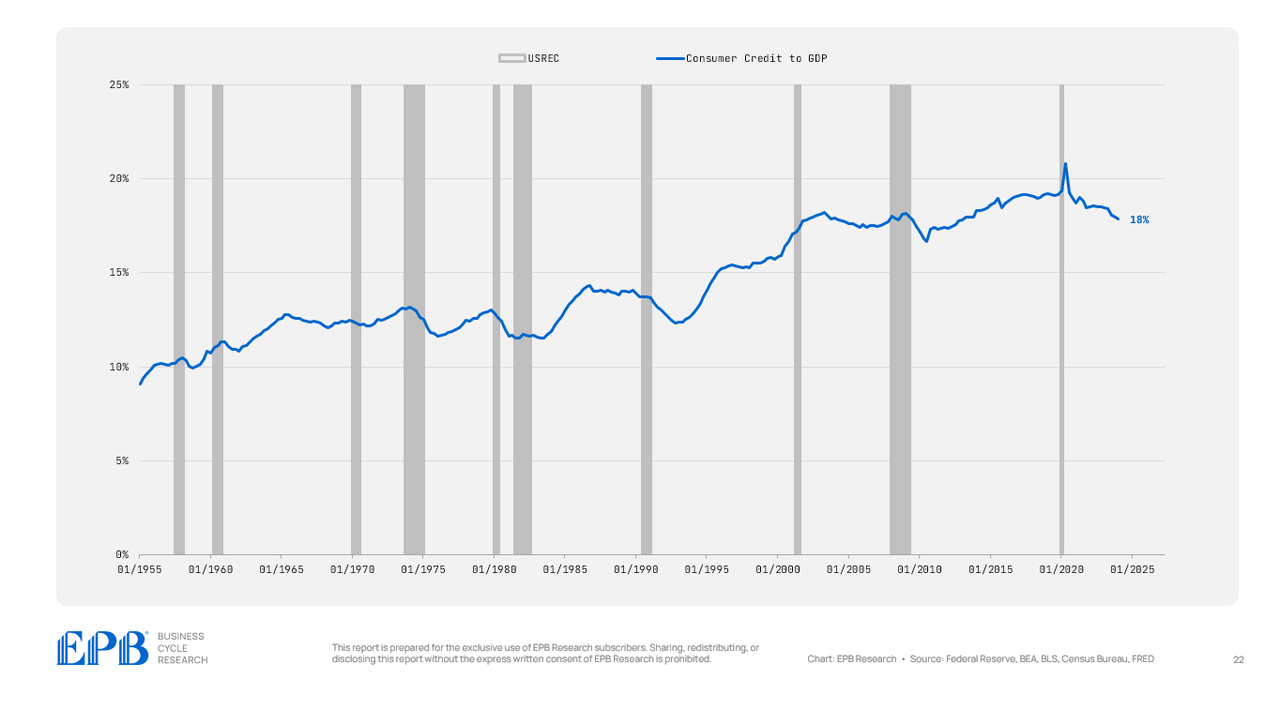
So what’s happened in the household sector is mortgage debt dropped sharply and consumer debt remained very elevated.
Wealthier households have more mortgage debt, and lower-income households have more consumer debt. So wealthier households have likely deleveraged but lower income households remain under an extremely high level of consumer debt.
Let’s now move to the fifth layer in our chart and look at the business sector which holds both commercial mortgage debt and multi-family mortgage debt.
Commercial and multi-family debt are held by both the corporate and noncorporate sectors generally.
BEA, BLS, Federal Reserve, Census Bureau, EPB Research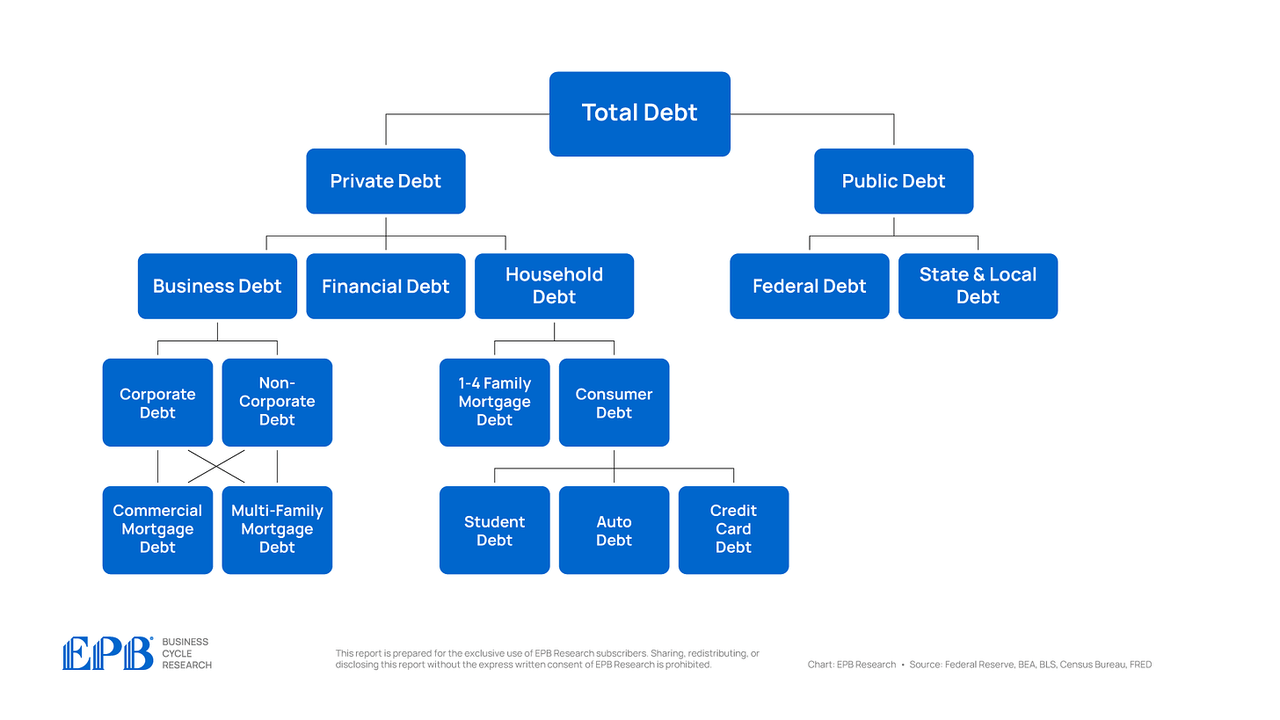
Commercial mortgage debt has declined in recent years, averaging 16% of GDP in 2007 compared to 13% today.
BEA, BLS, Federal Reserve, Census Bureau, EPB Research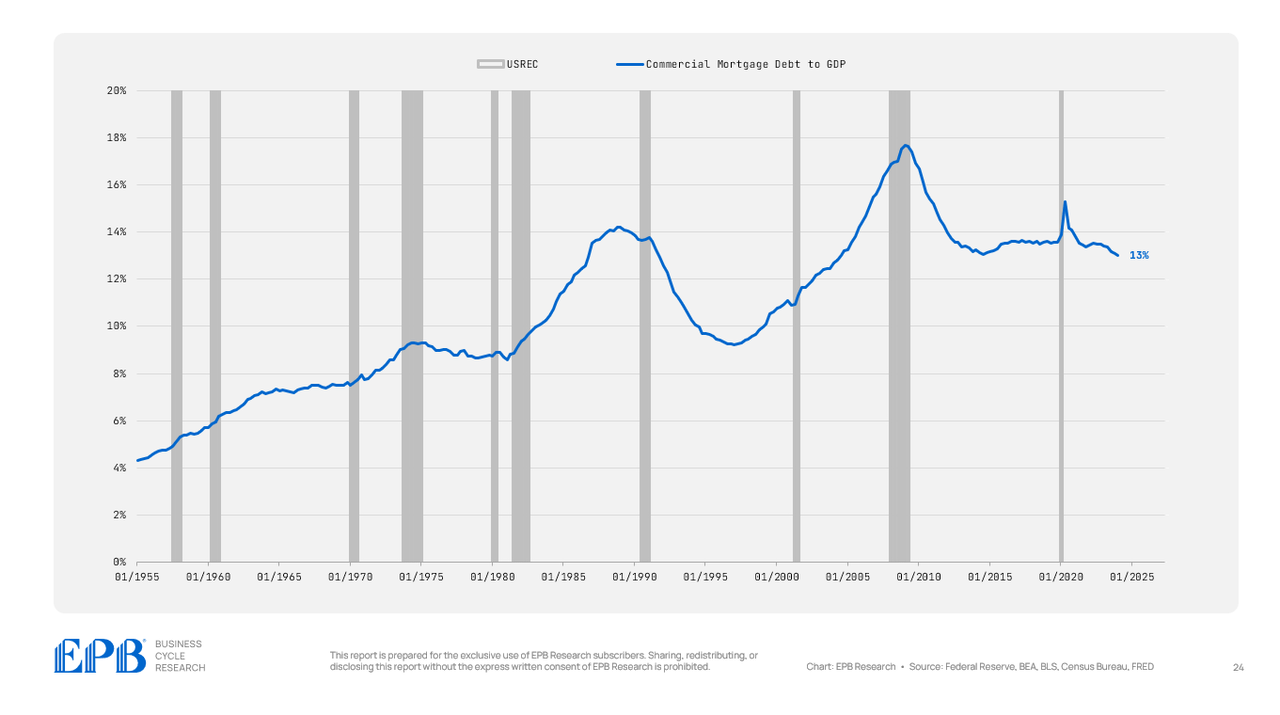
Multi-family debt, however, has been one of the most aggressive run-ups of any sector so far.
Multi-family mortgage debt fueled a huge overbuilding of apartments with debt in the sector now at 8% of GDP compared to 5% in 2007. The current level of multi-family mortgage debt is the highest level in history for the United States.
This is clearly one of the problem areas for this economic cycle, as some people will be holding multi-family debt against overbuilt properties that were not good investments.
BEA, BLS, Federal Reserve, Census Bureau, EPB Research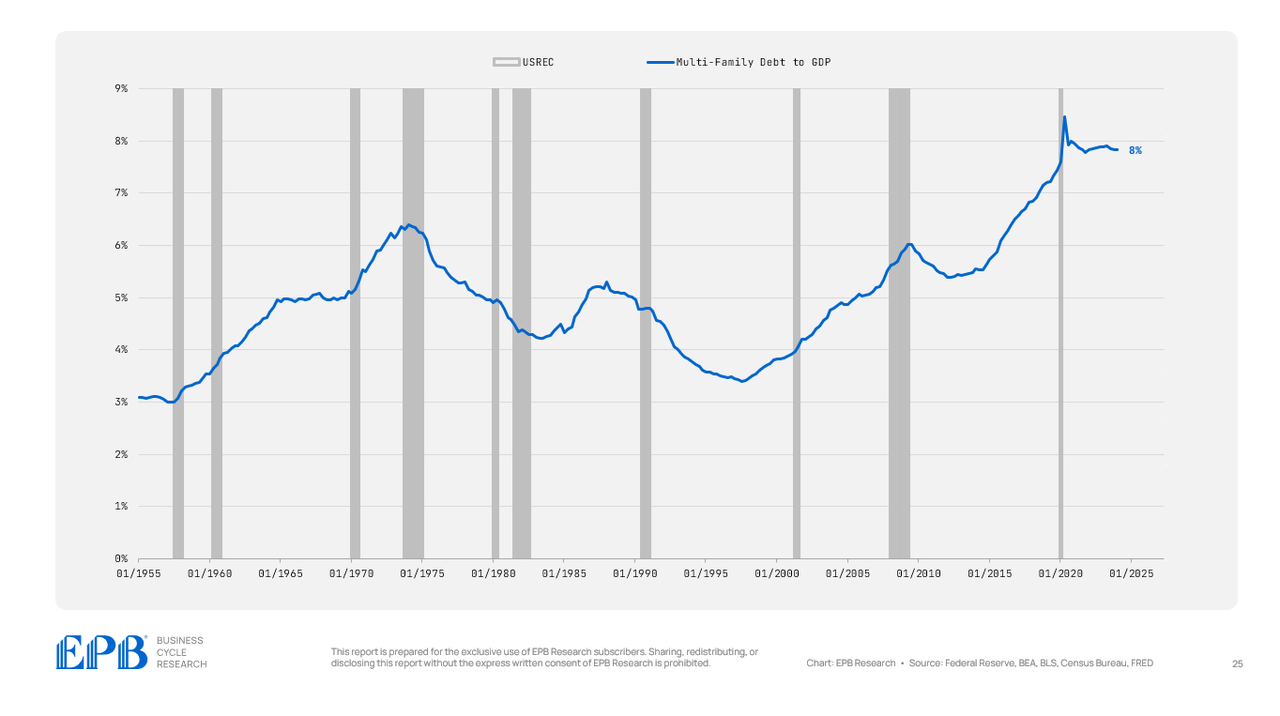
So we now know that within the business sector, multi-family debt is one of the problem areas, and it’s held by both corporate and noncorporate businesses, as well as smaller segments of the financial sector like regional banks.
Let’s wrap up by looking at the fifth layer of our debt map but for the household sector which are the three major segments of consumer debt.
BEA, BLS, Federal Reserve, Census Bureau, EPB Research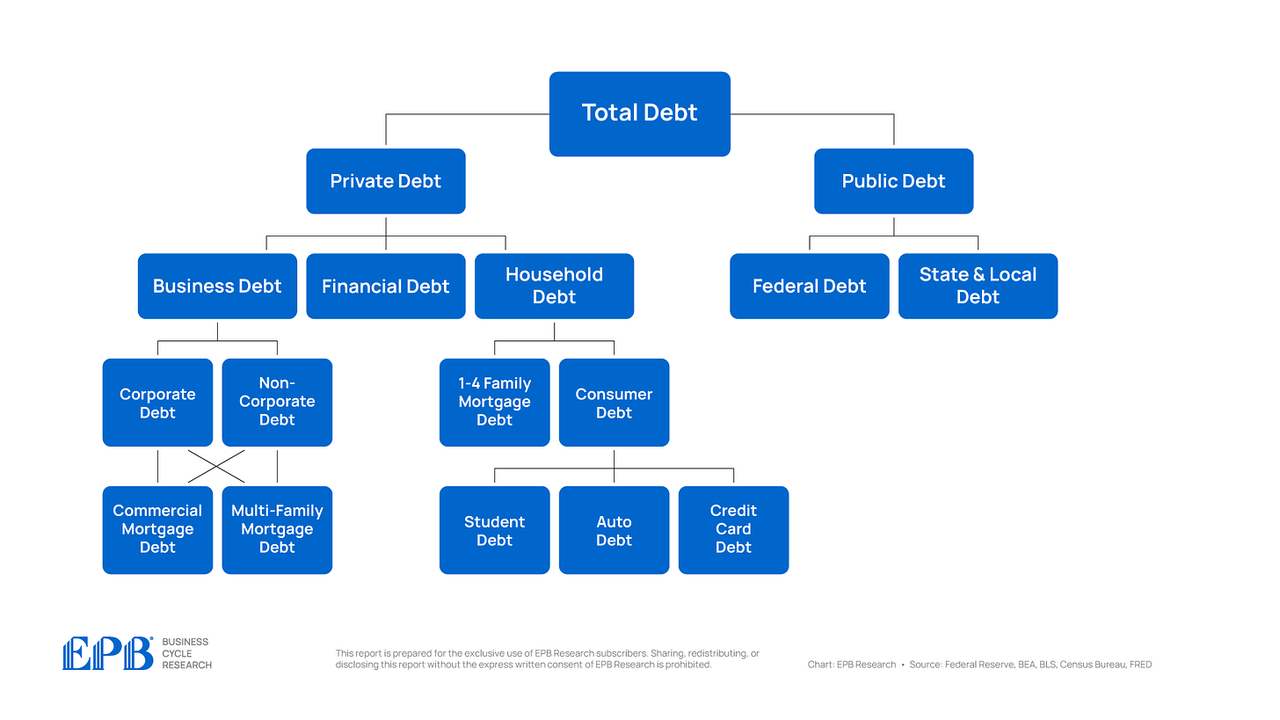
As a percentage of GDP, credit card debt has declined since the 2007 period, but auto debt has remained at very elevated levels, holding around 5% of GDP.
BEA, BLS, Federal Reserve, Census Bureau, EPB Research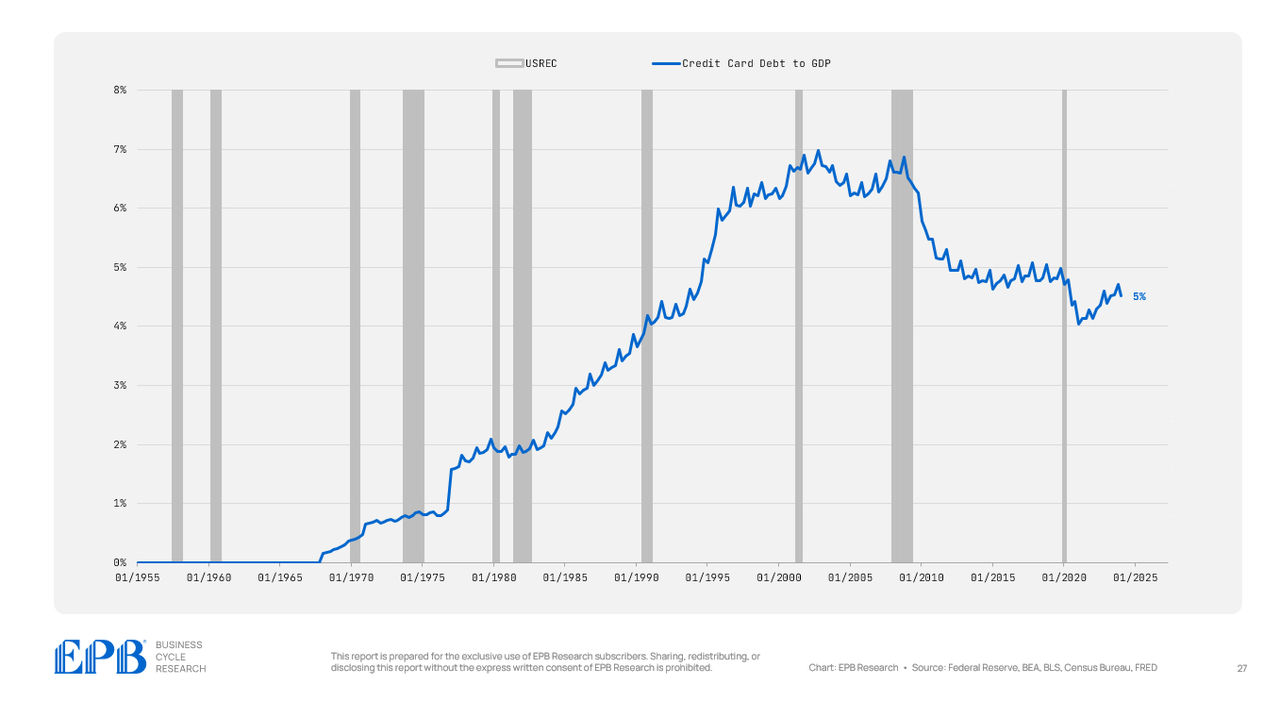
BEA, BLS, Federal Reserve, Census Bureau, EPB Research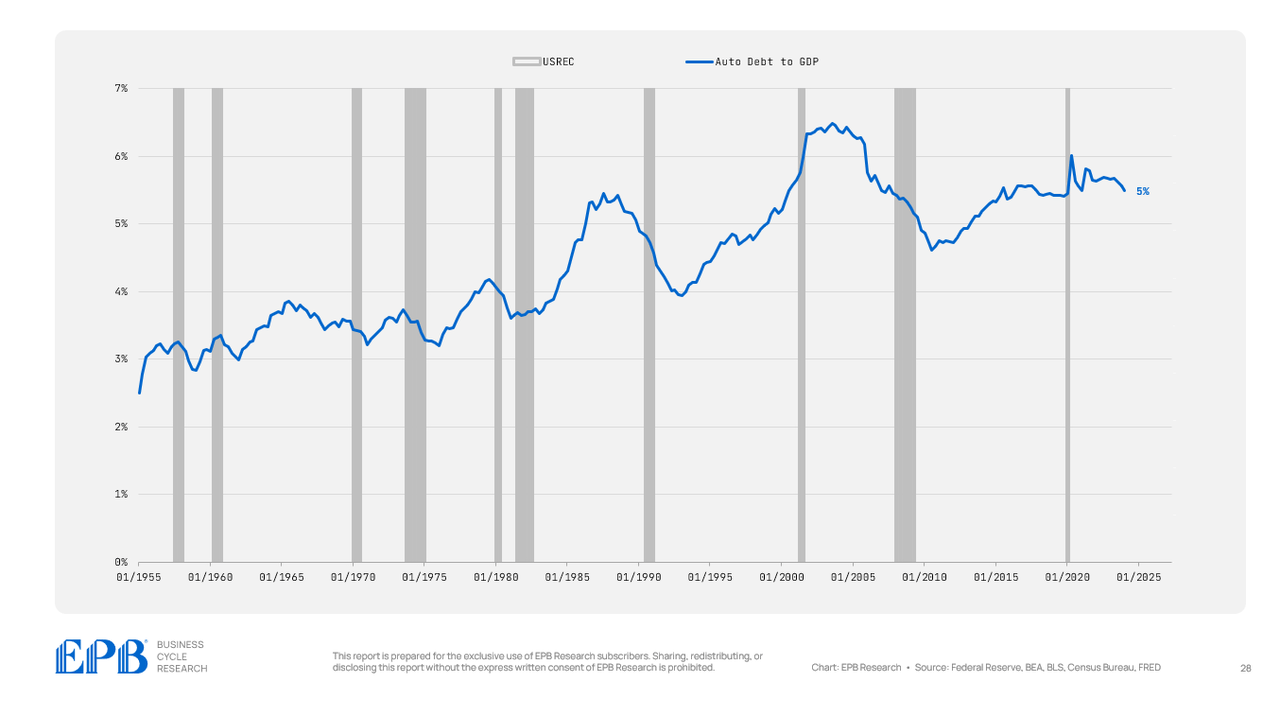
Student debt has exploded over the last 20 years, but it has declined after the pandemic, now at 6% of GDP.
BEA, BLS, Federal Reserve, Census Bureau, EPB Research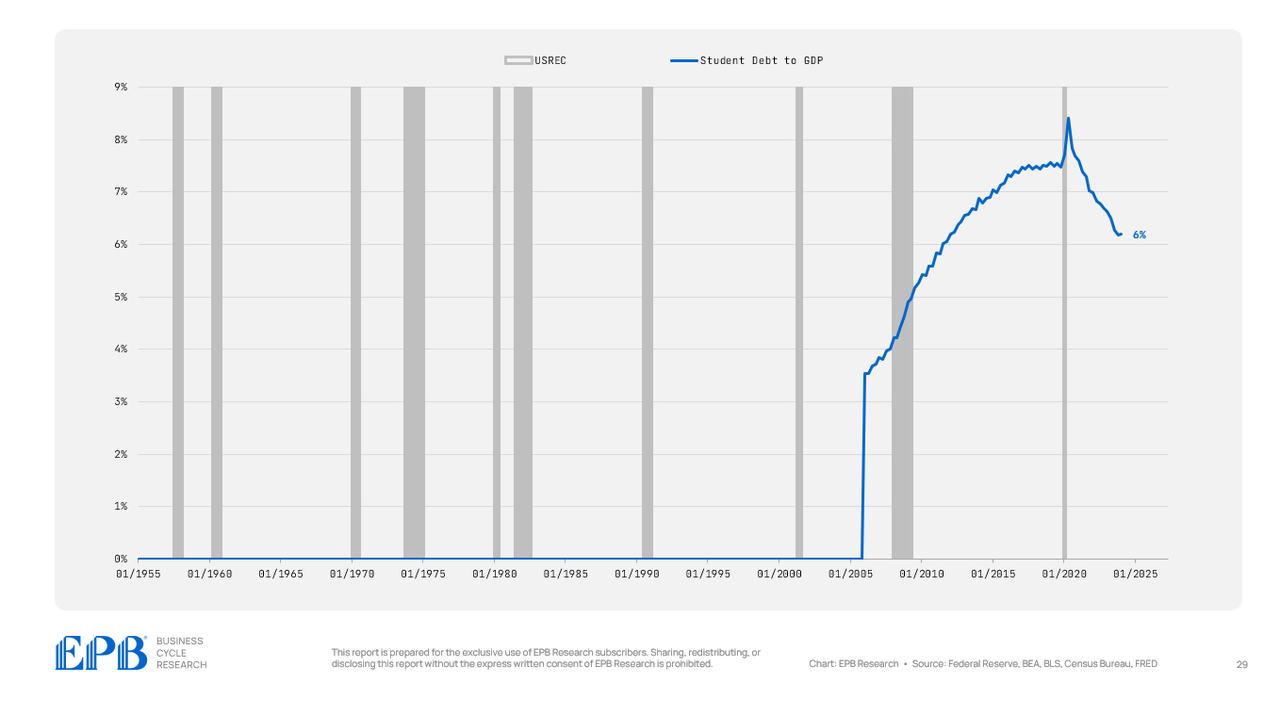
So when we visual the entire US debt map, and break it into five layers, we can identify the problems areas and the likely source of public and private sector stress.
The total US debt situation remains just as unmanageable as 2007, or the pre-pandemic period.
BEA, BLS, Federal Reserve, Census Bureau, EPB Research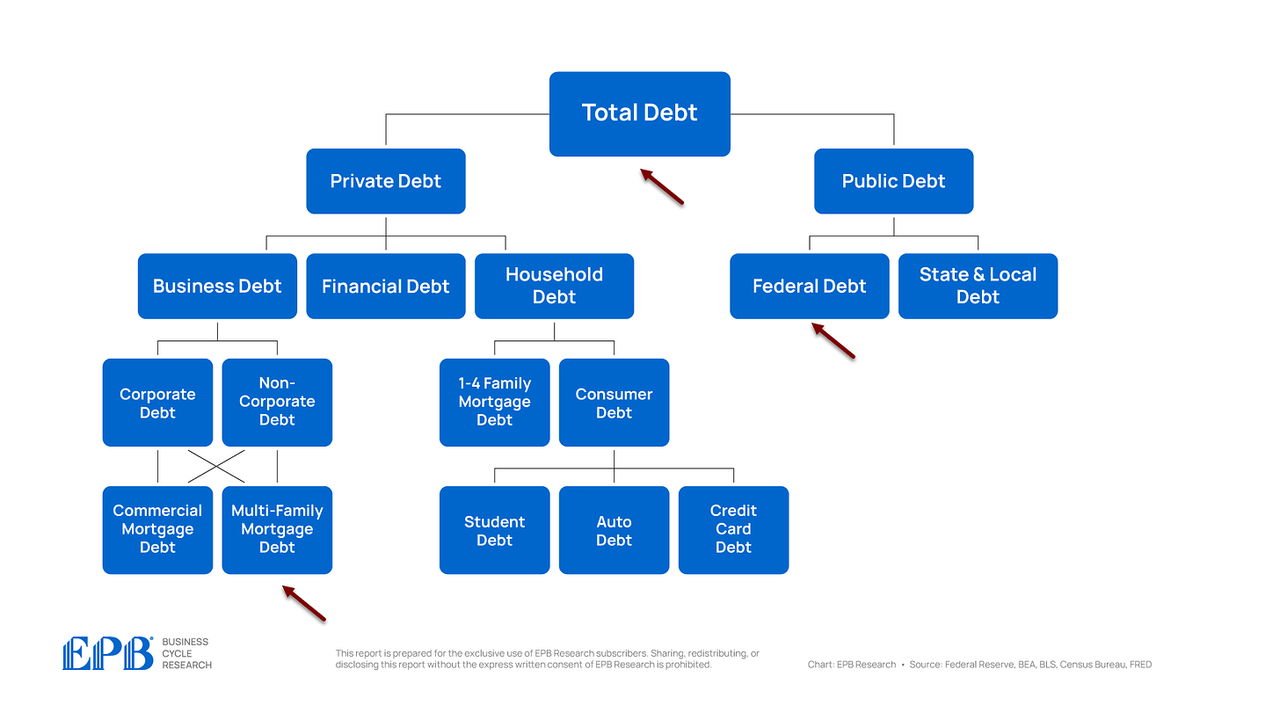
The private sector as a whole is in much better share than it has been over the last 20 years on average but the public sector is in far worse share with an increasing share of that debt burden, which up to 90%, has shifted specifically to the federal government.
Within the private sector, there are some pockets of increased debt burden. The corporate and noncorporate sector have a high level of multi-family apartment mortgage debt. There was huge overbuilding in multi-family apartments over the last 10-15 years and it’s clear that some of this multi-family mortgage debt is bad debt that will cause losses. There is always bad debt when leverage increases rapidly.
The household sector has a lower debt burden compared to the last 20 years but it’s all from a reduction in mortgage debt. Consumer debt burdens remain just as high as ever in the last 20 years, with student loans and auto loans being the biggest culprits.
Higher government debt, will continue to reduce the standard of living for the average American and within the private sector, we should be most focused on the buildup of debt within the multi-family sector, mostly owned by regional banks and private equity funds.
Credit: Source link