
• bitcoinBitcoin(BTC)$79,188.00-0.69%
  • ethereumEthereum(ETH)$2,496.640.21%
  • tetherTether(USDT)$1.00-0.01%
  • binancecoinBNB(BNB)$741.08-0.81%
  • rippleXRP(XRP)$1.40-0.71%
  • usd-coinUSDC(USDC)$1.00-0.01%
  • solanaSolana(SOL)$104.18-1.84%
  • tronTRON(TRX)$0.334074-0.34%
  • Figure HelocFigure Heloc(FIGR_HELOC)$1.060.00%
  • zcashZcash(ZEC)$1,168.84-3.18%
  • HyperliquidHyperliquid(HYPE)$85.31-3.10%
  • dogecoinDogecoin(DOGE)$0.0903661.37%
  • RainRain(RAIN)$0.016328-3.04%
  • USDSUSDS(USDS)$1.00-0.01%
  • moneroMonero(XMR)$517.23-2.69%
  • chainlinkChainlink(LINK)$12.955.30%
  • whitebitWhiteBIT Coin(WBT)$73.04-0.61%
  • leo-tokenLEO Token(LEO)$9.19-1.48%
  • cardanoCardano(ADA)$0.2217161.64%
  • stellarStellar(XLM)$0.1917224.33%
  • bitcoin-cashBitcoin Cash(BCH)$260.591.62%
  • daiDai(DAI)$1.000.01%
  • Ethena USDeEthena USDe(USDE)$1.00-0.01%
  • uniswapUniswap(UNI)$6.89-3.83%
  • litecoinLitecoin(LTC)$55.371.82%
  • USD1USD1(USD1)$1.000.01%
  • CantonCanton(CC)$0.106142-2.73%
  • the-open-networkGram (prev. Toncoin)(GRAM)$1.40-1.18%
  • hedera-hashgraphHedera(HBAR)$0.0826252.81%
  • avalanche-2Avalanche(AVAX)$8.167.04%
  • suiSui(SUI)$0.823.34%
  • Global DollarGlobal Dollar(USDG)$1.000.01%
  • shiba-inuShiba Inu(SHIB)$0.0000051.00%
  • nearNEAR Protocol(NEAR)$2.32-2.44%
  • paypal-usdPayPal USD(PYUSD)$1.00-0.01%
  • BlackRock USD Institutional Digital Liquidity FundBlackRock USD Institutional Digital Liquidity Fund(BUIDL)$1.000.00%
  • crypto-com-chainCronos(CRO)$0.057224-0.27%
  • tether-goldTether Gold(XAUT)$4,408.51-0.14%
  • Circle USYCCircle USYC(USYC)$1.140.00%
  • MemeCoreMemeCore(M)$1.12-0.12%
  • BittensorBittensor(TAO)$260.652.70%
  • okbOKB(OKB)$115.111.64%
  • Ripple USDRipple USD(RLUSD)$1.000.00%
  • Ondo US Dollar YieldOndo US Dollar Yield(USDY)$1.140.44%
  • AsterAster(ASTER)$0.771.80%
  • mantleMantle(MNT)$0.624.05%
  • aaveAave(AAVE)$132.50-0.56%
  • pax-goldPAX Gold(PAXG)$4,410.88-0.19%
  • OndoOndo(ONDO)$0.3881722.62%
  • polkadotPolkadot(DOT)$1.0913.67%
TradePoint.io
  • Main
  • AI & Technology
  • Stock Charts
  • Market & News
  • Business
  • Finance Tips
  • Trade Tube
  • Blog
  • Shop
No Result
View All Result
TradePoint.io
No Result
View All Result

September Fragility – Macro Charts Flashing Danger Signs (Technical Analysis)

September 25, 2023
in Market & News
Reading Time: 5 mins read
A A
September Fragility – Macro Charts Flashing Danger Signs (Technical Analysis)
ShareShareShareShareShare

PUGUN SJ

YOU MAY ALSO LIKE

Australian mother welcomes identical quadruplet girls

Janus Henderson Global Multi-Asset Capital Preservation Managed Account Q2 2026 Commentary

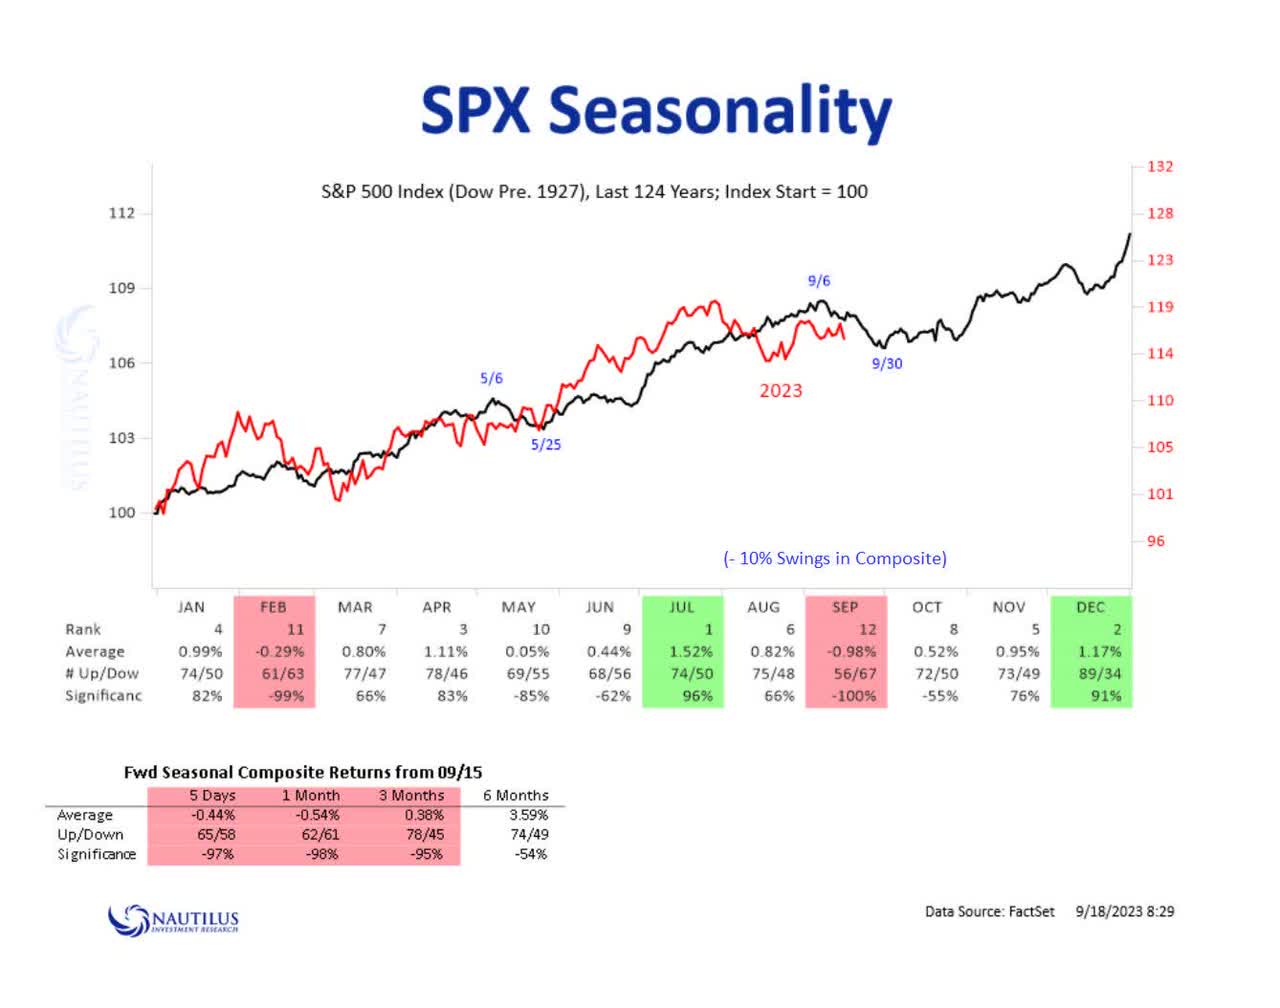
The good news is that we are almost out of September, the worst month of the year for equities!

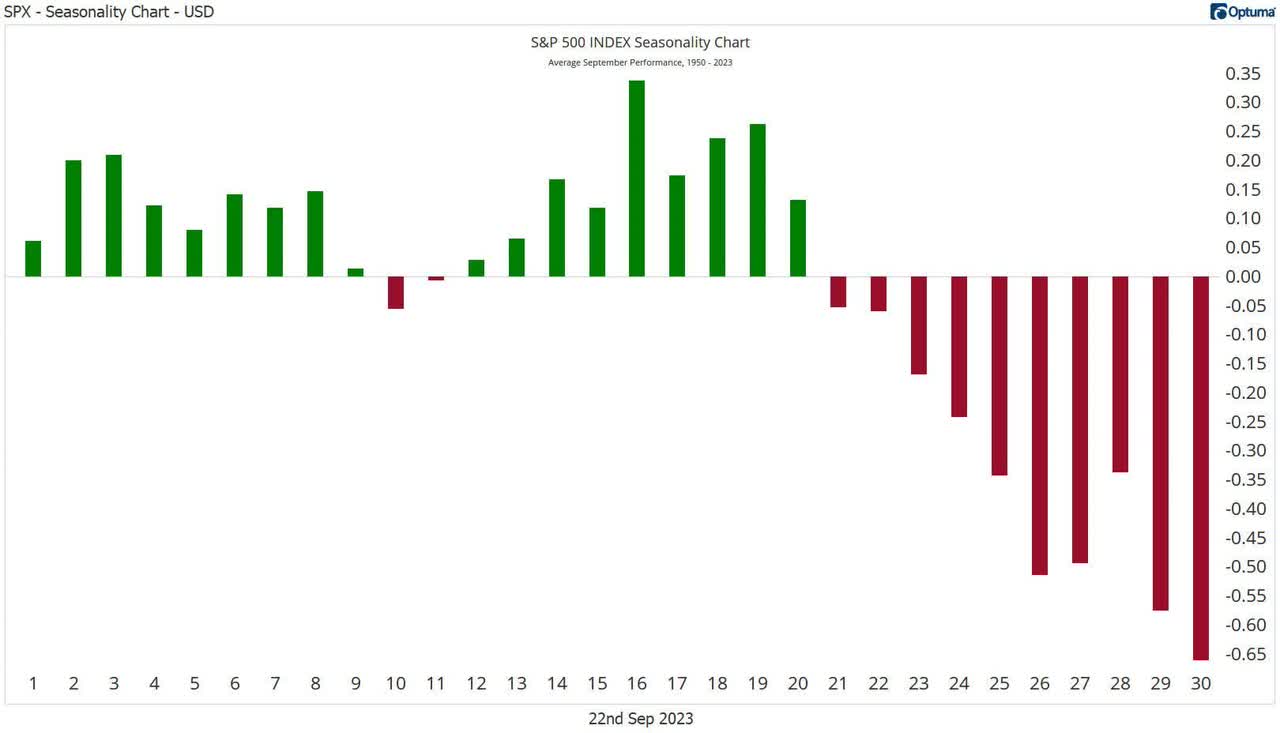
The bad news is that we now enter the last week of September, the worst week of the year for equities.

Nautilus

Nautilus

Optuma

Optuma

So far this year, the S&P 500 has played out pretty much in line with its seasonal trend, so it is definitely noteworthy to enter the final week of September with caution.

US equity indices tend to put in a near-term bottom sometime around the second week of October, before closing out the year on a strong note.

We can see the fragility in the markets on various macro charts.

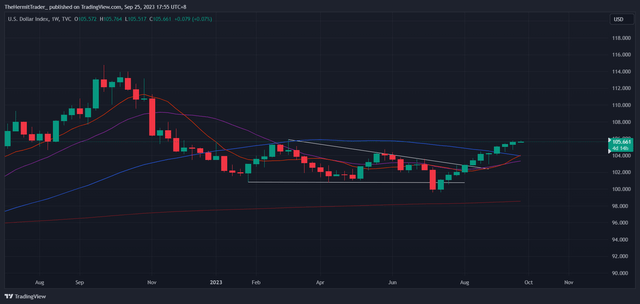
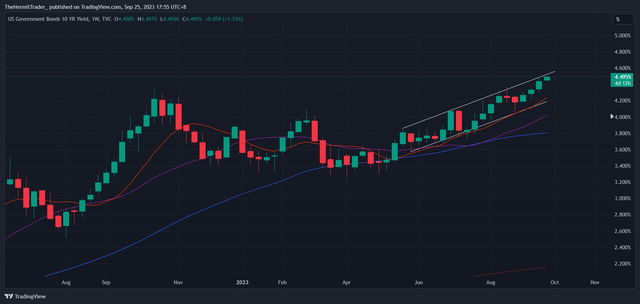
The markets are currently spooked out by rising bond yields, with central banks still erring on the hawkish side with regards to fighting inflation.

As such, unless the charts of bond yields and the USD show signs of topping out, risk sentiment is likely to remain in the danger zone. However, on the weekly charts, the dollar index and the US 10-year yield remain on strong uptrends. Not the time to throw caution to the wind yet.

Weekly Chart: Dollar Index

TradingView
TradingView

Weekly Chart: US10Y Yield

TradingView
TradingView

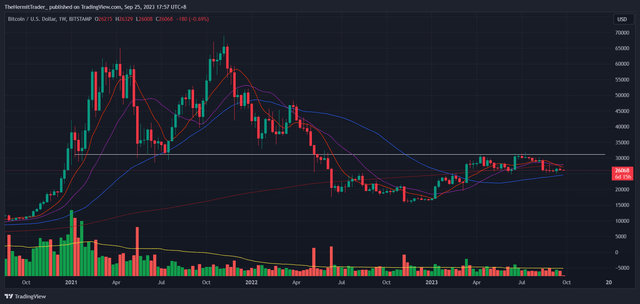
Macro risk proxies are also vulnerable on the charts.

Bitcoin was rejected at the 31k resistance, and now looks to be drooping lower.

Weekly Chart: Bitcoin

TradingView
TradingView

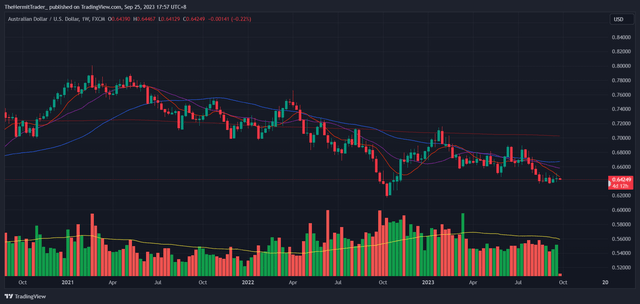
The Aussie may have been range bound against the USD for a month, but still remains on a downtrend, with price below its 10-week moving average.

Weekly Chart: AUD/USD

TradingView
TradingView

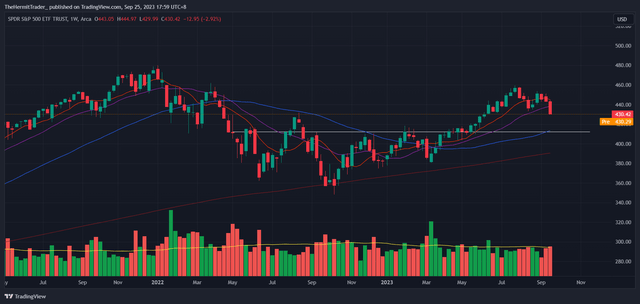
It is therefore not entirely surprising that the S&P 500 (SPY) is also reflecting a lot of this macro weakness on its weekly chart, breaking below its 10 and 20-week moving averages. More reliable supports should be around 413-415, which coincides with its 200-day moving average.

Weekly Chart: SPY

TradingView
TradingView

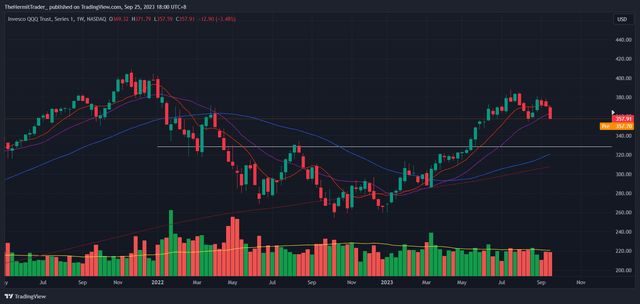
Similarly, the Nasdaq 100 (QQQ) looks to have put in a mini double top, breaking below its 10 and 20-week moving averages. More reliable supports should be closer to 330.

Weekly Chart: QQQ

TradingView
TradingView

This is not a prediction that the SPY and QQQ will drop to those levels. I am merely noting that if price gets there, and responds favourably there, then I will be a buyer.

I am also open to the markets reversing higher quickly and suddenly above those support levels, which is possible given the amount of negativity out there. A session which opens deep red but closes robustly green would be a good tell that the markets have put in a near-term bottom. In this case, I would be a buyer regardless whether price is near structural supports or not.

The two sectors that I am seeing a lot of strength in are uranium and oil & gas. I have written extensively on uranium and oil & gas weeks ago when they were showing early signs of breaking out.

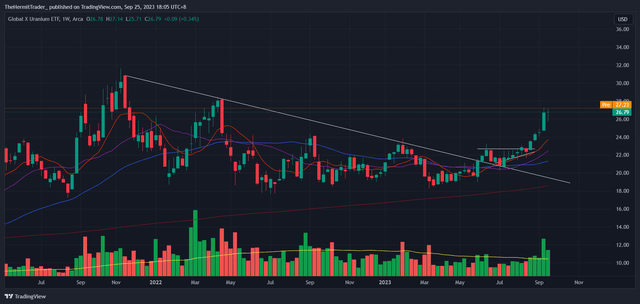
Uranium (URA) is out from a big base, and is leading the equity markets.

Weekly Chart: URA

TradingView
TradingView

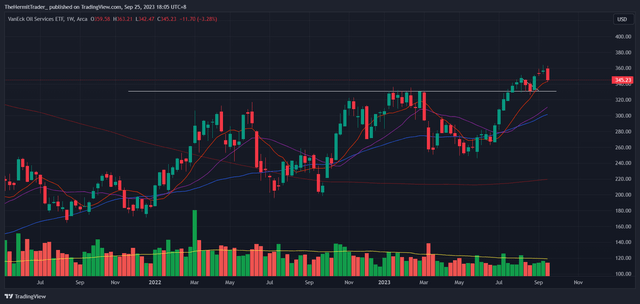
Oil Services ETF (OIH) is holding up very well after breaking out higher from its multi-month base. It is now testing its 10-week moving average.

Weekly Chart: OIH

TradingView
TradingView

To summarise my views on the market,

  • September has been a tough month for stocks, especially during its final week.
  • Many macro charts are flashing danger signs for risk sentiment. Coupled with the weak seasonality, it is prudent to wait on the sidelines instead of rushing in to buy too quickly.
  • Uranium and oil & gas are the two sectors that are holding up very well in the equity markets. If you need to be a buyer, then focus on these two sectors currently.

Credit: Source link

ShareTweetSendSharePin

Related Posts

Australian mother welcomes identical quadruplet girls
Market & News

Australian mother welcomes identical quadruplet girls

September 7, 2026
Janus Henderson Global Multi-Asset Capital Preservation Managed Account Q2 2026 Commentary
Market & News

Janus Henderson Global Multi-Asset Capital Preservation Managed Account Q2 2026 Commentary

September 7, 2026
Ratko Mladić, the ‘Butcher of Bosnia’, given hero’s funeral in Serbia – theguardian.com
Market & News

Ratko Mladić, the ‘Butcher of Bosnia’, given hero’s funeral in Serbia – theguardian.com

September 7, 2026
Fans line Madrid streets during Spain World Cup victory parade
Market & News

Fans line Madrid streets during Spain World Cup victory parade

September 7, 2026
Next Post
LLMs are surprisingly great at compressing images and audio

LLMs are surprisingly great at compressing images and audio

Leave a Reply Cancel reply

Your email address will not be published. Required fields are marked *

Search

No Result
View All Result
Town in Virginia celebrates its 101st pony swim

Town in Virginia celebrates its 101st pony swim

September 2, 2026
Microsoft Has Proven That An ROI Is Possible (NASDAQ:MSFT)

Microsoft Has Proven That An ROI Is Possible (NASDAQ:MSFT)

September 4, 2026
Wildberries says warehouses struck in drone attack

Wildberries says warehouses struck in drone attack

September 5, 2026

About

Learn more

Our Services

Legal

Privacy Policy

Terms of Use

Bloggers

Learn more

Article Links

Contact

Advertise

Ask us anything

©2020- TradePoint.io - All rights reserved!

Tradepoint.io, being just a publishing and technology platform, is not a registered broker-dealer or investment adviser. So we do not provide investment advice. Rather, brokerage services are provided to clients of Tradepoint.io by independent SEC-registered broker-dealers and members of FINRA/SIPC. Every form of investing carries some risk and past performance is not a guarantee of future results. “Tradepoint.io“, “Instant Investing” and “My Trading Tools” are registered trademarks of Apperbuild, LLC.

This website is operated by Apperbuild, LLC. We have no link to any brokerage firm and we do not provide investment advice. Every information and resource we provide is solely for the education of our readers. © 2020 Apperbuild, LLC. All rights reserved.

No Result
View All Result
  • Main
  • AI & Technology
  • Stock Charts
  • Market & News
  • Business
  • Finance Tips
  • Trade Tube
  • Blog
  • Shop

© 2023 - TradePoint.io - All Rights Reserved!