
gopixa
Schwab U.S. Dividend Equity ETF (NYSEARCA:SCHD) is a great tool for passive income investors to reduce the complexity that comes with the construction of a well-balanced dividend investment portfolio that produces recurring income.
The exchange-traded fund is very well-diversified and limits investors’ downside potential in the event of a broader market pullback.
I think investors with a long-term investment horizon could profit from an investment in this well-balanced, low-fee ETF. Since the ETF’s portfolio has a focus on companies like AbbVie (ABBV), Broadcom (AVGO) and The Coca-Cola Company (KO), Schwab U.S. Dividend Equity ETF is a great way, in my view, of investing in America’s largest companies and bet on their success in a strong economy.
An Investment In Schwab U.S. Dividend Equity ETF Is A Bet On America
Schwab U.S. Dividend Equity ETF is overweight large-cap U.S. stocks which essentially makes the ETF a bet on the largest companies in the United States. The fund managed $49.8 billion in net assets as of July 28, 2023 and the fund has a convincing long-term investment record.
Since the ETF’s inception date in October 2011, Schwab U.S. Dividend Equity ETF has achieved an average annual return of 12.98% and over a ten-year period very closely matched the return of the Dow Jones U.S. Dividend 100 Index (the benchmark index): SCHD posted an annual average return of 11.71% (on a net asset value basis) while the Dow Jones U.S. Dividend 100 achieved an annualized return of 11.81%. The marginal difference in average annualized returns shows that the fund is very effectively managed and has very little tracking error.
Schwab U.S. Dividend Equity ETF has also outperformed the Morningstar Large Value investment category which posted an average annual return of 9.11% over a ten year period.
Average Annualized Returns (Schwab U.S. Dividend Equity ETF)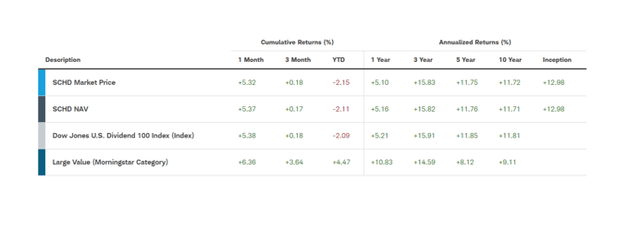
Diversification Is Key, Upside In A Growing Economy
Schwab U.S. Dividend Equity ETF is well-diversified in terms of industries. The majority of investments have been made in the Industrials sector which accounted for 18% of the ETF’s investments as of 30 June, 2023. The next biggest category was Healthcare with 16% and Financials with 15% representation. The majority of sectors are pro-cyclical, meaning the profits of the underlying industries typically expand in a growing economy.
With its broad diversification across industries and investments into the largest companies in such sectors, Schwab U.S. Dividend Equity ETF is indeed a bet on the growth of the U.S. economy as a whole.
Portfolio Diversification (Schwab U.S. Dividend Equity ETF)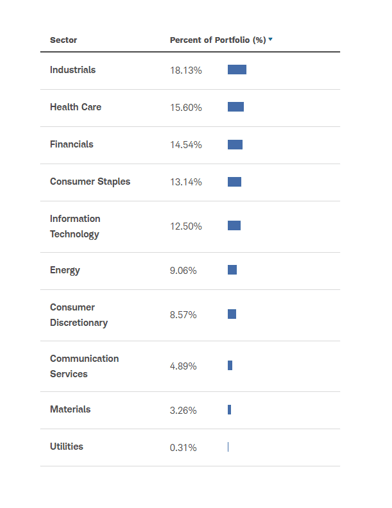
The top ten holdings of the ETF include Broadcom, Cisco (CSCO), Amgen (AMGN), The Coca-Cola Company, Home Depot (HD), to name just a few. The ETF’s largest holding, as of June 30, 2023, was Broadcom which represented 4.3% of the fund’s net assets.
Many of the fund’s investment holdings, like Coca-Cola or AbbVie have long histories of growing their dividend pay-outs which makes SCHD not only compelling from a yield point of view (the present yield is 3.4%), but also from a distribution growth angle.
Passive Income Investors Should Never Underestimate The Role Of Fees
One very underrated part of investing relates to investing costs. By choosing ETFs that charge low fees, which compound just like interest over a long period of time, investors can actively boost their investment returns.
In fact, dismissing the role of expenses can cost investors tens of thousands of dollars in investment returns over the long haul.
Below is an example as to how quickly the value of an investment portfolio erodes, depending on what fees the fund charges its investors. In effect, the higher the fund’s management fees, the more brutal the compounding effect, and the less ‘after-fee’ value is left for investors that save and invest money for their retirement.
Investment Costs (Onedayinjuly.com)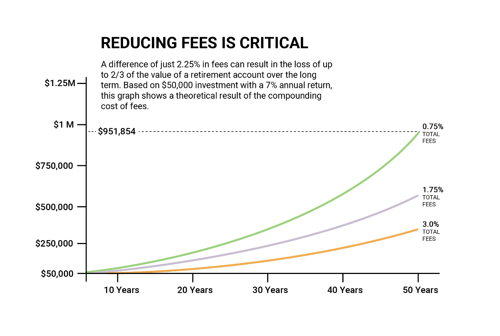
With that said, Schwab U.S. Dividend Equity ETF has a total expense ratio of only 0.06% which is very competitive. By focusing on high-quality ETFs like Schwab U.S. Dividend Equity ETF with low expense ratios, they can sleep well, compound their investment returns and know that the fund is not overcharging them.
Small Discount To NAV
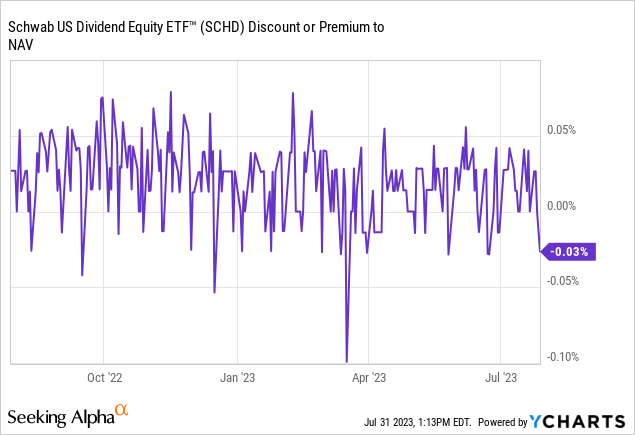
Schwab U.S. Dividend Equity ETF, like most ETFs, trades very close to net asset value. The fund presently trades at a marginal discount of 0.03% to the last reported net asset value of $75.65 per share.
What Is The Risk With Schwab U.S. Dividend Equity ETF?
Like I said, Schwab U.S. Dividend Equity ETF is a bet on America which means a recession would probably lead to a decline in stock values of the ETF’s mostly pro-cyclical constituents.
The U.S. economy’s growth, however, accelerated to 2.4% in the 2Q-23 and there has been so much talk about a recession that I start to think that it might never happen at all. With inflation also easing, I actually think that Schwab U.S. Dividend Equity ETF, as a fund with a pro-cyclical, large-cap orientation could do very well over the next year or so.
My Conclusion
Schwab U.S. Dividend Equity ETF is now my largest ETF holding in my investment portfolio that is geared towards income-producing securities.
Even though my investment portfolio largely consists of high-yielding BDCs and REITs that have attractive dividend growth prospects, I think the addition of Schwab U.S. Dividend Equity ETF can make a lot of sense for passive income investors because of the low-fee structure, the very good diversification of the fund as well as the fund’s attractive long-term NAV growth record.
Credit: Source link