













































pixelfit/E+ via Getty Images
Dear Investors,
The Portfolio* appreciated +3.2% (net of fees) year-to-date in 2026.
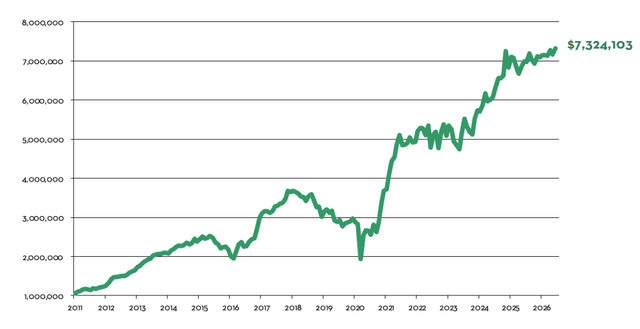
Since inception, Marram has generated +632.4% cumulative return and +13.7% annualized return, net of fees.
For monthly details, see Historical Performance Returns* at the end of this letter. Also, please refer to your separate account statement for exact account return figures.
$1,000,000 Investment in Marram (Net Return, Inception 1/1/2011 to 6/30/2026)*
About Marram
Marram is an outsourced long-term investment solution, focused on growing wealth for retirement or legacy purposes. We began as a service for a small circle of friends and family. Our investor-friendly fee structure (lower than hedge funds), terms (separate accounts, no lock-up), and high standards of care and excellence reflect those origins. Our portfolio manager has the majority of her family’s liquid net worth invested in the same strategy – we eat our own cooking – ensuring that we shepherd your investment with the utmost care, as we would our own.
Portfolio Allocations
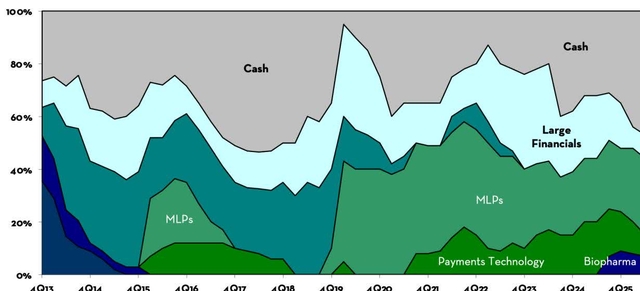
Below is the target portfolio allocation – the optimal allocation as of the writing of this letter. Investor separate accounts may differ from this allocation due to changes in asset prices, availability to acquire/divest securities in the marketplace, margin & trading capabilities, and tax considerations. Over time, all investor separate accounts converge upon the target portfolio allocation.
- Energy Infrastructure / Master Limited Partnerships (MLPs): 29% NAV
U.S.-based energy infrastructure companies with assets indispensable to the smooth function of modern society. These investments were made in early 2020, taking advantage of commodity price volatility, shareholder turnover, forced selling, and uncertainty related to the long-term demand of fossil fuels which drove prices to extremely low levels. Since then, geopolitical strife, inflation, and increased recognition of the limitations of renewable energy have led market participants to reembrace fossil fuels, which in turn has lifted the prices of our MLPs. The size of this allocation peaked at 42% of NAV in late-2021, and has gradually declined due to harvested gains, trimmed exposures, and M&A activity. MLPs remain a cornerstone of our portfolio given favorable industry demand dynamics, stable cash flows, conservative balance sheets, reasonable valuations (at ~10x Cash Flow), generous cash distributions, and inflation protection. See our 2019 4th Quarter and 2021 2nd Quarter Letters for our MLP investment thesis.
- Large-Cap Financials: 9% NAV
In March 2023, during the brief U.S. banking crisis, the prices of large regional banks fell precipitously as investors indiscriminately sold shares, allowing us to significantly increase our exposure at fire-sale prices. Since then, our regional bank investments have increased significantly in value, returning on average 30%+ IRR. While we continue to view the sector favorably over the long term given its ability to generate steady profits of ~10%+ annually, unrealized securities losses have reversed, valuations have expanded, and we are observing a gradual easing in credit underwriting standards across the industry. We have prudently reduced this exposure over the past 2 years. See our 2023 1st Quarter Letter for our Regional Bank investment thesis.
- Payment Technology: 8% NAV
Growing payment technology businesses with favorable revenue tail winds, generating cash profits, actively reinvesting profits back into the business at high incremental margins, and self-funding future growth with little/no equity dilution. We purchased these investments at attractive prices that will generate at least 3X return in 5 years based on reasonable topline growth & margin assumptions. See our 2022 1st Quarter Letter for more details.
- Biopharma & Other: 7% NAV
The biopharma sector has been out of favor, weighed down by political and other factors that have led to lower industry $ R&D spend. Taking a long-term view, we believe society will continue to need (and demand) new drugs and other health innovations (obesity treatments, next-generation vaccines & therapeutics, medical/diagnostic devices, and cosmetic enhancements, etc.), all of which requires data collection, rigorous testing, and regulatory validation prior to mass market rollout. With time, we believe capital will return to the sector and industry $ R&D spend will reaccelerate. We initiated a diversified basket allocation that allows us to benefit from recovery of industry $ R&D spend from cyclical lows while minimizing adverse exposure tied to individual drug development outcomes.
- Cash & Cash Equivalents: 47% NAV
This category will fluctuate depending on investment opportunities available in the marketplace. We collect ~4% interest and dividends per year which continuously replenishes our cash balance.
Portfolio Return* Analysis & Future Positioning
The Portfolio* appreciated +2.7% (net of fees) in the 2nd quarter, bringing our year-to-date (YTD) 2026 return to +3.2%.
So far this year, MLP Energy Infrastructure, Large Financials, and Biopharma contributed positively to results, while Payment Technology investments detracted (~2.5%) from performance. Our payment names are down, on average, ~23% YTD. Valuations in the payment technology sector continue to compress, a consequence of growth-oriented capital rotating into AI, semiconductor, and other high-momentum trades. The long-term fundamentals of our payment names remain on track (except for PYPL, which we discuss below). If prices move lower, we plan to buy more and increase the sizing.
Since our last update, we made the following portfolio adjustments:
- PYPL. We exited PayPal at a slight loss because our investment thesis broke when the Board abruptly fired the CEO and appointed a successor, a former HP executive with no payments, technology, or product experience. Our original thesis rested on a capable management team investing to rebuild the technology, product, and brand. When the facts changed, we acted accordingly.
- ICLR. We exited ICON plc, a contract research organization, at breakeven. Further research revealed a moat deteriorating faster than originally thought. Unhealthy industry competitive dynamics have led to a lack of pricing power in recent years, which may only worsen as AI-enabled cost efficiencies drive peers to compete further for business volume by cutting prices.
- Berkshire Hathaway (BRK.A)(BRK.B). We purchased more shares of Berkshire Hathaway, increasing our investment to 5.5% NAV. Berkshire owns a portfolio of businesses, selected by two of the greatest investment minds in the past century for their durable competitive moats and inflationary pricing power. The company has recently begun repurchasing its own shares again, a signal that management sees value at current prices.
In the past few years, our focus on reasonable prices, operating fundamentals, and diversified basket approach to portfolio construction has contributed to steady positive returns, while avoiding much of the extreme price swings observed in market indices — a satisfactory outcome given the risks we have avoided along the way.
Our portfolio remains conservatively positioned amid a backdrop of high valuations and macroeconomic risks:
- Decades-long tailwinds that supported corporate profitability are reversing or becoming less reliable (peaceful geopolitics, support for global free trade and low-cost supply chains, favorable population demographics, low interest rates, etc.)
- Artificial intelligence is introducing broad, complex, and fast-moving uncertainty into business profit pools.
- Valuations across many sectors continue to reflect optimistic, near speculative, assumptions
- Elevated expectations applied to potentially less profitable and less predictable outcomes equate to a potent recipe for future volatility.
We continue to favor a “bird in hand” approach, preferring investments that generate meaningful current cash flow. We also hold ample cash dry powder, which currently stands at 47% of NAV, collecting ~4% interest per year while awaiting future deployment.
Rather than fixating on price movements, which are outside of our control, we focus on what we can control: our research process. We continue to research, update, and expand our Wishlist of businesses we would like to own, and the corresponding prices at which we would eagerly buy them. Once those prices are reached, we will act. If not, we will wait, adhering to our long-standing strategy of patient opportunism.
We have also begun integrating AI tools into our research process to accelerate speed and depth of information gathering from primary sources (SEC filings, press releases, presentations, transcripts, etc.). Judgment and investment decisions remain, as always, with your portfolio manager. This has allowed us to expand our Wishlist at a faster pace. In effect, we are setting a larger number of traps across the investment landscape – more efficiently, with the help of AI – ready to snap up bargains for when opportunities emerge.
Please do not hesitate to reach out with any questions. As always, thank you for your trust. We look forward to continuing our capital compounding adventures in the years ahead.
Yours very truly,
Vivian Y. Chen, CFA, Portfolio Manager, Marram Investment Management
Appendix: Historical Performance Returns (Net Of Fees)*
Original Post
Editor’s Note: The summary bullets for this article were chosen by Seeking Alpha editors.
Credit: Source link








