

We Are
The KKR Income Opportunities Fund (NYSE:KIO) is a closed-end fund, or CEF, that income-focused investors can purchase to achieve their goals. As is the case with most income-focused closed-end funds, this one seeks to satisfy its investors by investing in various fixed-income securities. The current monetary environment has allowed these securities to be far more attractive in terms of yield than they have been over most of the past twenty years. After all, even an ordinary money market fund is yielding more than 5% today.
The KKR Income Opportunities Fund naturally does much better than that, as its 10.95% current yield beats just about anything that can be seen in the market. However, its yield is only average relative to its peers. We can see that here:
|
Fund |
Morningstar Classification |
Current Yield |
|
KKR Income Opportunities Fund |
Fixed Income-Taxable-High Yield |
10.95% |
|
Allspring Income Opportunities Fund (EAD) |
Fixed Income-Taxable-High Yield |
9.82% |
|
Apollo Tactical Income Fund (AIF) |
Fixed Income-Taxable-High Yield |
12.00% |
|
BlackRock Corporate High Yield Fund (HYT) |
Fixed Income-Taxable-High Yield |
9.89% |
|
Neuberger Berman High Yield Strategies Fund (NHS) |
Fixed Income-Taxable-High Yield |
13.75% |
|
Pioneer High Income Fund (PHT) |
Fixed Income-Taxable-High Yield |
9.02% |
|
Western Asset High Income Opportunity Fund (HIO) |
Fixed Income-Taxable-High Yield |
11.36% |
Admittedly, there may be a few readers who question whether all of these funds are direct peers. After all, funds such as the Apollo Tactical Income Fund are currently more focused on investing in leveraged loans, while others such as the BlackRock Corporate High Yield Fund are invested almost exclusively in junk bonds. That is a valid concern, but as is the case with the Apollo fund, the KKR Income Opportunities Fund varies its portfolio depending on whether leveraged loans or traditional junk bonds are more attractive. The Morningstar classification of all of these funds is the same, and they are all likely to be purchased by investors with the same objectives. As such, the comparison might work even if not all of these funds are completely identical. The point here is that the KKR Income Opportunities Fund is not the highest-yielding debt closed-end fund in the market, and we can easily see that here.
As regular readers can likely remember, we previously discussed the KKR Income Opportunities Fund in late November 2023. The market has generally been pretty strong since that time, as various market participants have been eagerly anticipating a substantial reduction in interest rates in the near future. As such, these investors have been aggressively purchasing junk bonds in an attempt to lock in high yields before the rate cuts hit. The rate cut expectations have, admittedly, been somewhat tempered so far this year as disappointing inflation data has revealed that it is premature to consider interest rate cuts. That has caused investment-grade bonds to decline year-to-date, but junk bonds have surprisingly held up pretty well.
As such, we might expect that the performance of the KKR Income Opportunities Fund has been solid since the date of our previous discussion. This is certainly the case, as shares of the fund have gone up by 10.26% since that date:
Seeking Alpha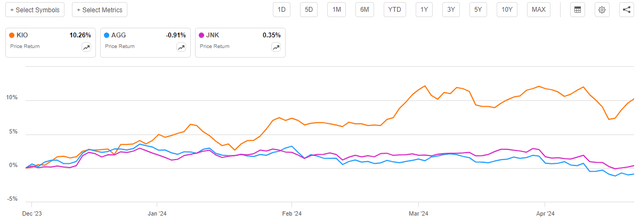
As we can easily see from the chart, the KKR Income Opportunities Fund has substantially outperformed both the Bloomberg U.S. Aggregate Bond Index (AGG) and the Bloomberg High Yield Very Liquid Index (JNK). This is shocking, and it could suggest that the fund may struggle to hold on to its recent gains. Indeed, the fund’s net asset value is only up 4.96% over the same period, so its shares have clearly outperformed the underlying portfolio:
Barchart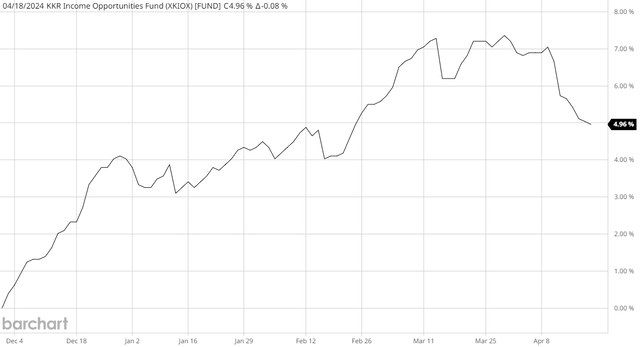
This may pose a risk to investors who purchase the fund at today’s price.
As I have pointed out numerous times in the past, a simple look at the price performance of a closed-end fund does not tell us how investors actually fared over a given period. This is because these funds typically pay out most or all of their investment profits to their investors via distributions. The basic business model is to keep the size of the portfolio relatively stable over time, while giving all the capital gains and income produced by the portfolio to the shareholders. This is the reason why many of these funds have among the highest yields in the market. The distribution also provides a return that is not reflected in the share price performance, so investors in a given fund will almost always do better than the share price performance alone would indicate.
As such, we should always take the distributions into account when evaluating the performance of a given fund. When we do that, we see that shareholders of the KKR Income Opportunities Fund have benefited from a 15.57% total return since the date of the previous article’s publication:
Seeking Alpha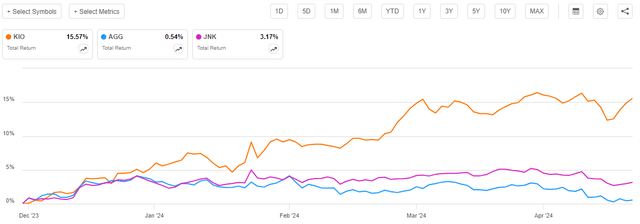
As was the case previously, the performance of this fund has substantially exceeded both of the relevant bond indices. This will almost certainly be attractive to any investor, including those whose primary objective is earning a high level of income from the assets in their portfolios.
It is always important to keep in mind, though, that past performance is no guarantee of future results. As such, we should take a look at this fund’s assets and finances today to determine whether it is a good purchase. The fund has released an updated financial report since our previous discussion in November, so that will be a useful resource in our analysis today. Let us proceed onward and see if the KKR Income Opportunities Fund is worthy of your investment money today.
About The Fund
According to the fund’s website, the KKR Income Opportunities Fund has the primary objective of providing its investors with a very high level of current income. The website provides a very interesting explanation of how the fund will achieve this objective:
KKR Income Opportunities Fund seeks to allocate across credit instruments to capitalize on changes in relative among corporate credit instruments and manage against macroeconomic risks.
The fund’s website then provides three bullet points to explain its objectives and strategies further:
KKR
This allows us to come to a pretty reasonable assumption of how this fund works. In short, the KKR Income Opportunities Fund invests in both leveraged loans and junk bonds, with its asset allocation depending on which security type is likely to provide the highest total return. This is necessary because leveraged loans and junk bonds offer very different return profiles. Leveraged loans are almost always floating-rate securities. This means that the amount that they pay investors goes up when short-term interest rates rise and goes down when interest rates fall. As such, these securities always offer a yield that is competitive with the market interest rate for a given level of default risk. The price of these securities therefore does not change significantly when interest rates change.
We can see this clearly by looking at the price of the iShares Floating Rate Bond ETF (FLOT), which has a share price that moves with the value of an index of five-year floating-rate notes:
Seeking Alpha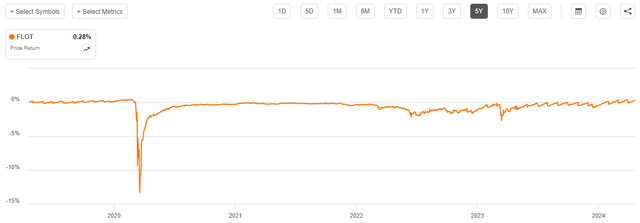
As we can see, the price of this index fund has not moved much over the past five years, even though interest rates exhibited some considerable swings over the same period. The only things that really affected it over the period were the outbreak of the COVID-19 pandemic and the collapse of Silicon Valley Bank. These were shocks that caused market actors to simply dump everything and go to cash, and were not related to interest rate movements.
Junk bonds, on the other hand, exhibit a similar inverse correlation to interest rates that investment-grade bonds do. Basically, when interest rates rise, the price of junk bonds falls and vice versa.
As such, during a period of rising interest rates, we want to hold floating-rate securities instead of junk bonds. This is because these securities will hold their price and the income that they provide will go up. When interest rates are falling, we want to be holding junk bonds because the rising price provides us with capital gains and the coupon payments do not go down with interest rates. The KKR Income Opportunities Fund is designed to switch between floating-rate leveraged loans and fixed-rate junk bonds to exploit this dynamic. Basically, this is a “one-stop fund” that debt investors can purchase to enjoy life instead of spending all of their time watching various economic indicators in an attempt to determine which direction interest rates are likely to move. This is a proposition that many retirees will find attractive, as will those who prefer to focus on their core competencies instead of following the Federal Reserve.
The fund’s annual report provides the following asset allocation:
|
Security Type |
% of Total Assets |
|
Leveraged Loans |
58.17% |
|
High-Yield Securities |
81.10% |
|
Asset-Backed Securities |
8.22% |
|
Common Equity |
2.28% |
|
Money Market Fund |
1.60% |
This is a very different asset allocation than we saw the last time that we discussed this fund. As readers may recall from the previous article, at the time, the fund was very slightly weighted towards fixed-rate junk bonds. In the previous article, I described its asset allocation thus:
As we can see, 41.5% of the fund’s assets are invested in leveraged loans. In addition, we see a 5.9% allocation to collateralized loan obligations. Both leveraged loans and collateralized loan obligations are usually floating-rate assets. As such, it appears that 47.4% of the fund’s assets are invested in floating-rate securities.
The asset-backed securities shown in the chart above appear to be floating-rate securities. The annual report lists these securities:
Fund Annual Report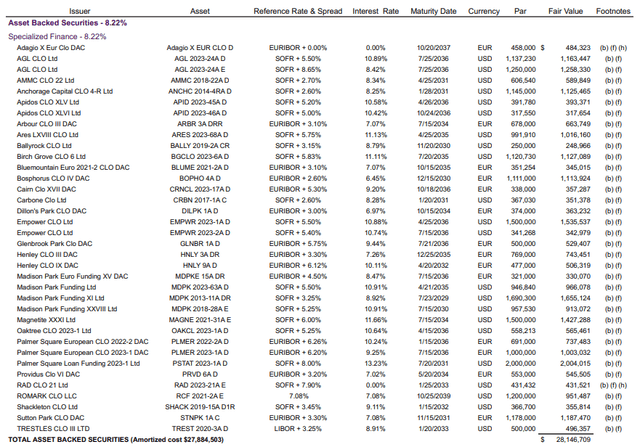
As we can see, all except for one of these securities had a reference interest rate that is EURIBOR+XXX or SOFR+XXX. The presence of a spread like this as a reference interest rate means that these are floating-rate securities.
If we combine the 58.17% allocation to leveraged loans with the 8.22% invested in asset-backed securities, we get 66.39% of assets invested in floating-rate securities (excluding the money market cash). This compares to 81.10% invested in fixed-rate junk bonds. That means that junk bonds are 53.58% of the portfolio’s assets after we adjust for leverage (as the chart shown in the previous article did). Thus, the fund’s allocation to fixed-rate bonds increased relative to floating-rate securities from the end of September until the publication date of the most recent financial report. That is only a one-month period, as the chart provided in the previous article was dated September 30, 2023, and the annual report was dated October 31, 2023.
The fund does not provide an asset allocation on its website that is newer than September 30, 2023. The fact sheet also provides the September 30, 2023, holding information. This is very disappointing, as the website would be the usual source that investors would consult for the most up-to-date information. In this case, the information provided by the website is actually older than what is provided in the annual report. This implies a certain lack of transparency for the fund’s managers, which is certainly not what we like to see with any fund that we are considering investing our money into.
Fortunately, a bit of digging does provide some more up-to-date information. The fund has already filed its first quarter 2024 holdings report, which provides the fund’s holdings as of January 31, 2024. Here is its asset allocation as of that date:
|
Security Type |
% of Total Assets |
|
Leveraged Loans |
56.62% |
|
High Yield Securities |
84.03% |
|
Asset-Backed Securities |
8.63% |
|
Common Equity |
1.82% |
|
Money Market Fund |
4.61% |
This document does not provide any information about the fund’s returns or financial performance. All it tells us is what securities the fund had as of the end of January. This is enough, though, as it clearly shows us that the fund’s allocation to fixed-rate junk bonds increased relative to floating-rate securities over the November 2023 to January 2024 period. This is not surprising, as junk bonds did significantly outperform floating-rate securities over that period. However, it may not be for the best, as there were signs back in December 2023 that fixed-rate bonds were becoming overpriced. As regular readers of my articles know, the thesis that the Federal Reserve would cut interest rates six times in 2024 was always something of a pipe dream.
It, therefore, would have made sense for the fund to actually be taking profits on its junk bond holdings over the three-month period between the first-quarter 2024 holdings report and the annual report. Junk bonds have significantly underperformed junk bonds year-to-date:
Seeking Alpha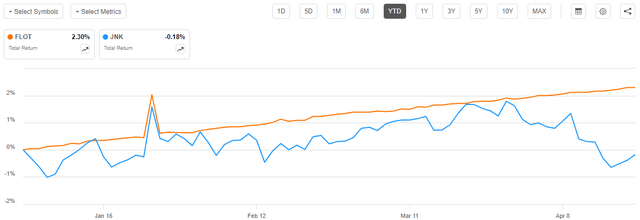
Thus, the fund’s profits could have increased had its managers realized that the market was far too optimistic about interest rates in December 2023 and January 2024. The fund has a 58.00% annual turnover, which does suggest that its management is trying to take advantage of things like this. Of course, the report shows the fund’s holdings on January 31, 2024, so it may have moved some of its junk bond profits into floating-rate securities during February or March. Junk bonds in general were doing reasonably well until early April when the market started to wake up to the very real probability that interest rates would not be cut in the near future, so if the fund had made its move before April 1, 2024, then it still could have delivered a performance that investors should be pleased with. We will probably have to wait another few months to see how successful the fund was at exploiting this opportunity.
Leverage
As is often the case with closed-end funds, the KKR Income Opportunities Fund employs leverage as a method of boosting the effective yield that it earns from the assets in its portfolio. I explained how this works in my previous article on this fund:
In short, the fund is borrowing money and using that borrowed money to purchase floating-rate loans and other fixed-income assets. As long as the purchased assets have a higher yield than the interest rate that the fund has to pay on the borrowed money, the strategy works pretty well to boost the effective yield of the portfolio. As this fund is capable of borrowing money at institutional rates, which are considerably lower than retail rates, that will usually be the case.
However, the use of debt in this fashion is a double-edged sword. This is because leverage boosts both gains and losses. As such, we want to ensure that the fund is not employing too much leverage, as that would expose us to too much risk. I generally do not like to see a fund’s leverage exceed a third as a percentage of its assets for this reason.
As of the time of writing, the KKR Income Opportunities Fund has leveraged assets comprising 37.44% of its assets. This is clearly above the one-third maximum that we would ordinarily prefer for a closed-end fund. However, as I have pointed out before, fixed-income funds can usually carry a higher level of leverage than equity funds. This is because the assets that are held by these funds tend to be much more stable than common equities. It is volatility that causes problems for leveraged investment strategies, so if the assets do not fluctuate much in price, the fund can carry a higher level of leverage. Here is how this fund compares to its peers in this respect:
|
Fund Name |
Leverage Ratio |
|
KKR Income Opportunities Fund |
37.44% |
|
Allspring Income Opportunities Fund |
30.30% |
|
Apollo Tactical Income Fund |
36.15% |
|
BlackRock Corporate High Yield Fund |
25.61% |
|
Neuberger Berman High Yield Strategies Fund |
30.10% |
|
Pioneer High Income Fund |
31.50% |
|
Western Asset High Income Opportunity Fund |
0.00% |
(all information from CEF Data.)
As we can see here, the KKR Income Opportunities Fund has a higher level of leverage than any of its peers. It is also considerably more leveraged than it was the last time that we discussed it, which means that the fund must have borrowed more money in an attempt to boost its yield. After all, its net asset value has increased since the date of that previous discussion, so it is certain that the leverage increase was not due to any shrinkage of the portfolio that occurred.
The only peer fund that is anywhere close to the KKR Income Opportunities Fund in terms of leverage is the Apollo Tactical Income Fund. That fund is currently heavily invested in floating-rate securities, which are remarkably stable regardless of interest rate movements. We discussed that earlier in this article. As such, the Apollo fund should have no trouble handling a high level of leverage. The KKR Income Opportunities Fund likewise has a significant asset allocation to floating-rate securities, so it should be less volatile than a pure junk bond fund, but its higher allocation to fixed-rate assets means that it will still exhibit more interest-rate sensitivity than the Apollo fund. As such, the fact that it has more leverage does mean that it will be a bit riskier than this peer.
Overall, the current leverage of the KKR Income Opportunities Fund is probably nothing that is worth losing sleep over. However, investors should still keep in mind that it could be punished if something bad happens in the junk bond market. An obvious example of such a shock would be a rate hike, as Fed Governor Michelle Bowman suggested as a possibility earlier this month. Investors who are highly risk-averse may want to keep this in mind.
Distribution Analysis
As mentioned earlier in this article, the primary objective of the KKR Income Opportunities Fund is to provide its investors with a very high level of current income. In pursuance of this objective, the fund invests its assets into a portfolio that primarily consists of fixed-rate and floating-rate speculative-grade debt. These securities deliver the bulk of their total returns to their owners in the form of direct payments. In this case, the fund receives these payments on behalf of its shareholders. It combines these payments with any capital gain profits that it manages to acquire via the sale of securities that go up in price before their maturity date.
The KKR Income Opportunities Fund then takes things a step further and borrows money to allow it to control more securities than its equity capital would allow. This has the effect of increasing the fund’s income by the difference between the coupon payments and the interest that it has to pay on the borrowed money. The fund then pays out all of this accumulated money to its shareholders, net of its expenses. When we consider the current yield on junk bonds and leveraged loans, we can expect that this strategy would allow the fund’s shares to boast a very high yield.
This is indeed the case, as the KKR Income Opportunities Fund pays a monthly distribution of $0.1215 per share ($1.458 per share annually). This gives the fund a 10.95% yield at the current price. As we saw in the introduction, this is not an especially attractive yield relative to its peers, but it does still beat the yield that is currently available from many other things in today’s market. The fund has generally been reasonably reliable with its distribution over its history:
CEF Connect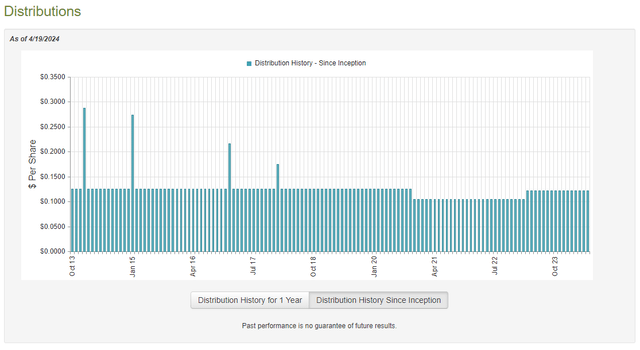
As I pointed out in my previous article on the fund, this is one of the few fixed-income funds that cut its payout following the interest rate cuts that accompanied the pandemic. After all, those cuts set off a massive bubble that had the effect of boosting the price of just about everything in the market. This included many fixed-income securities, which allowed those funds that were invested in these securities to offset the low yields with capital gains. The leveraged loan funds did have to cut their payouts due to the lack of capital gains and lower payouts from these securities, though. The KKR Income Opportunities Fund does invest partially in floating-rate securities, though, so this could explain the pandemic-era cut.
In any case, the fund’s history is not necessarily the most important thing for any investor who is considering purchasing this fund today. This is because today’s investor will receive the current distribution and the current yield. A buyer today will not be adversely affected by events that occurred in the past. As such, let us investigate how well the fund is sustaining its current payout.
As of the time of writing, the most recent financial report that is available for the KKR Income Opportunities Fund is the annual report that corresponds to the full-year period that ended on October 31, 2023. A link to this report was provided earlier in this article. This report, unfortunately, will not include any information about the fund’s performance over the past six months. This is very disappointing, as a great deal occurred during those six months. For example, the final two months of 2023 were characterized by rapidly easing financial conditions and rising junk bonds as various market participants began to expect a series of interest rate cuts in 2024. These investors tried to front-run the Federal Reserve by buying up securities that offered what they perceived to be high yields. However, these expectations began to moderate over the past month or two as inflation data suggests that rate cuts would be foolish.
The most recent financial report will not include any information about how well this fund managed these two environments. However, it will still provide us with some information about how well the fund performed over the summer of 2023, which also suffered from investor pessimism and falling fixed-income prices. This probably caused the fund to suffer some realized or unrealized losses from the junk bonds in its portfolio. It is also a newer report than the one that was available to us the last time that we discussed this fund, which is always nice.
For the full-year period that ended on October 31, 2023, the KKR Income Opportunities Fund received $49,229,918 in cash interest and $2,563,055 of “in-kind interest.” When we combine this with a small amount of money that was received from other sources, we see that the fund had a total investment income of $53,056,880 for the full-year period. It paid its expenses out of this amount, which left it with $37,300,992 available for shareholders. That was, fortunately, more than sufficient to cover the $34,903,980 that the fund paid out to its shareholders in distributions. We would normally prefer a debt closed-end fund to simply pay out its net investment income, so this is very nice to see.
The fund’s net assets increased by $88,761,249 after accounting for all inflows and outflows during the period. These inflows included $69,825,942 that the fund received from the sale of new shares. In the absence of this money, it still would have seen its net assets increase as it paid out less than its investment profits. Overall, we should not have to worry about the fund’s ability to sustain its current distribution unless some event causes its net investment income to decline. Unless the Federal Reserve cuts interest rates significantly (which is unlikely in the near term), it should be able to sustain its net investment income. As such, there does not appear to be much to worry about here.
Valuation
As of April 18, 2024 (the most recent date for which data is currently available), the KKR Income Opportunities Fund has a net asset value of $13.55 per share, but the shares trade at $13.32 each. This gives the fund’s shares a meager 1.70% discount to net asset value at the current price. This is a much smaller discount than the 2.31% discount that the fund’s shares have had on average over the past month.
Potential investors may be able to realize a better entry price by waiting for a bit. For the most part, though, the current price is probably acceptable if you wish to add it to your portfolio.
Conclusion
In conclusion, the KKR Income Opportunities Fund is an income-focused closed-end fund that invests in both fixed-rate and floating-rate debt securities with the goal of providing its investors with a very high level of current income. The fund does reasonably well at that with its 10.95% current yield. Unfortunately, it appears that KKR Income Opportunities Fund is betting on interest rate cuts that may not be imminent. As such, some of its peers may be better positioned. The fund’s high level of leverage and recent share price outperformance compared to its portfolio are additional risks.
I am downgrading KKR Income Opportunities Fund to a “Hold” rating. The risks above make it a more dangerous buy than it was a few months ago.
Credit: Source link