
In this tutorial, we walk through an advanced end-to-end data science workflow where we combine traditional machine learning with the power of Gemini. We begin by preparing and modeling the diabetes dataset, then we dive into evaluation, feature importance, and partial dependence. Along the way, we bring in Gemini as our AI data scientist to explain results, answer exploratory questions, and highlight risks. By doing this, we build a predictive model while also enhancing our insights and decision-making through natural language interaction. Check out the FULL CODES here.
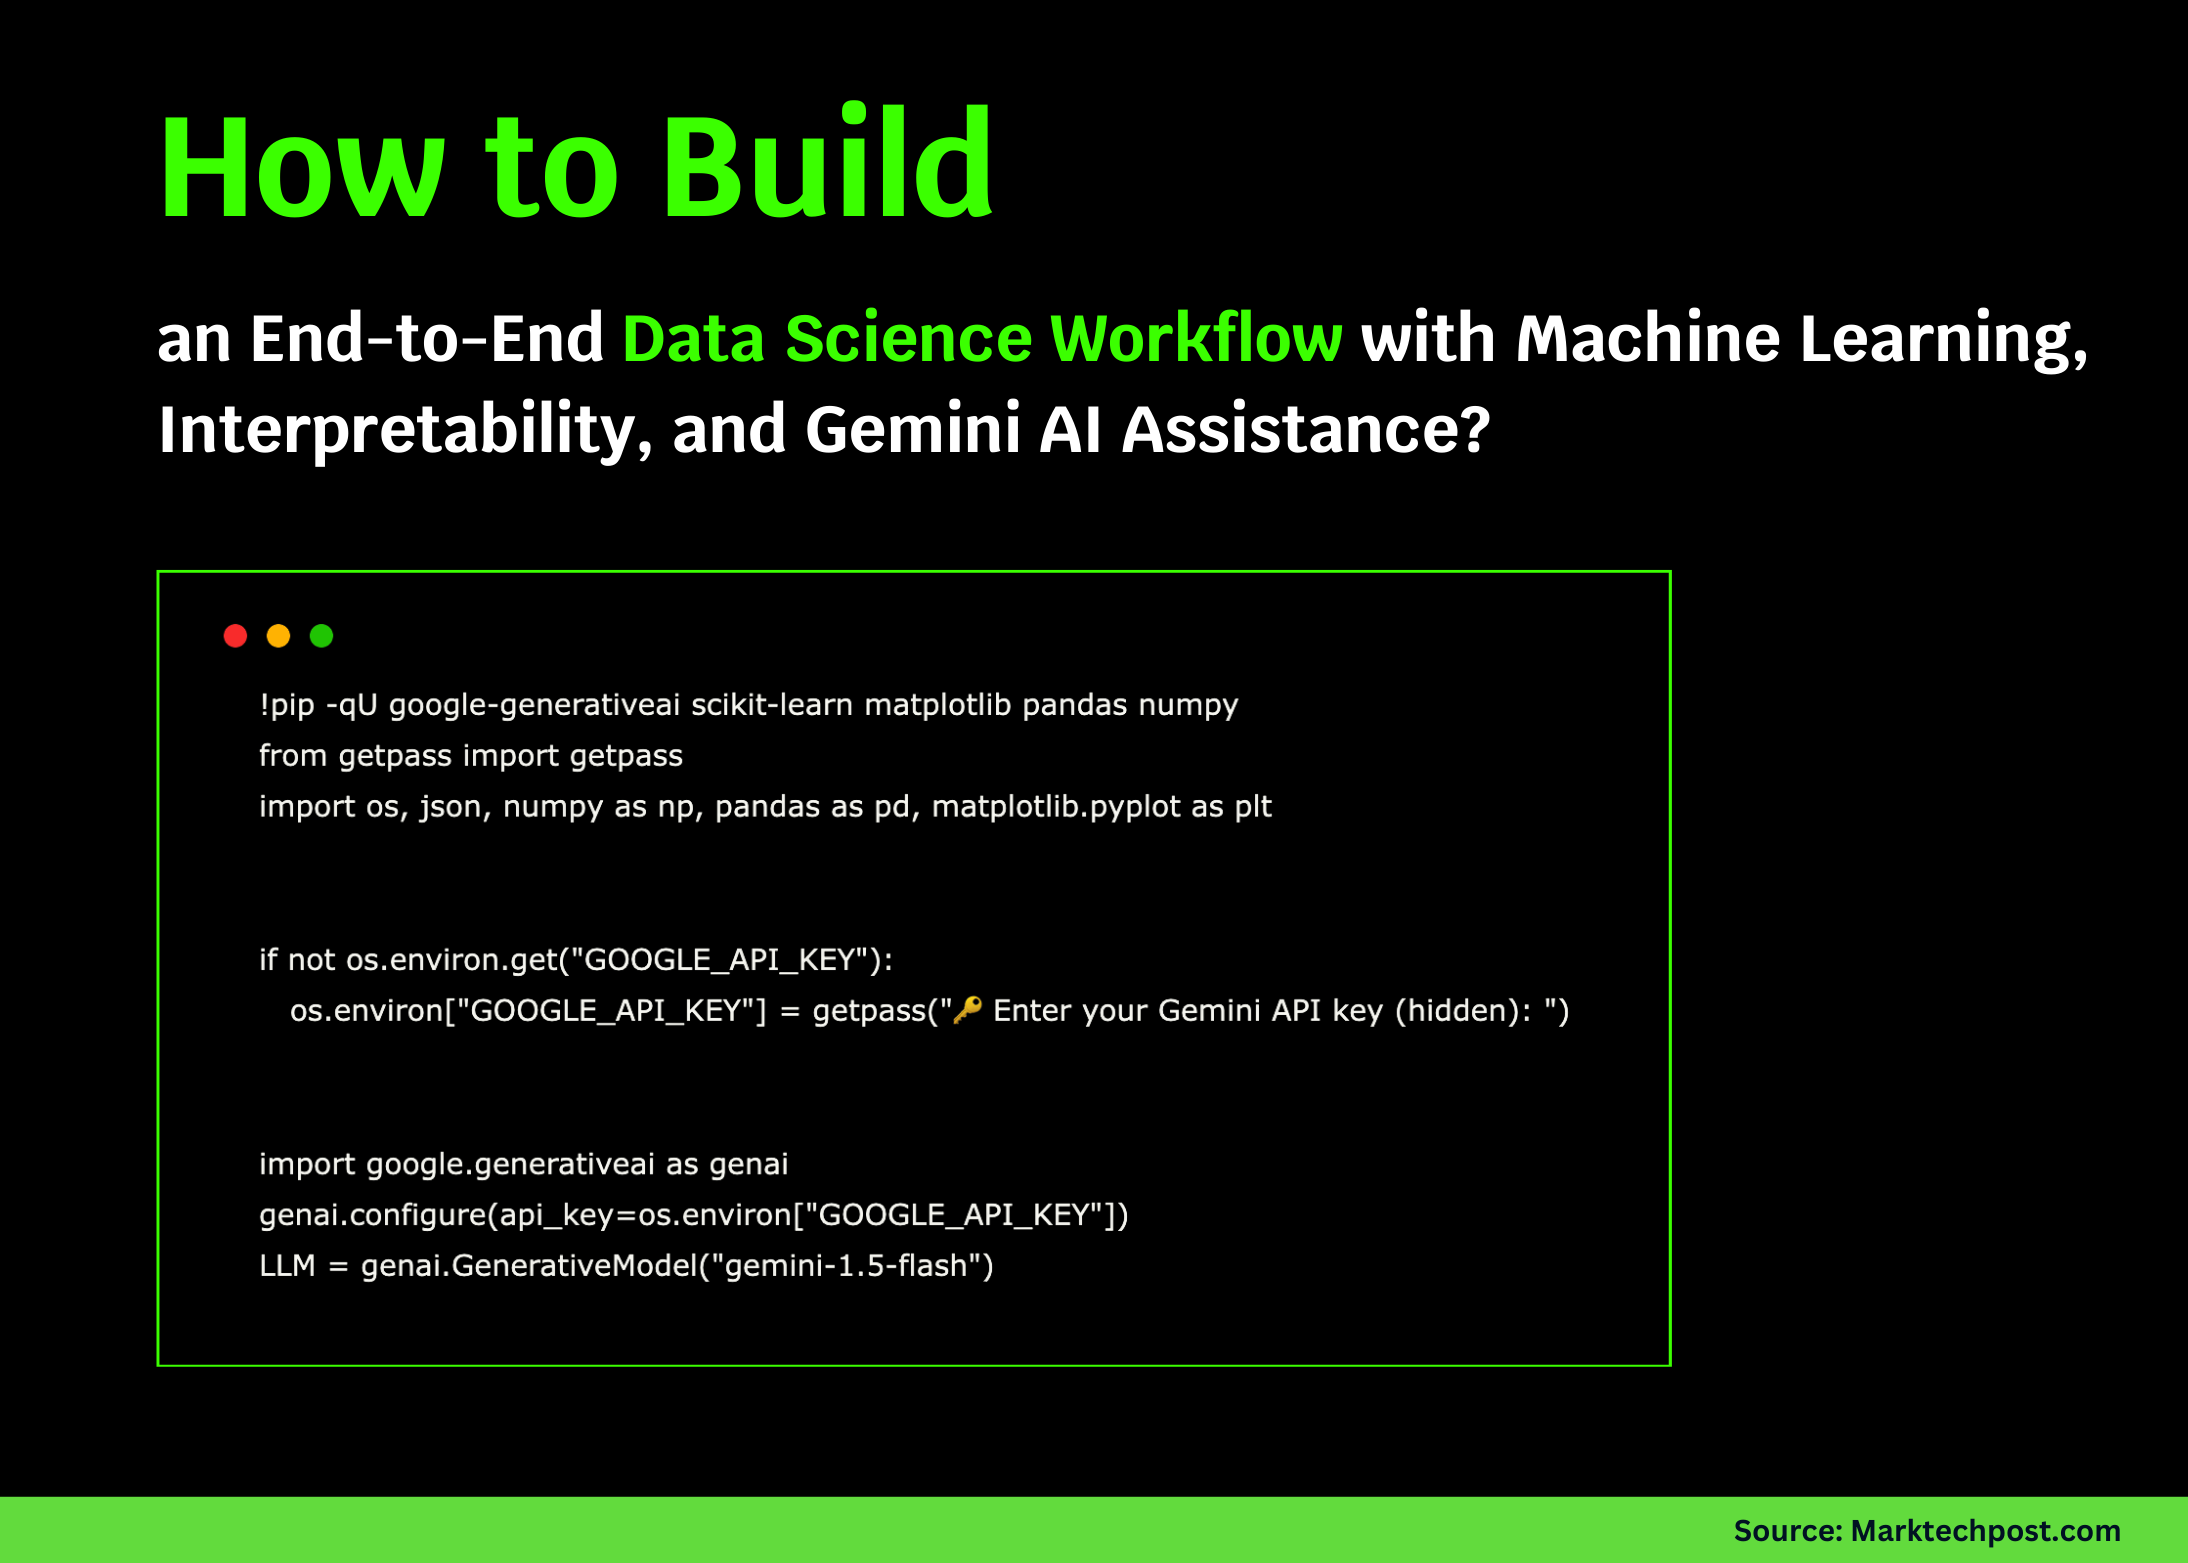
!pip -qU google-generativeai scikit-learn matplotlib pandas numpy
from getpass import getpass
import os, json, numpy as np, pandas as pd, matplotlib.pyplot as plt


if not os.environ.get("GOOGLE_API_KEY"):
   os.environ["GOOGLE_API_KEY"] = getpass("🔑 Enter your Gemini API key (hidden): ")


import google.generativeai as genai
genai.configure(api_key=os.environ["GOOGLE_API_KEY"])
LLM = genai.GenerativeModel("gemini-1.5-flash")


def ask_llm(prompt, sys=None):
   p = prompt if sys is None else f"System:\n{sys}\n\nUser:\n{prompt}"
   r = LLM.generate_content(p)
   return (getattr(r, "text", "") or "").strip()


from sklearn.datasets import load_diabetes
raw = load_diabetes(as_frame=True)
df  = raw.frame.rename(columns={"target":"disease_progression"})
print("Shape:", df.shape); display(df.head())


from sklearn.model_selection import train_test_split, KFold, cross_val_score
from sklearn.compose import ColumnTransformer
from sklearn.preprocessing import StandardScaler, QuantileTransformer
from sklearn.ensemble import HistGradientBoostingRegressor
from sklearn.pipeline import Pipeline


X = df.drop(columns=["disease_progression"]); y = df["disease_progression"]
num_cols = X.columns.tolist()
pre = ColumnTransformer(
   [("scale", StandardScaler(), num_cols),
    ("rank",  QuantileTransformer(n_quantiles=min(200, len(X)), output_distribution="normal"), num_cols)],
   remainder="drop", verbose_feature_names_out=False)
model = HistGradientBoostingRegressor(max_depth=3, learning_rate=0.07,
                                     l2_regularization=0.0, max_iter=500,
                                     early_stopping=True, validation_fraction=0.15)
pipe  = Pipeline([("prep", pre), ("hgbt", model)])


Xtr, Xte, ytr, yte = train_test_split(X, y, test_size=0.20, random_state=42)
cv = KFold(n_splits=5, shuffle=True, random_state=42)
cv_mse = -cross_val_score(pipe, Xtr, ytr, scoring="neg_mean_squared_error", cv=cv).mean()
cv_rmse = float(cv_mse ** 0.5)
pipe.fit(Xtr, ytr)
We load the diabetes dataset, preprocess the features, and build a robust pipeline using scaling, quantile transformation, and gradient boosting. We split the data, perform cross-validation to estimate RMSE, and then fit the final model to see how well it generalizes. Check out the FULL CODES here.
pred_tr = pipe.predict(Xtr); pred_te = pipe.predict(Xte)
rmse_tr = mean_squared_error(ytr, pred_tr) ** 0.5
rmse_te = mean_squared_error(yte, pred_te) ** 0.5
mae_te  = mean_absolute_error(yte, pred_te)
r2_te   = r2_score(yte, pred_te)
print(f"CV RMSE={cv_rmse:.2f} | Train RMSE={rmse_tr:.2f} | Test RMSE={rmse_te:.2f} | Test MAE={mae_te:.2f} | R²={r2_te:.3f}")


plt.figure(figsize=(5,4))
plt.scatter(pred_te, yte - pred_te, s=12)
plt.axhline(0, lw=1); plt.xlabel("Predicted"); plt.ylabel("Residual"); plt.title("Residuals (Test)")
plt.show()


from sklearn.inspection import permutation_importance
imp = permutation_importance(pipe, Xte, yte, scoring="neg_mean_squared_error", n_repeats=10, random_state=0)
imp_df = pd.DataFrame({"feature": X.columns, "importance": imp.importances_mean}).sort_values("importance", ascending=False)
display(imp_df.head(10))


plt.figure(figsize=(6,4))
top10 = imp_df.head(10).iloc[::-1]
plt.barh(top10["feature"], top10["importance"])
plt.title("Permutation Importance (Top 10)"); plt.xlabel("Δ(MSE)"); plt.tight_layout(); plt.show()
We evaluate our model by computing train, test, and cross-validation metrics, and visualize residuals to check prediction errors. We then calculate permutation importance to identify which features drive the model most, and display the top contributors using a clear bar plot. Check out the FULL CODES here.
def compute_pdp(pipe, Xref: pd.DataFrame, feat: str, grid=40):
   xs = np.linspace(np.percentile(Xref[feat], 5), np.percentile(Xref[feat], 95), grid)
   Xtmp = Xref.copy()
   ys = []
   for v in xs:
       Xtmp[feat] = v
       ys.append(pipe.predict(Xtmp).mean())
   return xs, np.array(ys)


top_feats = imp_df["feature"].head(3).tolist()
plt.figure(figsize=(6,4))
for f in top_feats:
   xs, ys = compute_pdp(pipe, Xte.copy(), f, grid=40)
   plt.plot(xs, ys, label=f)
plt.legend(); plt.xlabel("Feature value"); plt.ylabel("Predicted target"); plt.title("Manual PDP (Top 3)")
plt.tight_layout(); plt.show()


report_obj = {
   "dataset": {"rows": int(df.shape[0]), "cols": int(df.shape[1]-1), "target": "disease_progression"},
   "metrics": {"cv_rmse": float(cv_rmse), "train_rmse": float(rmse_tr),
               "test_rmse": float(rmse_te), "test_mae": float(mae_te), "r2": float(r2_te)},
   "top_importances": imp_df.head(10).to_dict(orient="records")
}
print(json.dumps(report_obj, indent=2))


sys_msg = ("You are a senior data scientist. Return: (1) ≤120-word executive summary, "
          "(2) key risks/assumptions bullets, (3) 5 prioritized next experiments w/ rationale, "
          "(4) quick-win feature engineering ideas as Python pseudocode.")
summary = ask_llm(f"Dataset + metrics + importances:\n{json.dumps(report_obj)}", sys=sys_msg)
print("\n📊 Gemini Executive Brief\n" + "-"*80 + f"\n{summary}\n")
We compute the manual partial dependence for the top three features and visualize how changing each one affects the predictions. We then assemble a compact JSON report of dataset statistics, metrics, and importances, and ask Gemini to generate an executive brief that includes risks, next experiments, and quick-win feature engineering ideas. Check out the FULL CODES here.
SAFE_GLOBALS = {"pd": pd, "np": np}
def run_generated_pandas(code: str, df_local: pd.DataFrame):
   banned = ["__", "import", "open(", "exec(", "eval(", "os.", "sys.", "pd.read", "to_csv", "to_pickle", "to_sql"]
   if any(b in code for b in banned): raise ValueError("Unsafe code rejected.")
   loc = {"df": df_local.copy()}
   exec(code, SAFE_GLOBALS, loc)
   return {k:v for k,v in loc.items() if k not in ("df",)}


def eda_qa(question: str):
   prompt = f"""You are a Python+Pandas analyst. DataFrame `df` columns:
{list(df.columns)}. Write a SHORT pandas snippet (no comments/prints) that computes the answer to:
"{question}". Use only pd/np/df; assign the final result to a variable named `answer`."""
   code = ask_llm(prompt, sys="Return only code. No prose.")
   try:
       out = run_generated_pandas(code, df)
       return code, out.get("answer", None)
   except Exception as e:
       return code, f"[Execution error: {e}]"


questions = [
   "What is the Pearson correlation between BMI and disease_progression?",
   "Show mean target by tertiles of BMI (low/med/high).",
   "Which single feature correlates most with the target (absolute value)?"
]
for q in questions:
   code, ans = eda_qa(q)
   print("\nQ:", q, "\nCode:\n", code, "\nAnswer:\n", ans)
We build a safe sandbox to execute pandas code that Gemini generates for exploratory data analysis. We then ask natural language questions about correlations and feature relationships, let Gemini write the pandas snippets, and automatically run them to get direct answers from the dataset. Check out the FULL CODES here.
crossitique = ask_llm(
   f"""Metrics: {report_obj['metrics']}
Top importances: {report_obj['top_importances']}
Identify risks around leakage, overfitting, calibration, OOD robustness, and fairness (even proxy-only).
Propose quick checks (concise Python sketches)."""
)
print("\n🧪 Gemini Risk & Robustness Review\n" + "-"*80 + f"\n{critique}\n")


def what_if(pipe, Xref: pd.DataFrame, feat: str, delta: float = 0.05):
   x0 = Xref.median(numeric_only=True).to_dict()
   x1, x2 = x0.copy(), x0.copy()
   if feat not in x1: return np.nan
   x2[feat] = x1[feat] + delta
   X1 = pd.DataFrame([x1], columns=X.columns)
   X2 = pd.DataFrame([x2], columns=X.columns)
   return float(pipe.predict(X2)[0] - pipe.predict(X1)[0])


for f in top_feats:
   print(f"Estimated Δtarget if {f} increases by +0.05 ≈ {what_if(pipe, Xte, f, 0.05):.2f}")


print("\n✅ Done: Train → Explain → Query with Gemini → Review risks → What-if analysis. "
     "Swap the dataset or tweak model params to extend this notebook.")
We ask Gemini to review our model for risks like leakage, overfitting, and fairness, and get quick Python checks as suggestions. We then run simple “what-if” analyses to see how small changes in top features affect predictions, helping us interpret the model’s behavior more clearly.
In conclusion, we see how seamlessly we can blend machine learning pipelines with Gemini’s reasoning to make data science more interactive and insightful. We train, evaluate, and interpret a model, then ask Gemini to summarize findings, suggest improvements, and critique risks. Through this journey, we establish a workflow that enables us to achieve both predictive performance and interpretability, while also benefiting from having an AI collaborator in our data analysis process.
Check out the FULL CODES here. Feel free to check out our GitHub Page for Tutorials, Codes and Notebooks. Also, feel free to follow us on Twitter and don’t forget to join our 100k+ ML SubReddit and Subscribe to our Newsletter.
Asif Razzaq is the CEO of Marktechpost Media Inc.. As a visionary entrepreneur and engineer, Asif is committed to harnessing the potential of Artificial Intelligence for social good. His most recent endeavor is the launch of an Artificial Intelligence Media Platform, Marktechpost, which stands out for its in-depth coverage of machine learning and deep learning news that is both technically sound and easily understandable by a wide audience. The platform boasts of over 2 million monthly views, illustrating its popularity among audiences.
Credit: Source link