

William_Potter/iStock via Getty Images
Investment Thesis
My investment strategy aims to combine a relatively high Dividend Yield with Dividend Growth, while prioritizing achieving an attractive Total Return. This dividend income-oriented investment strategy helps you to generate extra income in the form of dividends, aiming to increase this amount annually while prioritizing an attractive Total Return on your investment.
In today’s article, I will show you how you could implement this investment strategy by allocating $15,000 among two dividend-paying exchange-traded funds (“ETFs”) and 10 dividend growth companies that I believe are currently attractive. With this portfolio, you achieve a Weighted Average Dividend Yield [TTM] of 3.11% while the selected picks have shown a Weighted Average Dividend Growth Rate [CAGR] of 13.36% over the past 5 years.
The following are my top 10 dividend growth companies that I have selected for July 2023:
- Apple (AAPL)
- Bank of America (BAC)
- BlackRock (BLK)
- Broadcom (AVGO)
- Mastercard (MA)
- Microsoft (MSFT)
- Steel Dynamics (STLD)
- Tencent (OTCPK:TCEHY)
- The Goldman Sachs Group (GS)
- Visa (V)
Overview of the 2 ETFs and the 10 selected dividend growth companies for July 2023
|
Company Name |
Sector |
Industry |
Country |
Dividend Yield [TTM] |
Dividend Growth 5Y |
P/E [FWD] Ratio |
Return on Equity |
Allocation |
Amount in $ |
|
Apple |
Information Technology |
Technology Hardware, Storage and Peripherals |
United States |
0.49% |
7.26% |
31.8 |
145.61% |
5% |
750 |
|
Bank of America |
Financials |
Diversified Banks |
United States |
3.00% |
12.89% |
8.74 |
10.47% |
3% |
450 |
|
BlackRock |
Financials |
Asset Management and Custody Banks |
United States |
2.72% |
12.93% |
20.78 |
12.32% |
5% |
750 |
|
Broadcom |
Information Technology |
Semiconductors |
United States |
2.01% |
23.34% |
21.14 |
63.67% |
3% |
450 |
|
Mastercard |
Financials |
Transaction & Payment Processing Services |
United States |
0.55% |
17.80% |
32.88 |
154.10% |
4% |
600 |
|
Microsoft |
Information Technology |
Systems Software |
United States |
0.79% |
10.02% |
34.97 |
38.60% |
4% |
600 |
|
Steel Dynamics |
Materials |
Steel |
United States |
1.43% |
17.44% |
6.67 |
44.70% |
2% |
300 |
|
Tencent Holdings |
Communication Services |
Interactive Media and Services |
China |
4.35% |
77.05% |
18.28 |
22.69% |
2% |
300 |
|
The Goldman Sachs Group |
Financials |
Investment Banking and Brokerage |
United States |
3.06% |
26.81% |
11.79 |
9.01% |
3% |
450 |
|
Visa |
Financials |
Transaction & Payment Processing Services |
United States |
0.71% |
17.20% |
28.17 |
42.35% |
4% |
600 |
|
Schwab U.S. Dividend Equity ETF |
ETFs |
ETFs |
United States |
3.55% |
13.92% |
35% |
5250 |
||
|
iShares Core High Dividend ETF |
ETFs |
ETFs |
United States |
4.22% |
6.32% |
30% |
4500 |
||
|
3.11% |
13.36% |
100.00% |
15000 |
Source: The Author.
Portfolio Allocation per Company/ETF
The Schwab U.S. Dividend Equity ETF (SCHD) and the iShares Core High Dividend ETF (HDV) account for the largest part of the investment portfolio I am presenting in this article (representing 65%): while the Schwab U.S. Dividend Equity ETF makes up 35% of the overall portfolio, the iShares Core High Dividend ETF accounts for 30%.
Providing the two ETFs with the highest percentage of the overall portfolio offers you several benefits as an investor.
First, you achieve a broad diversification over sectors and industries, which helps you to reduce the risk level of your investment portfolio.
Second, both ETFs help you to raise the Weighted Average Dividend Yield [TTM] of your portfolio. This means that you achieve an attractive Dividend Yield even though all of the selected individual companies are dividend growth companies (and not high dividend yield companies). This also implies that this allocation helps you to earn an attractive additional income via Dividend payments from today.
Third, they contribute to achieving a relatively high Weighted Average Dividend Growth Rate [CAGR] of 13.36% (over the past 5 years). This means that this portfolio should be able to provide you with significant Dividend Growth in the upcoming years.
The companies listed below hold the highest percentage of the overall portfolio:
- Apple (5%)
- BlackRock (5%)
- Mastercard (4%)
- Microsoft (4%)
- Visa (4%)
The reason for having provided Apple, BlackRock, Mastercard, Microsoft and Visa with the highest percentage of the overall investment portfolio is because I believe they come attached with relatively low risk factors while offering investors the potential of obtaining an attractive expected compound annual rate of return. I believe that all of these companies are attractive in terms of risk and reward.
The following two companies have the smallest proportion on the overall investment portfolio:
- Steel Dynamics (2%)
- Tencent (2%).
The reason for providing these two companies with the smallest proportion in relation to the overall investment portfolio is because I believe that the risk factors that come attached to an investment are higher, meaning that predictions about the Total Return that you could achieve with these companies tend to be less accurate. For Tencent, for example, currency risk and macroeconomic risk factors can be named as additional risks to consider when investing in the company.
By giving them a lower percentage, a possible decline of one of these selected stocks would have a less negative impact on the Total Return of your investment portfolio. Therefore, we achieve a lower risk level for the overall investment portfolio.
Illustration of the Portfolio Allocation per Company/ETF
The graphic below demonstrates the portfolio allocation per company/ETF. As you can see in this graphic, no individual company has a proportion of more than 5% of the overall investment portfolio (only the two selected ETFs have a higher proportion).
In addition to that, it can be stated that only those companies that come along with relatively low risk factors (meaning that the probability of achieving attractive investment results in the form of the Total Return is higher than for companies with high risk factors) have a proportion of 4% (Microsoft, Visa and Mastercard) or 5% (Apple and BlackRock).
All other companies have a proportion of 3% (Bank of America, Broadcom and Goldman Sachs) or 2% (Tencent and Steel Dynamics) of the overall investment portfolio.
Source: The Author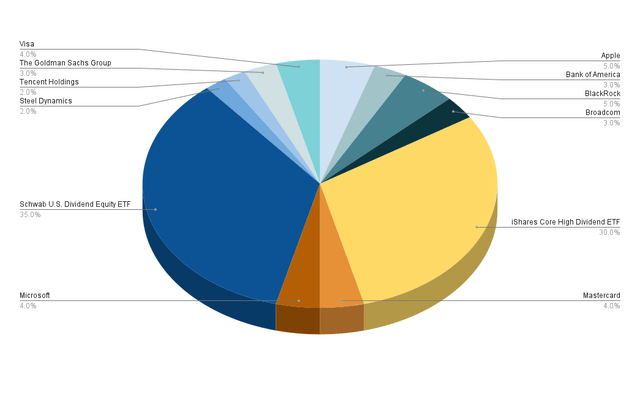
The fact that no company has a proportion of more than 5% of the overall investment portfolio and those companies which I consider to come attached with the highest risk factors (Tencent and Steel Dynamics) have a proportion of only 2%, strengthens my belief that this investment portfolio provides you with a reduced risk level and can therefore help you to achieve attractive investment results over the long term with a relatively high probability.
Portfolio Allocation per Sector
At 65%, the ETF Sector is the most represented sector in this investment portfolio (the Schwab U.S. Dividend Equity ETF accounts for 35% and the iShares Core High Dividend ETF makes up 30%).
In second place is the Financials Sector with 19%. To the Financials Sector belongs BlackRock (5%), Visa (4%), Mastercard (4%), Bank of America (3%) and The Goldman Sachs Group (3%).
The Information Technology Sector represents 12% of the overall investment portfolio. Making up this Sector are Apple (5%), Microsoft (4%) and Broadcom (3%).
The Communication Services Sector (with Tencent representing 2%) and the Materials Sector (with Steel Dynamics representing 2%) account for 2% each of the overall investment portfolio.
It can be highlighted that, excluding the ETF Sector, no Sector makes ups more than 20% of the overall investment portfolio, which indicates that it offers a broad diversification over sectors and therefore provides you with a reduced risk level.
Illustration of the Portfolio Allocation per Sector when allocating SCHD and HDV to the ETF Sector
Below you can find a graphic of the portfolio allocation per Sector when allocating SCHD and HDV to the ETF Sector.
Source: The Author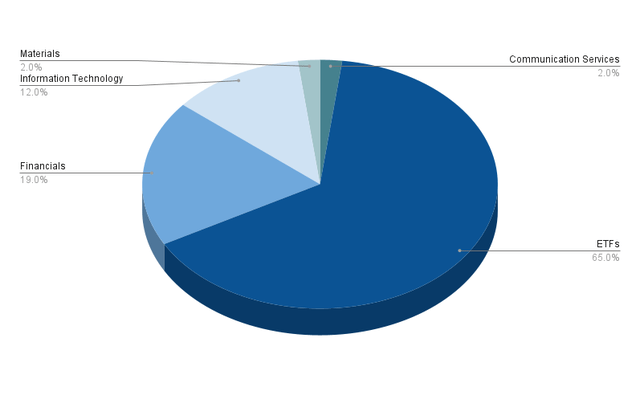
Below is an overview of the Sectors and their corresponding companies/ETFs.
ETFs (65%)
- Schwab U.S. Dividend Equity ETF (35%)
- iShares Core High Dividend ETF (30%).
Financials (19%)
- Bank of America (3%)
- BlackRock (5%)
- Mastercard (4%)
- The Goldman Sachs Group (3%)
- Visa (4%).
Information Technology (12%)
- Apple (5%)
- Broadcom (3%)
- Microsoft (4%).
Communication Services (2%)
Materials (2%)
Portfolio Allocation per Industry
Excluding the ETF Industry, the Transaction & Payment Processing Services Industry (with Mastercard and Visa each representing 4%) has the highest percentage of the overall investment portfolio (8%). This is followed by the Asset Management and Custody Banks Industry (with BlackRock representing 5%) and the Technology Hardware, Storage and Peripherals Industry (with Apple accounting for 5%).
The Systems Software Industry has a proportion of 4% of the overall portfolio (this industry is represented by Microsoft). All other industries have a proportion of 3% or less of the overall investment portfolio.
Since no industry has a proportion of more than 8% of the overall investment portfolio, and most have a proportion of 5% or less, it can be stated that this portfolio reaches a broad diversification over industries. Through this diversification, we reach a reduced portfolio risk level and a higher probability of achieving attractive investment results over the long term.
Illustration of the Portfolio Allocation per Industry when allocating SCHD and HDV to the ETF Industry
Source: The Author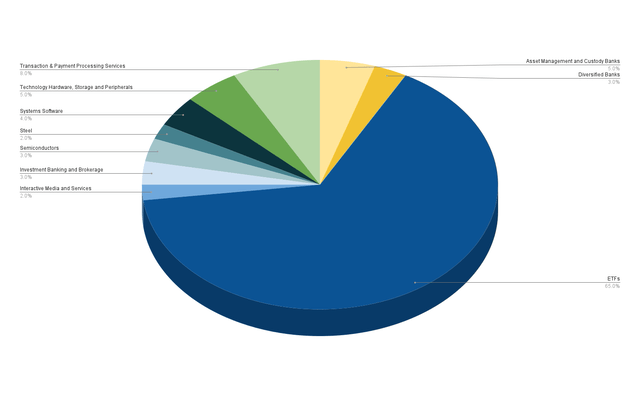
Portfolio Allocation per Country
Most of the companies and ETFs that are part of this investment portfolio are from the United States. The U.S. based companies account for 98% of the overall investment portfolio.
Only 2% of the companies are from outside of the country (which is China, represented by Tencent).
From my point of view as an investment analyst and investor, it is more important to focus on the competitive advantages and the financial health and financial results of the companies you plan to invest in rather than trying to achieve a broad geographical diversification. Even though I admit that in the short term macroeconomic risk factors can influence the stock prices, in the long term, the stock prices will follow the financial results of the companies (making it less significant which country they are from).
Illustration of the Portfolio Allocation per Country
Source: The Author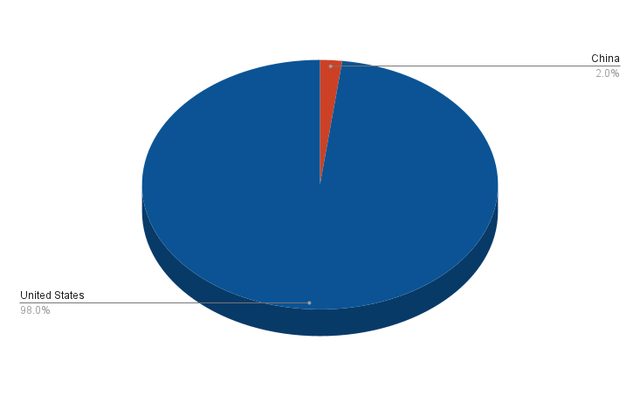
How to achieve an even Broader Diversification
If you would like to achieve an even broader diversification than this investment portfolio offers, you might consider investing in an additional ETF: you could take a closer look at the iShares Core Dividend Growth ETF (DGRO), since it provides you with a relatively attractive Dividend Yield [TTM] of 3.37% and a Dividend Growth Rate [CAGR] of 10.32% over the past 5 years.
In case you ask yourself if it makes sense to only invest in SCHD, I would like to highlight some advantages of picking stocks individually over only investing in ETFs:
- It provides your portfolio with more individuality and flexibility
- You can protect your investment portfolio against the next stock market crash by adding companies with a low Beta Factor
- You can overweight industries with which you are more familiar and you can avoid others you don’t want to invest in
- You can select stocks which you think are able to beat the market or you can select ones to raise the Weighted Average Dividend Yield or Weighted Dividend Growth Rate of your investment portfolio
- You can also achieve an even broader geographical diversification of your portfolio
In my article, 10 Dividend Stocks To Show The Advantages Of Investing In Individual Stocks Over ETFs, I discuss the advantages of the selection of stocks over ETFs in greater detail.
Conclusion
The main goal of today’s article was to show you how you could allocate the amount of $15,000 among 2 ETFs and my top 10 dividend growth companies that I have selected for the month of July.
Due to the portfolio allocation, we have not only achieved a broad diversification over sectors and industries, but also a reduced risk level for your investment portfolio, helping you to achieve attractive investment results over the long term with a higher probability.
At the same time, this investment portfolio provides you with a relatively attractive Weighted Average Dividend Yield [TTM] of 3.11%. This Dividend Yield is particularly appealing for investors when considering that the 10 selected picks are dividend growth companies. The Weighted Average Dividend Yield was achieved by allocating 65% of the overall investment portfolio to two selected ETFs: Schwab U.S. Dividend Equity ETF with 35% and iShares Core High Dividend ETF with 30%.
In addition to that, the selected picks have shown a Weighted Average Dividend Growth Rate [CAGR] of 13.36% over the past 5 years.
For all these reasons, I think this investment portfolio can help you to implement successfully my dividend income-oriented investment strategy that combines a relatively high Dividend Yield with Dividend Growth, while prioritizing Total Return, helping you to earn extra income via Dividend payments while steadily increasing your wealth.
Author’s Note: Thank you very much for reading and I would appreciate hearing your opinion on this investment portfolio and its allocation! Do you own or plan to acquire one of the selected picks? Which are currently your favorite dividend growth companies?
Editor’s Note: This article discusses one or more securities that do not trade on a major U.S. exchange. Please be aware of the risks associated with these stocks.
Credit: Source link