

owngarden
By most measures, China’s post-COVID recovery is off to a flying start. For starters, growth in Q1 not only came in stronger than expected at +4.5% YoY but the drivers were also relatively broad-based. As a result, China now appears poised to outpace growth expectations this year (recall the government had set a conservative ~5% target), led by a further snapback in consumption (helped by a low base due to the COVID impact) and outbound travel, which continues to lag pre-COVID levels. Elsewhere, the troubled property market also seems to be turning a corner, helped by continued policy easing (recall the pro-growth and supportive fiscal policy stance at last month’s Politburo meeting) and accommodative monetary policy by the PBoC. So even with manufacturing and infrastructure lagging amid a weaker external backdrop, the Chinese recovery story still has ample runway from here.
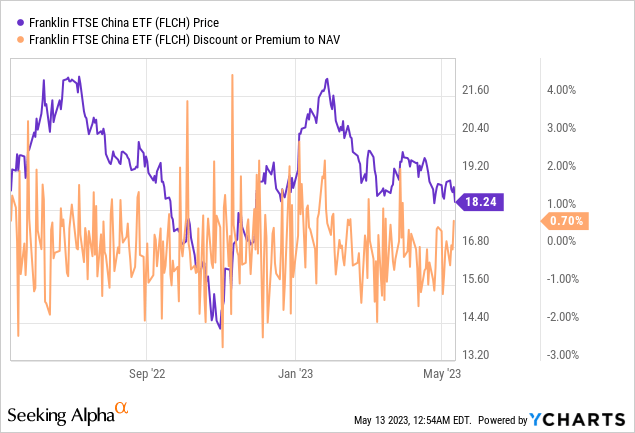
Valuations indicate the Chinese rebound is far from a consensus trade as well – the P/E multiples of the MSCI China and CSI300 indices remain close to multi-year lows on the heels of worsening sentiment post-Lunar New Year. Expect increasing visibility into a sustained recovery and more supportive policy measures to support the next leg higher for Chinese equities. In line with my previous coverage, beaten-down tech/consumer-focused Chinese funds like the Franklin FTSE China ETF (NYSEARCA:FLCH) remain compelling low-cost vehicles to ride the recovery.
Fund Overview – Ultra Low-Cost Vehicle Focused on Chinese Consumer/Tech
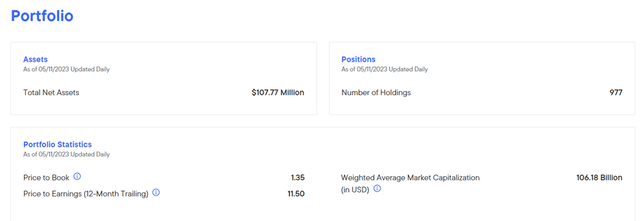
The NYSE-listed Franklin FTSE China ETF tracks the performance (before expenses) of the free float-adjusted, market cap-weighted FTSE China Capped Index, which comprises Chinese large and mid-cap equities. Constituents are capped at <20% of the index’s weight quarterly, while the total weightage of all constituents contributing >4.5% of the index is capped at 48% of the cumulative index weight. The ETF held $108m of net assets at the time of writing (down from ~$119m pre-Q1) and charged a 0.19% expense ratio, making it one of the most cost-effective options within the Chinese ETF universe. Key data on the ETF is as per the graphic below:

Franklin Templeton
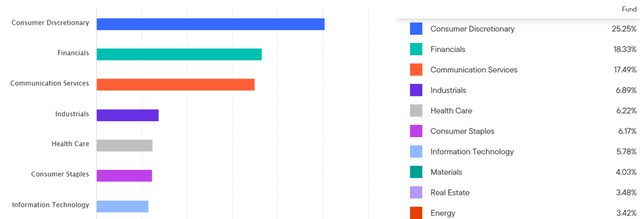
As reflected in the chart below, the fund’s sector allocation remains skewed toward the consumer discretionary sector at 25.3%, though the post-Lunar New Year underperformance has led to a decline in weightage from the prior ~29%. Similarly, communication services have also seen a % reduction and now contribute 17.5% of the portfolio (down from ~19% prior). In contrast, the financials sector has been upsized to 18.3% (up from ~16% prior) and has now replaced communication services as the second largest sector allocation. Additional sectors making up >5% of the portfolio include industrials (6.9%), health care (6.2%), consumer staples (6.2%), and information technology (5.8%). With the top-five sectors accounting for a combined ~74% of the total portfolio, FLCH remains a top-heavy fund from a sector perspective.
Franklin Templeton
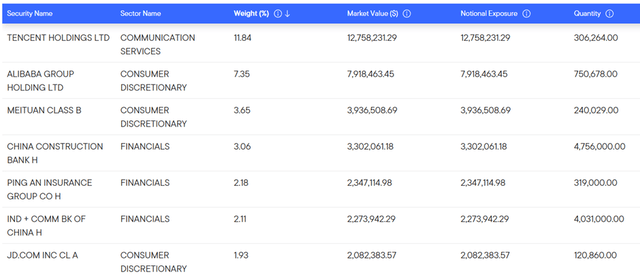
The ETF’s single-stock holdings remain largely consistent with prior reporting periods. Chinese tech and entertainment giant Tencent Holdings (OTCPK:TCEHY) is still the largest portfolio holding at 11.8% (albeit down from ~13% prior), along with Chinese e-commerce leader Alibaba Group (BABA) at 7.4% (down from ~9% prior) and Chinese shopping platform Meituan (OTCPK:MPNGF) at 3.7% (down from ~4% prior). The most notable change is e-commerce giant JD.com (JD), which has declined to 1.9% (from 2.9% prior), with the outperformance of banking and insurance driving a higher weightage for China Construction Bank (OTCPK:CICHY), Ping An Insurance (OTCPK:PNGAY), and Industrial and Commercial Bank of China (OTCPK:IDCBY).
Franklin Templeton
The number of portfolio holdings has risen to 977 as well, so while the top ten holdings account for a sizeable % of the overall portfolio, FLCH is still one of the more diversified tech/consumer-focused Chinese ETFs in the market. Another plus is that the ETF’s investable universe spans domestic and Hong Kong-listed Chinese shares as well (i.e., A and H-shares), limiting the regulatory risks associated with holding depositary receipts.
Fund Performance – Track Record Weighed Down by Years of Policy-Driven Drawdowns
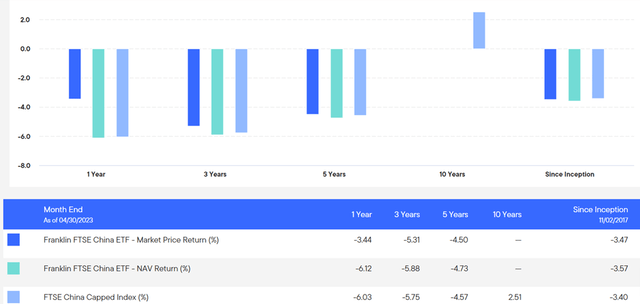
Having started the year strongly, FLCH is now down 5.4% YTD, selling off alongside the rest of the Chinese equities universe post-Lunar New Year. This means that since the fund’s inception in 2007, performance has been negative on a cumulative basis at -17.6% in NAV terms (-18.1% in market price terms). On an annualized basis, performance has been far from impressive across all timelines – FLCH is down -5.9% and -4.7% in NAV terms (-5.3% and 4.5% in market price terms) on a three and five-year basis, respectively. Relative to comparable funds such as the Invesco Golden Dragon China ETF (PGJ), however, the fund performance has been good, particularly given the industry-low expense ratio.
Franklin Templeton
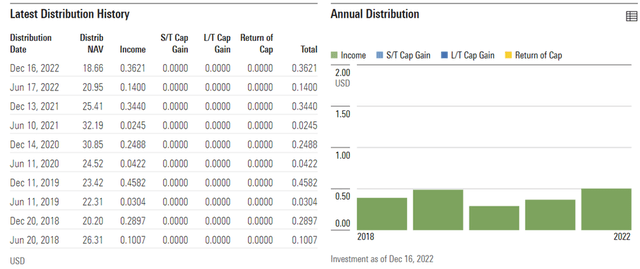
The semi-annual distributions have been surprisingly strong in recent years – last year’s ~$0.50/share payout, for instance, implies a ~2.7% trailing yield. Of note, this payout comes entirely from recurring income and has remained steady through the cycles despite the fund’s outsized exposure to high-beta tech and consumer names. As FLCH’s largest holdings typically reinvest excess cash (vs. paying out as dividends), however, financial-focused ETFs like the Global X China Financials ETF (CHIX) screen as a better option for investors who prioritize income. On the other hand, the fund distribution is a nice bonus for growth-focused investors looking to ride the Chinese post-COVID recovery story.
Morningstar
Conclusion
The early results of China’s growth reconfiguration have been resoundingly positive – Q1 growth, for instance, was far stronger than expected at +4.5% YoY and puts the country on track to outpace the +5% target by a fair margin. The first inning of the post-COVID rebound has been, as expected, led by the unleashing of ‘pent-up’ consumption and excess savings following the ‘zero-COVID restrictions. While there remains ample room for consumption growth to further accelerate, particularly with outbound travel still lagging pre-COVID levels, the second inning of the recovery will likely depend on policy impetus. Thus far, Beijing has delivered. Starting with the property sector (improved mortgage rates and funding support for developers), the government has delivered much-needed policy easing where needed. From here, policy tailwinds should further broaden throughout the economy – recent meetings highlighted a pro-growth policy stance, and thus, more accommodative fiscal and monetary policies are likely in the pipeline this year.
While I do acknowledge some offset from weakness in manufacturing and export-oriented areas exposed to an uncertain global demand backdrop, valuations appear to have priced in the bear case here. Benchmark indices like the MSCI China and CSI300 are down to multi-year lows following a downturn in investor sentiment post-Lunar New Year; the FLCH portfolio, which tracks the FTSE China Capped Index, also trades well below historical levels at ~12x trailing P/E despite growing evidence of a fundamental Chinese recovery. With China equities on track to benefit from higher earnings and a strong RMB this year, the ultra-low-cost, consumer/tech-focused FLCH fund remains a compelling option to allocate capital.
Franklin Templeton
Credit: Source link