
Background
I am a retired engineer. I have a diversified portfolio composed of 49% equity funds, 30% individual stocks, 10% high yield bonds, 5% government bonds, 5% bond funds, and about 1% cash plus cryptocurrency. I invest in bonds and dividend stocks to provide the cash flow required to fund my retirement. That said, I am not just interested in yield. Total return is just as, if not more, important than yield. I wrote three articles this year on how to find investments with superior total returns. The approach I use to select equity funds can be found here. Equity Fund Selection Approach.
The approach I use to select high yield bonds can be found here. High Yield Bond Selection Approach.
The approach I use to select stocks can be found here. Stock Selection Approach.
Most of my bond funds are in the BlackRock Floating Rate Income Strategies Fund (FRA) to take advantage of high yield floating rate returns which are not easily duplicated with traditional bonds.
I summarize my approach to stock selection below.
Stock Selection Approach
My approach is to find deep value dividend stocks that have the potential to provide a much higher future rate of return than the S&P 500. I use the FASTGraphs tool to analyze individual stocks. FASTGraphs stands for Fundamental Analysis Software Tool and, in my opinion, is the best tool to uncover stocks that might outperform over the next several years. I began using FASTGraphs at the end of last year.
As Benjamin Graham once said: “Over the short term the market is a voting machine, but over the long term it’s a weighing machine.” The market can punish companies that momentarily stumble, and at times punish much more than fundamentals might suggest. I look for companies that might have been punished recently but are fundamentally sound. One which the analysts estimate that earnings will either begin or continue to grow in the future. I also look for companies that have earnings continually growing but are trading at a much lower price multiple than historic. A deep value approach.
The most important metric for future stock performance is its future earnings. Instead of showing me the money, show me the earnings. Price will eventually follow earnings. I have read many articles hawking stocks. The articles typically say a company has this widget or is buying this asset, macroeconomics looks rosy, and its past ROIC looks great. Nowhere is an estimate of future earnings per share discussed. Save the description. Show me the earnings.
I will illustrate the stock analysis approach I use with Nexstar Media Group (NXST). From the Nexstar website, “Nexstar Media Group, Inc. is a leading diversified media company that produces and distributes engaging local and national news, sports and entertainment content across its television and digital platforms, including more than 310,000 hours of programming produced annually by its business units. Nexstar owns America’s largest local broadcasting group comprised of top network affiliates, with 200 owned or partner stations in 116 U.S. markets reaching 220 million people.”
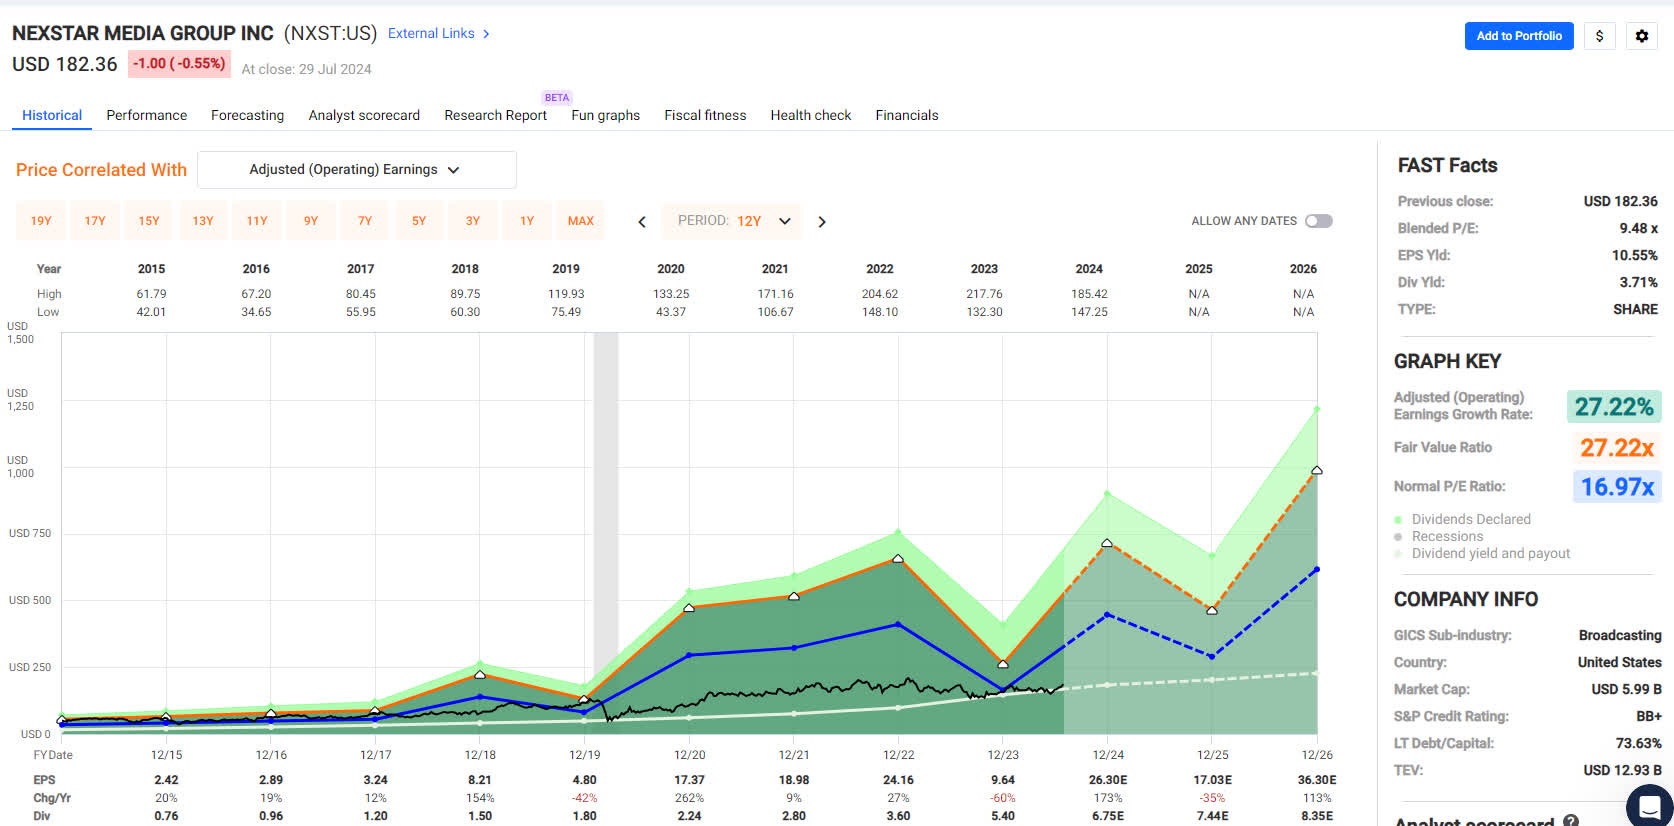
The earnings growth rate of NSXT from now until the end of 2026, per FASTGraphs, is a robust 30% annually. I first try to find a long-term price history with a similar historic earnings growth rate as its current estimated growth rate. NXST’s 27% earnings growth rate over the last 12 years, shown below, is close to its current estimate. The black line shows NXST’s price history. The average price multiple, Price to Earnings ratio, that the market has placed on NXST’s earnings over the period was 16.97. NXST current blended PE ratio is 9.48. This is the first indication that NXST is undervalued. The blue line shows the price NXST stock would be if it were at its 12-year average 16.97 PE.
NXST 12-Year Price History (FASTGraphs)
If NXST’s stock reverts to its normal 12-year PE, it would give a 67.4% annual rate of return by the end of 2026. The high rate of return is due to a combination of robust earnings growth plus price reversion to its long-term average price earnings ratio.
NXST Return if price reverts back to 12-year average PE (FASTGraphs)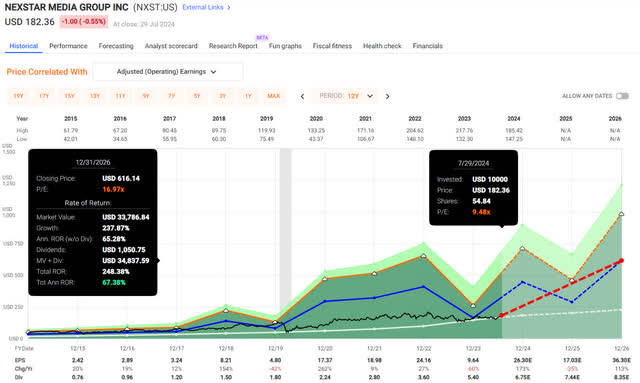
I then look at a more recent price history of the stock to assess the current price multiple against its recent price multiple. I look at price and earnings over the last five fiscal years (eight years, 2014 – 2026). NXST’s price over the last five fiscal years is shown below. NXST’s earnings over its last five fiscal years have grown at an annual rate of 20.42%. Its normal PE ratio over the last five fiscal years was 10.26 compared to its current 9.48 PE ratio.
NXST 5 Fiscal Year Price History (FASTGraphs)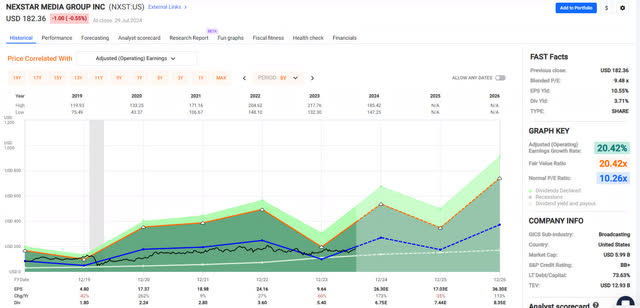
If NXST’s stock reverts back to the average PE it had over the last 5 fiscal years, it would give a 37.1% annual rate of return by the end of 2026 with most of the return due to growth in earnings plus dividend yield.
NXST Return if price reverts back to average PE over the last 5 fiscal years (FASTGraphs)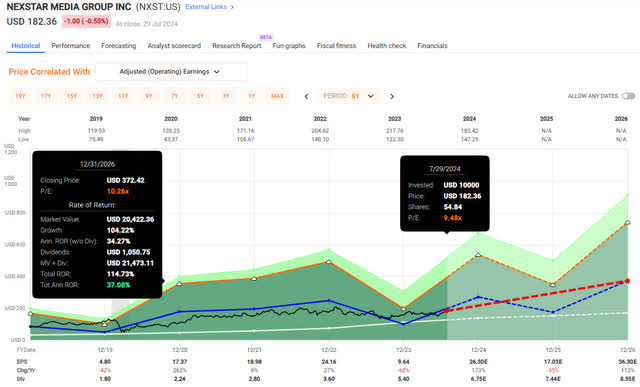
Finally, if NXST did not revert to its historic PEs, if its price multiple stayed at its current 9.48 PE, its annual return would be its annual earnings growth rate plus dividend yield. That would give:
Rate of return = EG + DY = 29.95% + 3.71% = 33.7%.
With earnings estimated to grow as fast as or faster than historic averages, NXST’s price multiple will most likely eventually revert to its higher historic price multiple. The 12-year price history has the earnings growth rate most similar to its current estimate. Worst case is it maintains its current price multiple.
I average the three different estimates for future rate of return to compute an average estimated rate of return.
Estimated Rate of Return = (67.4% + 37.1% + 33.7%) = 46.1%.
We now have found a deep value (PE<15, PE< Historic average), dividend stock (3.71% dividend yield) with an estimated annual future return (46.1%) over four times greater than the S&P 500 (11%).
Current Portfolio and Performance
As I mentioned above, I began using FASTGraphs last year to identify dividend stocks that might outperform. I made purchases of stocks that had superior estimated rates of return in December 2023. My stock portfolio on December 31, 2023, is listed below. The stocks are from generally well-known companies. The average dividend yield of the portfolio was 7.34%.
December 31, 2023 Stock Portfolio (FastGraphs, Author)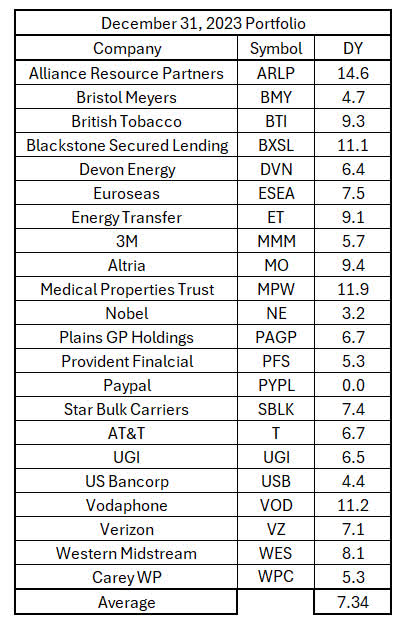
I periodically reviewed stock performance and re-estimated future returns. I made the following stock purchases and sales during the year.
2024 Stock Portfolio Buys and Sells (Author)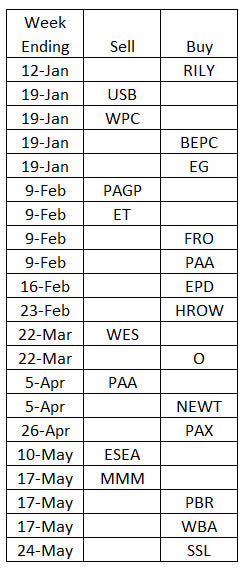
My current stock portfolio is shown below. The stocks have appreciated since originally purchasing them. The current average dividend yield is 6.53%.
Current Stock Portfolio (FASTGraphs, Author)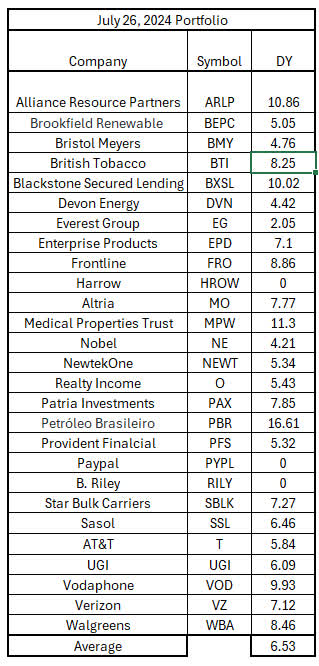
The year-to-date total return of my stock portfolio, as of July 26, 2024, was 18.8%. Individual returns ranged from 127% for HROW to -34% for WBA. HROW keeps going up and although WBA’s recent price collapse was disappointing, it is up 7% from its low.
The total return was made up of 14.6% price appreciation plus 4.25% gain in dividends. That works out to a 32.7% annualized total return, including a 7.4% annualized dividend yield. The total return exceeds the 15.3% return of the S&P 500 including dividends.
The deep value dividend stock portfolio with the potential to outperform the S&P 500 outperformed the S&P 500, which is no small feat given how much the S&P 500’s AI stocks have been bid up. If this were a dividend stock mutual or exchange-traded fund, it would be ranked number one as an income-oriented value portfolio that has superior total returns.
Stock Valuation and Estimated Returns
My approach to generating a list of stocks to analyze is to first do a quick cursory FASTGraphs analysis of stocks recommended by Seeking Alpha authors plus investment articles from Morningstar, Barron’s, Yahoo Finance and several other websites. FASTGraphs can quickly answer at a glance the following questions. Is the stock a deep value stock (PE<15)? Is the current PE less than its long-term PE (Undervalued)? Are earnings expected to grow in the future? Is the estimated rate of return greater than 20%? Stocks that pass the four questions are put on a list for further evaluation.
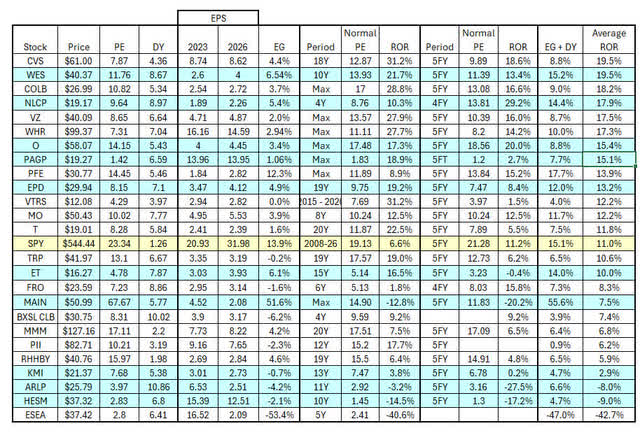
I then performed a more thorough analysis of the Fifty-Three stocks that passed the criteria. The result of the analysis is shown in the two tables below. I used FASTGraphs estimate of Adjusted Operating Earnings and earnings growth for most stocks. I used Operating Cash Flow – Funds From Operations for the REITs, Master Limited Partnerships, and several financial stocks when FASTGraphs recommends using that to analyze the company’s stock. Those stocks are highlighted in blue.
The table lists stock symbol, price on July 26, 2024, current trailing PE, dividend yield, 2023 and 2026 earnings or cash flow per share, earnings growth rate from now through the end of 2026, the normal PE and computed rate of return for two different periods – longer term with similar earnings growth rate as current and last 5 fiscal year period, earnings growth + dividend yield, and finally the average rate or return from the three different approaches to estimating future return.
The stocks in the tables are ranked by average estimated rate of returns from now through the end of 2026. The first table is of stocks with a rate of return of 20% or greater. The second table is stocks with a rate of return less than 20%. The S&P 500 (SPY) is highlighted in yellow in the second table.
Stock parameters and estimated returns Tier 1 (FASTGraphs, Author) Stock parameters and estimated returns tier 2 (FASTGraphs, Author)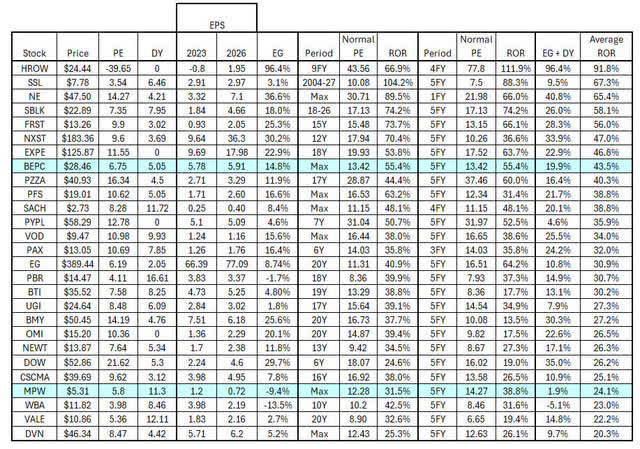
The chart below compares stock dividend yield versus the estimated annual rate of return through 2026. Circle symbols are stocks analyzed using adjusted earnings from operations. Diamond symbols are stocks analyzed using funds from operations. I like using this chart to compare dividend stocks. As a retired investor, I am interested not only in high dividend yields but also total return. The blue line below is my “goodness line”. I am willing to buy a stock with zero dividend yield if it has an estimated return about triple the S&P 500’s. I will trade some total return for a higher dividend yield. I would be willing to buy a stock with a 13% dividend yield, but only has a 13% estimated rate of return. This is the bird in hand worth two in the bush scenario, trading off potential total return for the higher probability dividend return. Also, a stock which gives a 13% dividend with a 13% total return would, by definition, have zero price appreciation. That return would be analogous to a bond but with about triple the yield of current government 10-year bonds.
Stocks to the right of the line are better investments, have higher estimated returns for the same dividend yield, than stocks to the left of the line. The further to the right, the better the potential investment. HROW, SSL, NE, SBLK, FRST, and PBR appear to be superior investments than ESEA, HESM, ARLP, OTCQX:RHHBY, PII, MMM and the S&P 500. The bold blue symbols are stocks in my current portfolio. Bold green symbols are stocks I am currently contemplating buying to replace some of my stocks that are left of the line.
Stock Dividend Yield versus Estimated Rate of Return (FASTGraphs, Author)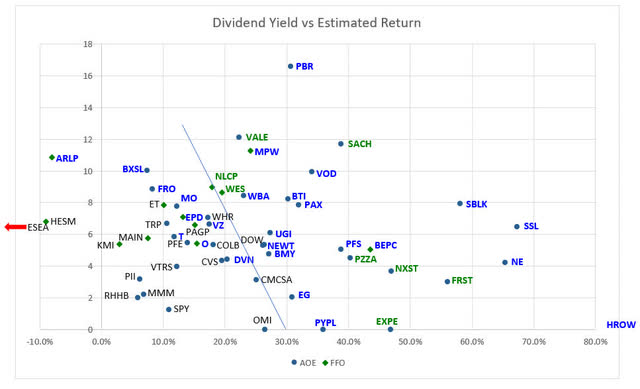
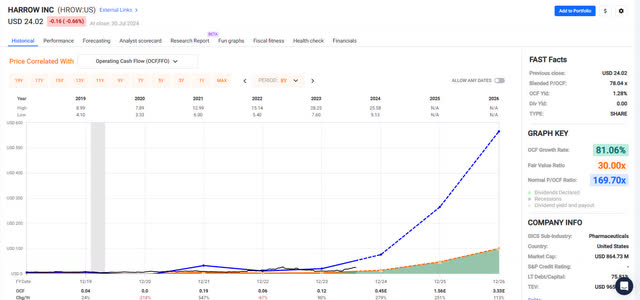
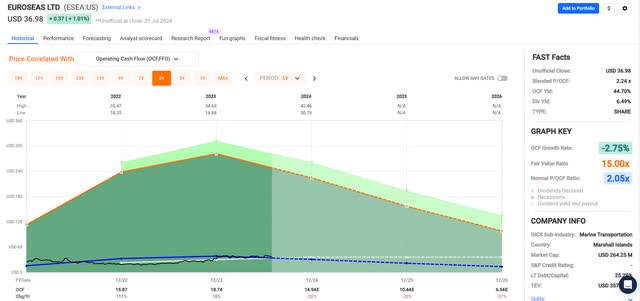
It is instructive to compare the stock with the highest estimated return – Harrow (HROW) – with the one with the lowest – Euroseas (ESEA). HROW’s price versus adjusted operating earnings and price versus funds from operations are shown below. Analysts estimate that HROW’s earnings and cash flow will soon increase substantially. Price should follow earnings.
HROW price history and earnings estimates (FASTGraphs) HROW price history and cash flow estimates (FASTGraphs)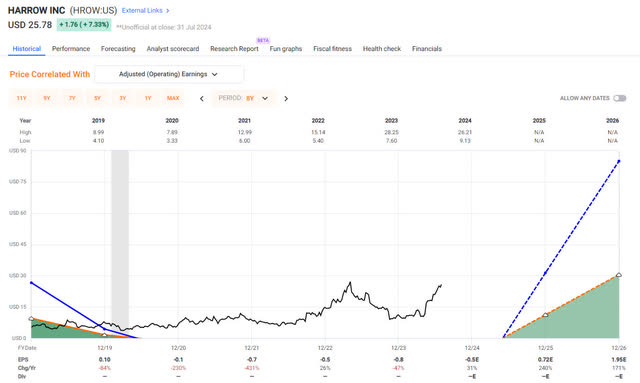
ESEA’s earnings, on the other hand, are expected to collapse.
ESEA price history and earnings estimates (FASTGraphs) ESEA price history and cash flow estimates (FASTGraphs)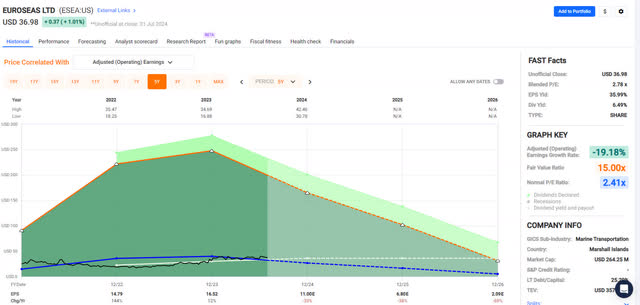
Best Deep Value High Dividend Stocks with Superior Estimated Returns
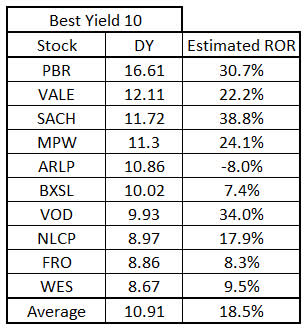
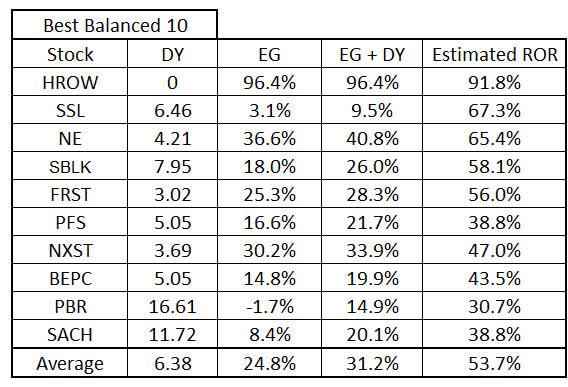
The Best of the stocks are listed below. The average yield and estimated returns of the best ten stocks in each category are shown. A portfolio of the ten stocks with the best estimated returns offer average dividend yields three times greater than the S&P 500 combined, with potential returns five times that of the S&P 500. The Best yielding stocks offer average yields nine times greater than the S&P 500 combined, with potential returns almost twice the S&P 500. The best-balanced stocks – those furthest to the right of the goodness line – offer average yields five times greater than the S&P 500 combined, with potential returns five times the S&P 500. The best-balanced portfolio offers 50% greater yield than the best return stocks, with only a small reduction in estimated total return. Those are the best current deep value, high dividend yield, superior estimated return stocks to buy now.
Ten stocks with the highest estimated returns (FASTGraphs, Author) Ten stocks with the highest dividend yields (FastGraphs, Author) Ten stocks with the best balanced returns (FASTGraphs, Author)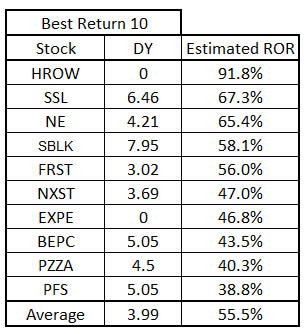
The chart below adds the average yield and estimated returns of the three portfolios of ten stocks to the chart above. Those stock portfolios are shown with the blue square symbol. Also shown, in brown lettering, is the estimated return of the current AI darling Nvidia (NVDA). Don’t buy AI stocks. Buy dividend stocks with superior estimated returns.
Stock Dividend Yield versus Estimated Rate of Return 2 (FASTGraphs, Author)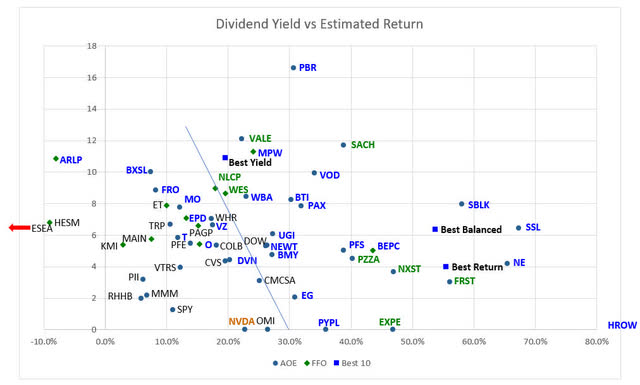
Risks to Investors
There are three principal risks to investors. The first is that the companies do not achieve their estimated future earnings. Earnings estimates are the best estimates of analysts that follow each company. The companies may or may not achieve the estimated earnings. The companies may exceed or miss earnings estimates. Investing in a group of stocks minimizes the risk of any one company underperforming. My current portfolio has 27 stocks. The aggregate earnings for a group of stocks should be reasonably close to estimates, unless the economy suffers a downturn.
The second risk is that the undervalued stocks remain undervalued and do not revert to their longer-term price multiples over the next 2 1/2 years. If this happens and the P/Es of the funds do not change, their price would still appreciate at their earnings growth rate, while an investor would collect a dividend yield. In the case of the best-balanced portfolio, earnings would appreciate an average 24.8% a year. Add in the 6.4% dividend yield, and an investor could earn a 37.6% annual return while waiting for price multiples to revert to long-term mean.
Finally, the third risk is the risk of an economic downturn, which may impact small and mid-caps more than large caps. That said, value investing does fine in recessions. Value stocks during recessions.
Editor’s Note: This article discusses one or more securities that do not trade on a major U.S. exchange. Please be aware of the risks associated with these stocks.
Credit: Source link