

PM Images
S&P 500 companies are generating high amounts of free cash flow. But that doesn’t mean the market is a blanket value today. Furthermore, many growth segments of the domestic equity market sport rather small free cash flow yields. Value investors are relegated to finding ideas primarily in cyclical spots like Energy, Materials, Consumer Discretionary, and Industrials. We have seen value and cyclical sectors outperform at times over the past four years, but it seems like momentum always ends up reverting to areas like Information Technology and Communication Services.
I reiterate a hold rating on the Pacer US Cash Cows 100 ETF (BATS:COWZ). I was lukewarm on the fund in late 2022, shortly before tech took flight. Indeed, over the past 18 months, COWZ has underperformed the S&P 500 by more than 15 percentage points. Today, I like its valuation but with continued relative strength in growth, I am not overly excited about this free-cash-flow-focused ETF.
S&P 500 Sector Valuations: Energy Tops On The FCF Yield Metric
Goldman Sachs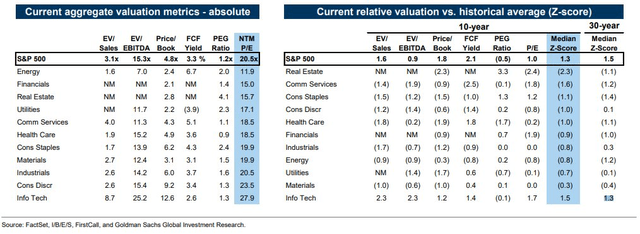
According to the issuer, COWZ is a strategy-driven exchange-traded fund that aims to provide capital appreciation over time by screening the Russell 1000 for the top 100 companies based on free cash flow yield. Free cash flow is the cash remaining after a company has paid expenses, interest, taxes, and long-term investments. It can be used to buy back stock, pay dividends, or participate in mergers and acquisitions.
COWZ is a large ETF with more than $23 billion in assets under management as of June 1, 2024. For what it does, the product features a moderate 0.49% annual expense ratio while its trailing 12-month dividend yield is only about 0.4 percentage points above that of the SPX. Share-price momentum has been solid in the last several months, particularly following the late-October 2023 low in the total US market.
The fund also ranks well on a risk basis given its modest historical standard deviation profile, though there is a significant sector bet toward Energy currently. And I expect that to persist given the free cash flow generation seen among both small and large oil and gas companies. Finally, COWZ is among the more popular ETFs for value investors, so its daily liquidity is very healthy, earning the fund an A+ ETF Grade by Seeking Alpha. More specifically, average daily volume over the past 90 days is high at 2.2 million shares while the 30-day median bid/ask spread is tight at just 0.1%, per Pacer ETFs.
Looking closer at the portfolio, the 5-star, Silver-rated fund by Morningstar plots on the far-left column of the style box, indicating its value tilt. There is some size diversification, though, with three-quarters of the allocation invested in small- and mid-cap equities. Just 9% of COWZ is considered growth. With a current price-to-earnings ratio of 11.6, it’s a full nine turns cheaper than the P/E of the S&P 500 while COWZ’s long-term EPS growth rate is actually quite low at 6.6%, resulting in a moderate PEG ratio of 1.8x.
COWZ: Portfolio & Factor Profiles
Morningstar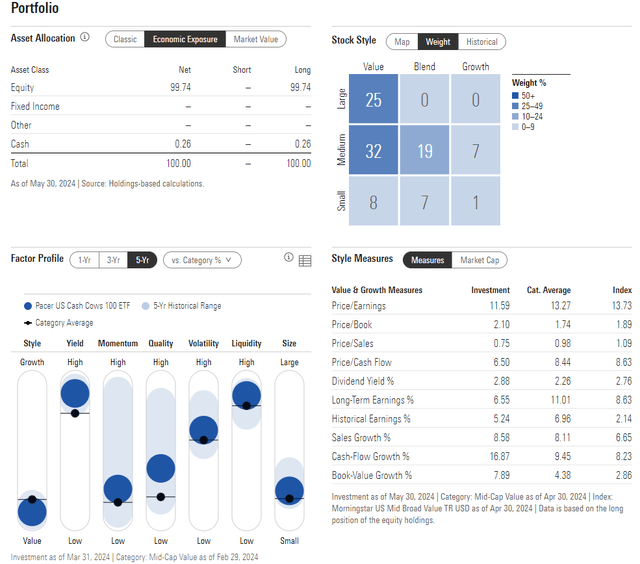
COWZ is largely a play on Energy and Materials. Energy is of course the biggest weight at 23%, about a 20-percentage-point overweight compared to the broad US stock market. Materials at 9.2% is another 6ppt of overweight. The growth-heavy Information Technology sector is less than 10% of COWZ despite many of today’s mega caps generating significant amounts of free cash flow. There is also no Financials or Real Estate exposure as the FCF metric does not apply to how accounting is performed in those sectors.
Thus, I would rather use COWZ as a small satellite position rather than allocate it aggressively to dominate a long-term portfolio.
COWZ: Significant Energy Weighting
Seeking Alpha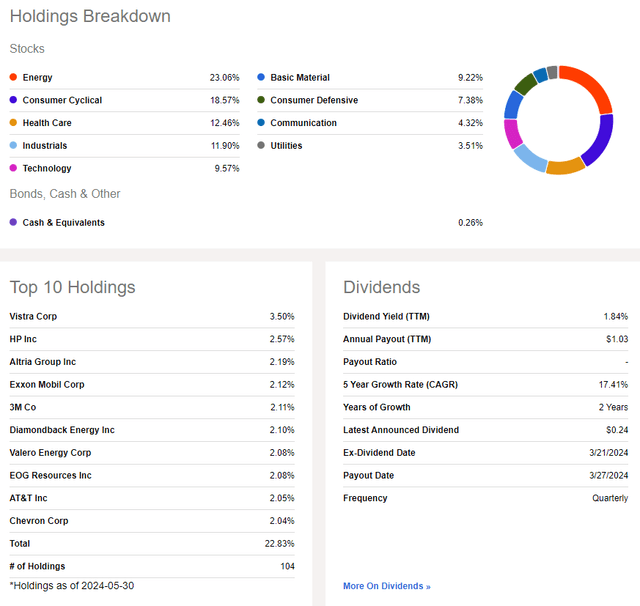
Seasonally, June and July are often strong months, but volatility has historically been seen from August through mid-October. So, now is a fine time to be in the ETF, but selling calls on COWZ could help increase the portfolio yield should downside price action take place again in the later summer months.
COWZ: Bullish June-July Typically, But Volatility Can Strike Later In Q3
Seeking Alpha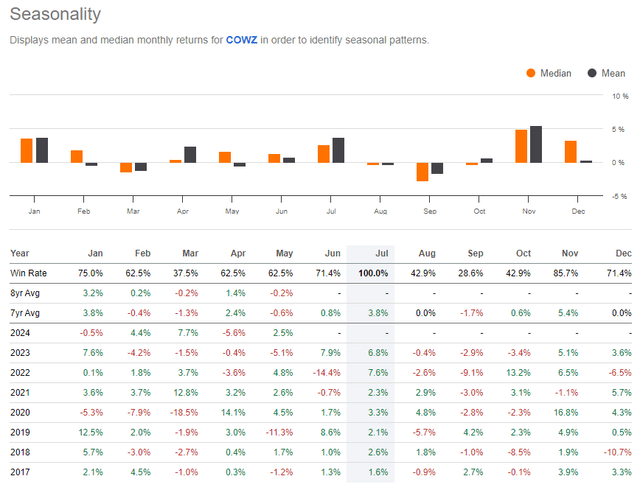
The Technical Take
With a mixed valuation and somewhat concentrated sector positioning, COWZ’s technical chart is generally favorable. Notice in the graph below that shares are above the key $51 to $51 zone. That is also where the rising long-term 200-day moving average comes into play, so there’s some important technical confluence there. Near-term, COWZ has struggled to climb back above the $56 level and the same difficulty has been seen on the RSI momentum oscillator at the top of the graph.
I would like to see COWZ not only rise through $56 on improved momentum, but also perform better against the S&P 500. Relative strength has been weak ever since November 2022. The ETF has been, in fact, an opportunity cost for investors, assuming funds invested in the ETF would have otherwise been put to work in a low-cost S&P 500 index fund. COWZ also sports negative alpha this quarter with its recent decline while the overall market is not far from all-time highs.
Overall, while COWZ’s technical chart is healthy, relative strength is weak and there have been some near-term bearish moves, indicated by the flattening and now-negatively sloped 50dma.
COWZ: Above Key Support, Monitoring RSI Trends After A Poor Start To Q2
StockCharts.com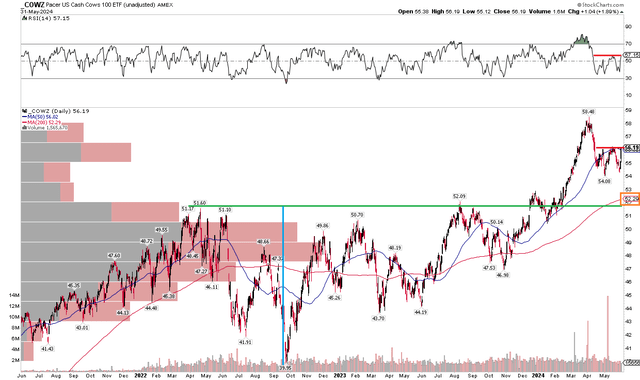
The Bottom Line
I reiterate a hold rating on COWZ. The strategy is sound, but the sectors and styles in which the fund is invested continue to underperform while the ETF’s valuation is not incredibly cheap considering the EPS growth rate.
Credit: Source link