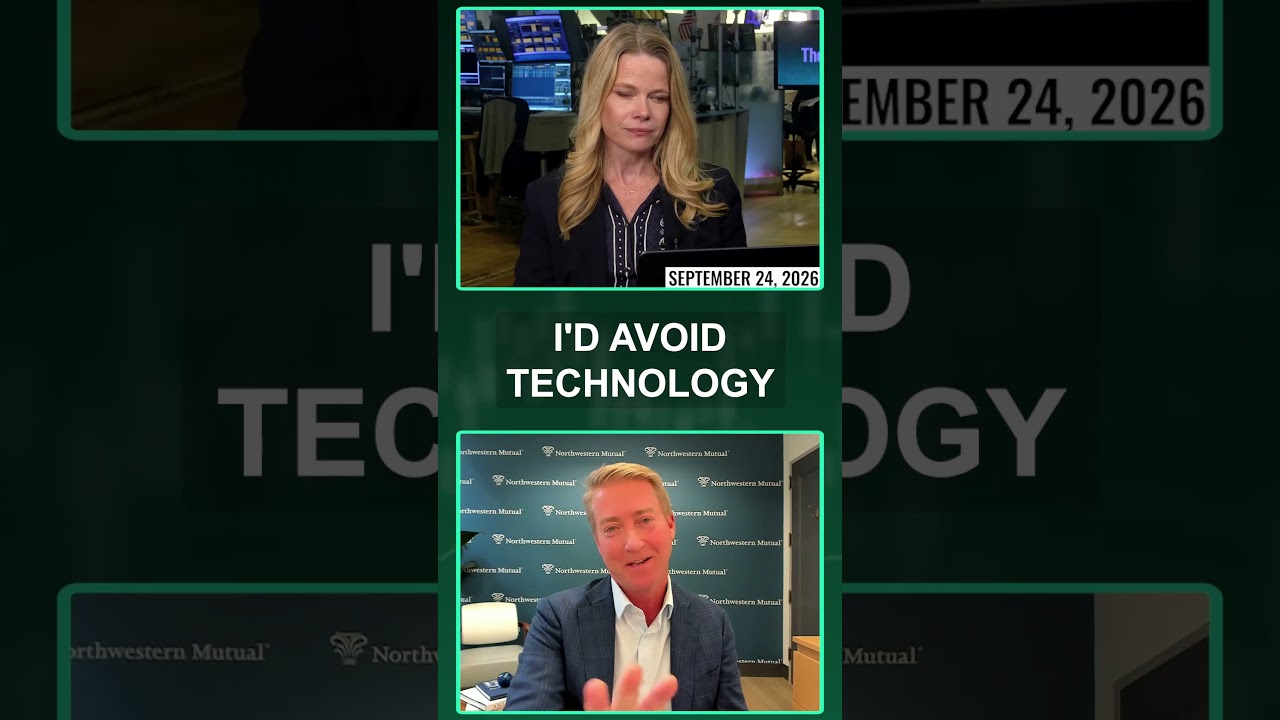
The Chart Professor is back!
Bruce Kamich, RealMoney’s in-house technical analyst, a.k.a. The Chart Professor, walks us through the concept of technical indicators and why they are an integral part of your chart analysis.
Technical indicators bascially are mathematical calculations that are based on the price, volume, or open interest of a security or contract.
“They are derivatives of the price action and look at prices and volume from the marketplace,” says Kamich.
He gives us a preview of four popular indicators:
Moving Averages
Relative Strength Index
Moving Average Convergence-Divergence (MACD)
On-Balance-Volume
So watch the video above for your first lesson on technical indicators.
And for a refresher on the charts we have previously talked about, check out the links below:
Chart Professor: 3 Things You Need to Know About Every Stock Chart
Chart Professor: A Bar Graph Shows a Stock’s Extremes and Gaps
Chart Professor: A Candlestick Graph Can Give You an Edge Over Other Traders
Chart Professor: Point and Figure Charts Ignore the Noise
Be sure to follow Kamich on Twitter @brucekamich. And for more in-depth stock analysis, check out RealMoney.
You can also find us on…
SUBSCRIBE |
ACTION ALERTS PLUS |
FACEBOOK |
TWITTER |
PODCASTS |
THESTREET.COM |
LINKEDIN |
INSTAGRAM |
Sign up for ActionAlertsPlus.com today for exclusive insight into Jim Cramer’s charitable portfolio:
source