
helen89
My thesis
My “Buy” recommendation for BJ’s Restaurants (NASDAQ:BJRI) is based primarily on the opportunity presented with the strategic partnership with PW Partners and the benefits arising from the improvement in margins resulting from the agreement.
Even if the share is not undervalued, this recommendation is based more on the qualitative aspects of the company, which apparently seems to find enough catalysts to generate positive returns around 140% higher than in 2023 (if exogenous factors allow a small increase in revenue and a small improvement in margins).
Dissecting the business qualitatively
Value proposition
BJ’s Restaurants is a leading casual dining brand distributed nationally across 30 states, operating approximately 216 restaurants. The company stands out among traditional casual dining brands precisely because it presents a varied menu, with around 100 different items and an affordable price.
BJ’s value proposition targets both functional and intrinsic benefits, such as the selection of fresh ingredients, multiple gluten-free options and an extensive list of award-winning craft beers, but also non-functional benefits, such as a sophisticated ambience, spaces for socializing and self-identifying experiences. In this way, the company aims to “provide the comfort of a restaurant and the energy of a bar”.
Like the overwhelming majority of casual dining restaurants, the dishes are highly customizable. The company remodels its menu two to three times a year (as well as its respective prices).
Therefore, we can infer that BJ’s competitive advantage lies precisely in the fact that it offers casual meals at a low cost and yet provides a sophisticated atmosphere and more elaborate dishes. Main dishes at BJ’s range from $8.75 to $34.95, excluding promotions. Remember that companies do not compete with their products or services, but with their entire value proposition. The product is just one of the components that determine the benefits provided by the value proposition.
The average check per customer in 2023 was $21.00, approximately 5% higher than 2022. This increase was driven by a change in the sales mix and an increase in the number of orders per customer. This means that BJ’s is successfully introducing premium items through strategic repositioning. Please note that this liberality for the strategic repositioning of menu items can only be done through your policy of periodically changing the menu.
By improving the product mix and incorporating the need to reposition the menu in light of the need to overcome the weight of inflation, the company certainly acted to encourage upselling and cross-selling. But how did BJ’s do it? It does so mainly through Happy Hour offers and the inclusion of special menus.
As many consumers already expect a less complete service when they go to casual dining restaurants, BJ’s manages to amplify customer satisfaction precisely by breaking the paradigm of this common sense, surpassing the expected value with the perceived value. Remember, the lower the expected value, the more easily the perceived value will overcome it, generating more satisfaction. Of course, marketing is not an exact science, but these small representations make us realize the rationale behind it.
Therefore, we can summarize BJ’s value proposition as a casual dining experience, with affordable prices, but with a sophistication and ambience well above the sector average. This is the company’s main point of difference (PoDs) compared to its competitors. Remember: without difference there is no preference. A value proposition without PoDs is very weak and difficult to defend.
Expansion
BJ’s expansion strategy is predominantly based on finding high-quality, high-profile locations for its restaurants. As we have already discussed in the previous section, due to its value proposition, BJ’s has a greater geographic attractiveness than other restaurants in the casual segment, as the superior quality of its facilities and meals generate a greater appeal for customers to travel geographically.
The company prioritizes the acquisition of properties in commercial areas and with a substantial population density through leases and strategic acquisitions when these present favorable conditions.
BJ’s strategically chose the ‘clustering’ approach, allowing the appropriate segmentation of its customers based on a defined geographic area. Once segmented, BJ’s will be able to base its strategies on the demographic data in which the units are located and focus its promotional strategies and marketing targeting on selected customers, with greater effectiveness and efficiency. Furthermore, clustering facilitates communication with local stakeholders and integration with the community as a whole.
Obviously, the company always aims to overcome capital costs with its rate of return per restaurant. To obtain the profitability acquired, BJ’s waits until the maturation period, which lasts approximately 2 to 5 years. The company’s goal is to achieve a combined return of 15% to 20% on invested capital. For already mature units, the company uses as a benchmark the amount of $7 million in annual revenue, as well as an average operating cash flow margin of approximately 20%.
The maturation period is extremely important precisely because of the volatility of revenue in restaurants less than three years old. After the maturation period, revenues generally increase and growth remains sustainable, with margins already parameterized and without many production bottlenecks.
Aiming to make the opening of new units more flexible, for the year 2024 the company is studying a prototype unit model that will be 7,200 feet (300 feet smaller than the current single model) and will cost approximately $6 million (about $1 million cheaper than the current model).
Maximizing shareholder returns: agreement with PW Partners
Last month, BJ’s announced that it is engaging with PW Partners to provide recommendations on analyzing and containing the company’s cost structures and improving operational efficiency. It is interesting to mention that precisely because BJ’s has signed a cooperation agreement with a large investor (PW Partners owns around 5% of the company’s common shares) it means that the company is committed to a lasting relationship and generating value together with the shareholders.
But it’s a big mistake to think that PW Partners is just an ordinary activist investor. It is a consulting company specialized in generating value for small and medium-sized companies and is led by a great veteran in the restaurant industry, Patrick Walsh. Walsh previously served on the Board of Directors from 2014 to 2022, during which time he absorbed extensive knowledge about the cost structure, capital structure, operational efficiency, and possible bottlenecks at BJ’s. To understand more about Walsh’s approach, I recommend reading his personal website. Here you will find some insights into business recovery.
With management focused on maximizing returns for shareholders (with a large experienced shareholder leading this process), I believe that BJ’s will be successful in improving both its operations and profitability, which suffers greatly due to a lack of parameters and high expenses with SG&A. Below I will demonstrate to you using the DuPont method how necessary it is to improve margins in the case of BJ’s to increase shareholder returns. Remembering that here I maintained the participation of equity capital in order to better illustrate the intrinsically operational situations.
Author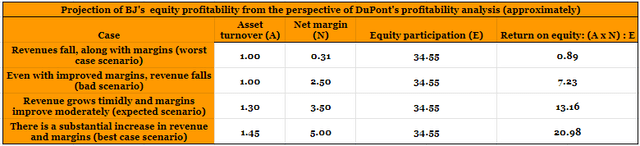
I believe that through this sensitivity analysis I was able to demonstrate how necessary this improvement in margins is and how impactful this would be on the return to shareholders, since the company has a high turnover and leverage. Therefore, in addition to pricing, my recommendation is based on how much an improvement in margins would impact the generation of value for shareholders.
Measuring BJ Restaurants’ risk through quantitative models
I will use quantitative models to analyze the structural risk of BJ’s Restaurants. Each model generally establishes certain parameters that each author considered essential for maintaining business activity.
Since I am looking for long-term patterns, I will condense the analysis and compare it to its peers. This way, even if there are no structural risks, we can use comparative analysis to define which company is the safest structurally to invest in.
Author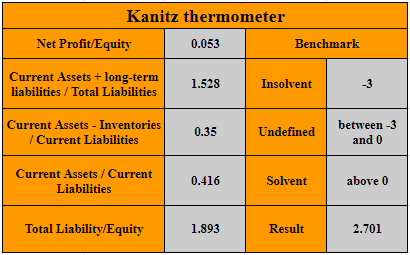
The Kanitz Thermometer indicates solvency for BJ’s. Note that this model is almost entirely focused on risk analysis based on solvency indicators. Therefore, the Kanitz Thermometer analysis saves us from a more detailed analysis of BJ’s liquidity.
Author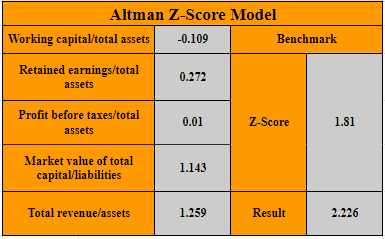
The Altman Model, corroborating Kanitz, indicates that BJ’s is above the critical point, but with less clearance than the previous model. The Altman Model prioritizes the analysis of return on invested capital and turnover.
Author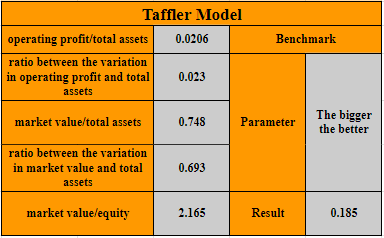
The Taffler Model makes a deeper analysis based on market value when parameterized under BJ’s financial situation.
Author
By combining the results of the different models, I can infer that BJ’s equity situation does not face any type of structural risk in the short term.
On the other hand, we can infer that it is closer to bankruptcy than its direct competitors, and that is not a comfortable position. In both promotional and inflationary environments, companies that do not have premium pricing invariably need to follow the institutional imperative and pressure their margins.
Therefore, companies with a more favorable financial position will tend to remain competitive in adverse environments for longer.
Financial analysis
Debt sustainability and capital formatting
To have a deep understanding of how a company works, it is always necessary to analyze the capital structure. This way I will be able to analyze how BJ’s finances its operations, what is the format of the capital sources used, how this capital is being allocated and what is the cost/return that the company is obtaining from the current format.
Below, I will define the proportion of third-party capital that BJ’s uses in relation to its own capital. This indicator is also known as Degree of Debt, as it exposes the company’s dependence on the use of third-party capital in its operation.
Author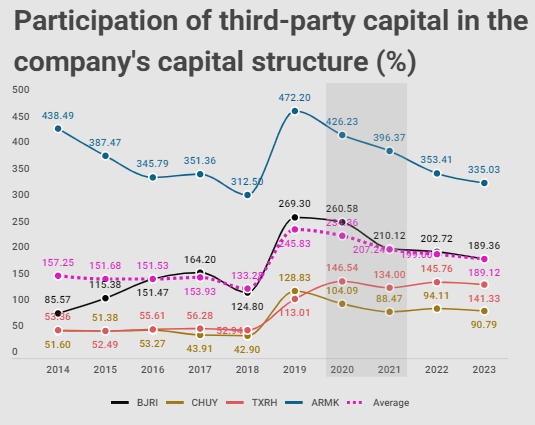
Through the statistical tabulation of balance sheets of companies in the same sector as BJ’s, we can infer that the company uses predominantly third-party capital to the detriment of its own capital. Furthermore, another interesting conclusion is that the company has debt very similar to the sector average.
Author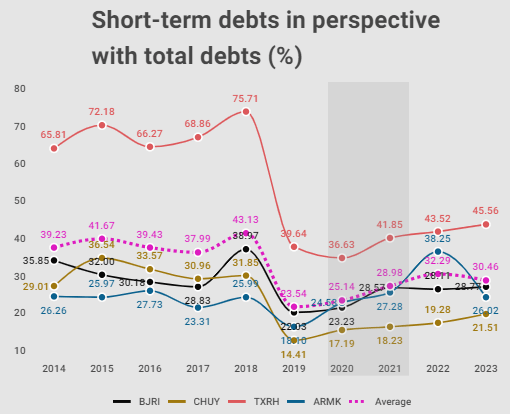
As the majority of BJ’s debt was created as a way to finance its fixed assets, the profile of its debts improved as they grew nominally. The movement is common in corporate finance, as the financing of fixed assets are clear examples of the link between these assets and the maturity of the debt used.
These assets do not generate an immediate cash flow, and the central idea is that you can pay off the debts arising from this purchase with the cash flows that the asset in question generates. In the case of fixed assets, this period may vary, but it will always be in accordance with their projected useful life.
Before analyzing the costs and returns of each source of capital at BJ’s, below, I will highlight the relationship between the return on assets and the return on equity. Using this indicator, I will be able to qualitatively analyze this debt and say whether BJ’s is constantly using debt to boost returns to shareholders or whether this debt is being harmful.
Author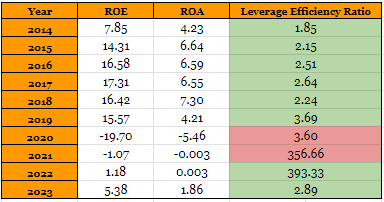
Note that most of the time, leverage helped BJ’s in order to increase the return on equity. But in the same way, the company ran into problems when it faced an abrupt decrease in demand in 2020 and also amplified its losses.
Despite being successful in increasing its turnover post-pandemic, the company was unable to present as great an efficiency as it once did in terms of its leverage.
This indicates that BJ’s should continue to reduce the proportion of debt capital and consequently the leverage, as the trade-off between the amplification of ROE and the interest paid on the debt is starting to prove expensive. And that is precisely what managers are doing. Since 2020, the company has reduced its debt by around 15%.
Still, in relation to the sustainability of BJ’s debt, let’s analyze how much this debt takes from operating profit over the years. Generally, I use the following rule as a parameter: if a company does not generate enough operating profits to cover loan payments and anything else, between 50% and 100%, then it needs more equity capital, not another loan.
Author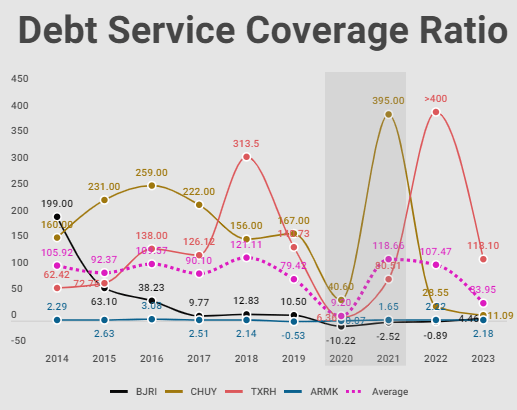
As part of the analysis of BJ’s debt in its capital structure, it is interesting to look at the debt service coverage indicator. This way, we can see if BJ’s keeps the periodic interest payments covered healthily from its operating profit. Although the company maintains multiples constantly above 1 (except in the periods of 2020, 2021 and 2022, when the company presented an operating loss), we can see a decreasing trend, showing that BJ’s is losing the ability to cover debt service with very high multiples as it used to be.
Author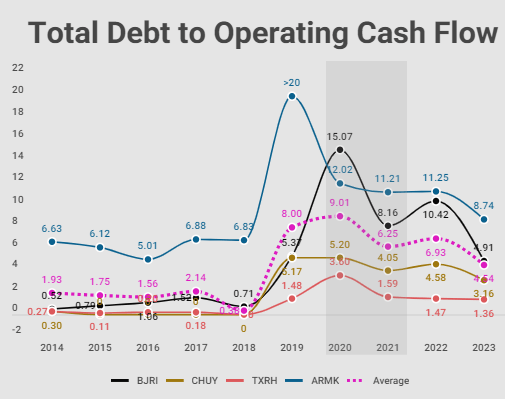
Now that I’ve demonstrated BJ’s ability to pay debt service in accordance with its operating profit, how about we take a look at its ability to pay its debt principal from its annual operating cash flow? Therefore, we can interpret this indicator as: in how many years, based on the operating cash flow of the analyzed period, would each company be able to cover its total debt?
What is clear to me is that the entire sector went into debt in 2019, and with the decrease in demand the following year, all solvency and debt ratios were affected. I don’t believe that the levels will return to pre-2019 levels, but I think that companies have already shown in 2023 that they can generate an operational cash flow that allows them to remain solvent.
For the analysis of working capital, I chose to amalgamate the concept of own working capital and net working capital and analyze them together at once.
Author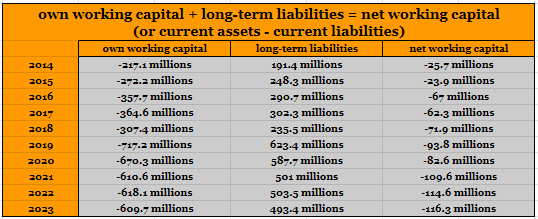
Even though non-current resources have increased (almost entirely due to the increase in long-term debts), fixed assets continue to outweigh net working capital. This results in two interesting patrimonial phenomena: BJ’s needs to use short-term resources for fixed assets (around 116.3 million in 2023) and also to finance its current assets.
I have already talked about the problem of using short-term debts for fixed assets, and this continues to be a problem for BJ’s, but I still need to talk about short-term debts to finance current assets.
The financing of current assets is generated from operating profits as the company manages its activity. If the company suffers from chronic undercapitalization shortages but is making operating profits, there is no problem financing its current assets from short-term loans. Is it ideal? Certainly not, but it could very well run smoothly.
With the normalization of cash flow in 2023 and 2024, I believe that the situation with loans to finance BJ’s current assets should not generate any problems, moreover, we have to take into account the way the company manages its operating cycle and its cash cycle. And this management is essential for optimal control of cash flow and, consequently, maintaining a positive cash flow and guaranteeing liquidity.
Operating cycle and cash cycle: analysis of average deadlines
The objective of BJ’s managers is certainly to transform accounts receivable and inventories as quickly as possible. For good cash flow management, knowledge of credit and receipt policies and their underlying impacts on cash flow is necessary.
Author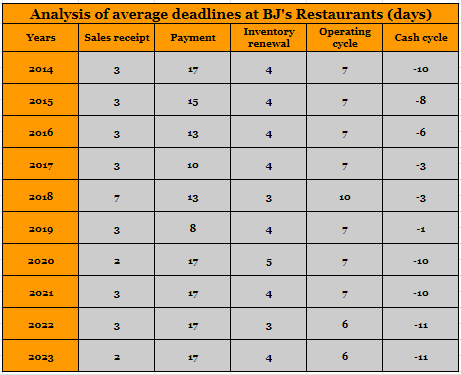
BJ’s average terms appear to be quite healthy. What is interesting here is the comparison between payments and receipts. A red light usually turns on when the collection period is one third longer than the payment deadlines, but this is certainly not the case at BJ’s. The company maintains a very healthy standard in accounts receivable, with a credit policy well-adjusted to its payment policy.
BJ’s has also been successful in further shortening the operating cycle, which is basically the total time required to buy inventory, sell it, and collect cash. Remember that I said that the company does not need to have working capital based on non-current resources? So, this is evidenced precisely by the operating cycle and the cash cycle.
As this money circulates with a lot of turnover in the operational process, this means that the company can take short-term loans to finance working capital, since it can be paid off in a short period. A negative cash conversion cycle indicates that the company is receiving money from customers faster than it is paying suppliers. And this makes cash flow management much easier with reduced net working capital.
This is an interesting tip when you analyze a company’s working capital. Always check the average terms to get an idea of whether or not it can rely on short-term loans to supplement its working capital.
Profitability and operability
Now let’s talk about the operability and profitability that BJ’s incurs in its core activity. Initially, I will analyze the asset turnover. Here we must pay attention to how responsive the company was in generating revenue after the 2019 immobilization.
Author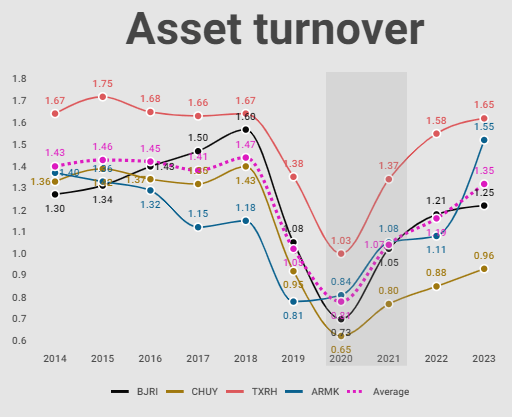
We can clearly see that with the increase in fixed assets in 2019, the efficiency of companies in generating revenue per asset has greatly decreased. In the case of the restaurant sector, with the resumption of demand after 2020, companies are increasing the efficiency of their assets as cash flows from the use of the asset to fulfill demand are realized.
Considering pre-2019 levels and assuming that BJ’s has the necessary competence to manage its assets and generate the same proportions of revenue, I consider that in an expected scenario, asset turnover will increase, but at a slower rate than before.
Author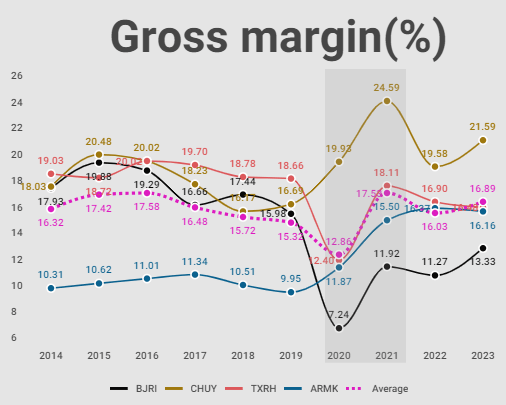
From the gross margin analysis, we can infer that BJ’s does not have any competitive advantage that can be noted by this indicator. By sector, the company has an average gross margin before the pandemic. After 2020, the company compressed its margins.
This indicates that the company is operating with some production bottlenecks that means it does not perform at the sector’s average efficiency, generating excessive operating costs.
Another response to declining gross margin is the inability to meet certain standards, characterized by the institutional imperative of the casual dining sector of promotional environments. Precisely because it operates with short margins as a pricing strategy, the company ends up compressing its margins when the market demands it.
As I already said, in my analysis of Chuy’s (CHUY), there really is constant pressure on the costs of raw materials that cannot be passed on to the end customer, since the elasticity of demand in the sector requires lower prices. As the sector is highly dependent on pricing, it ends up suffering more in inflationary periods.
And this is where the market positioning of certain brands comes into play. When your product is distinctly recognized from its competitors, the more inelastic the demand for it will be and the less dependent it will be on institutional imperatives.
Author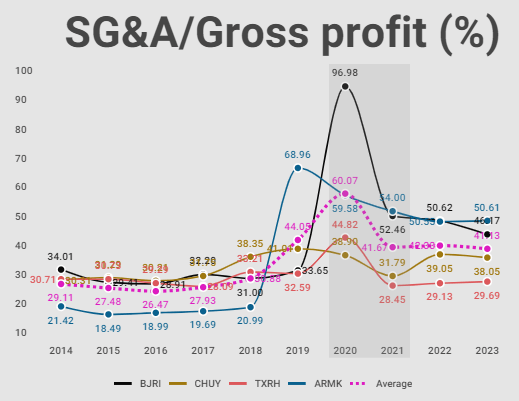
We can see that SG&A expenses increased in relation to gross profit after 2020. If we observe the behavior of the sector, it is clear that there was a movement similar to almost all other companies analyzed. Behind this movement are mainly personnel expenses, influenced by the increase in salaries at a level above inflation.
I don’t believe that SG&A expenses will return to the 2014-2019 level unless BJ’s streamlines its operations a lot. Implementation of integrated management systems and review of processes can help make this relationship more pleasant, but it seems that this is the sectoral paradigm.
Author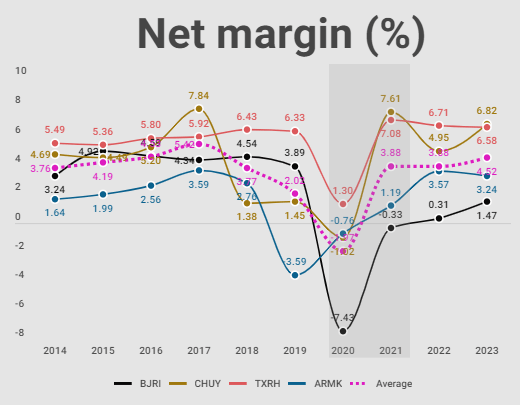
Although the worst is behind us, BJ’s has a very weak net margin. Both COGS and SG&A expenses increased in the post-pandemic period, despite constant revenue growth. It seems to me that this cost pressure comes from both wage inflation and agricultural commodity inflation. And yes, interest expenses have grown, but compared to the increase I mentioned previously, they don’t seem to make that much of a difference.
As I already said, in my analysis of Chuy’s, precisely due to the pricing strategy and value proposition, most casual dining restaurants cannot pass on these costs to end consumers without any repercussions on market share. Add this to promotional environments and local competition. That’s a recipe for margin depletion.
Author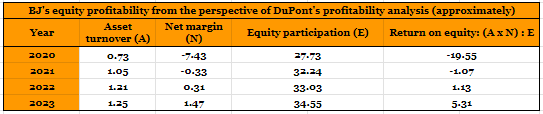
I like to use the DuPont method in my analyses because we are able to dissect the components that impact the remuneration of equity and identify some interesting trends.
See that even with a high turnover and a negative net margin, the company only amplifies its losses. Added to this, the effects of leverage were even more vivid in 2020, resulting in a negative profitability of 19.55%. As the years went by and pent-up demand was achieved, BJ’s managed to achieve better margins, but still insufficient for remuneration that is comparable to its peers. As the effects of leverage were dissipating with the increase in equity in the asset composition, the company leveraged its earnings more moderately in 2023.
If BJ’s maintained the same capital composition as in 2020 in 2023, the company would close the year with 6.62% return on equity. As there were doubts about the profitability of the operation in 2023, as the last three years had been weak, I thought BJ’s choice in deleveraging was prudent.
Think about the risk/return, if the company maintained the 2021 margin, with the 2023 turnover and leveraged like 2020, the result would be a profitability of -1.48%. Note that I used the 2021 margin precisely because I think a possible repetition of the 2021 margin is more credible than the 2020 margin, for obvious reasons.
Valuation
For the discounted cash flow model, I used a WACC of 7.5% and a free cash flow growth of 13.35%. I considered here the upside potential resulting from the company’s appeal to reverse the poor performance of recent years, mainly due to the appeal of activists and the repeated statements by BJ’s managers about the need to increase their margins. For the year 2024, analysts estimate that the company will generate free cash flow of approximately $27.6 million.
Author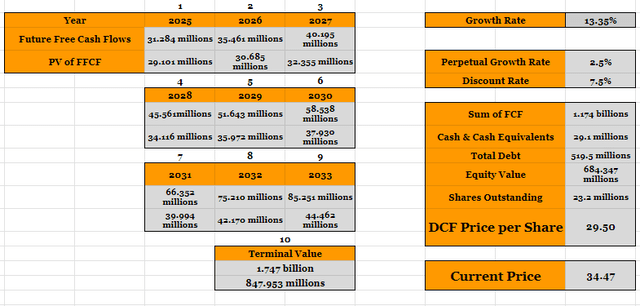
Risks
Competition
In all my analyses of companies operating in the casual dining sector, I always reiterate that the main risk (other than the structural risk based on financial strength) is competition. In a market with so many players and such price-sensitive demand, a restaurant that does not offer any competitive advantage that consumers can perceive will be doomed to bankruptcy.
As I have already discussed the marketing aspects that affect BJ’s value proposition, I don’t think it’s worth repeating them. However, even having properly established its PoDs in its value proposition, the company still competes with a huge variety of fast-food chains, other restaurants that offer casual meals, supermarkets and bakeries that offer meals and local establishments.
High dependence on California economic conditions
Even though BJ’s maintains a geographically diversified portfolio, with 216 restaurants in 30 different states, BJ’s still has a concentration of around 27% of its restaurants in the state of California. Therefore, social, climate and political impacts arising from this state and affecting BJ’s can have a direct impact on its results.
In addition to geographic concentration, BJ’s has a certain dominance of the casual dining market in California, with notable intensive market penetration and brand presence, which are not as strong outside of California. Despite being a risk of geographic concentration, this may also indicate a defensive position of regional domination and a niche market in some situations.
Cost pressures and inability to increase the average check per customer
BJ’s costs are intrinsically linked to the prices of agricultural commodities and wage inflation. That said, in order not to further compress its margins, BJ’s will need to make its customers aware of its value proposition, in order to retain a loyal and engaged customer base.
As we saw previously, the 5% increase in the average check value per person is a sign that there is a perception of the value proposition on the part of customers, and they are willing to pay more to consume at BJ’s.
Escalation of interest rates
In addition to the macroeconomic effect of containing aggregate demand and applying contractionary effects in a “no landing” scenario, the interest rate increase would increase interest expense, since of BJ’s revolving loan of $215 million, about $68 million is remunerated based on a floating rate.
This is the short-term line of credit that I mentioned when I explained the net working capital that the company has. It uses it both for immobilizations and to repurchase common shares. A possible increase in the interest rate of 1% would impact net profit by $0.5 million dollars.
Conclusion
As we can see through quantitative analysis, BJ’s does not have a very brilliant track record in terms of profitability and generating value for shareholders. It turns out that the qualitative aspects make me believe that a small increase in margin generated by the agreement with PW Partners will increase (a lot) the company’s value generation.
Precisely because BJ’s has presented mediocre results in recent years, I believe that the company will be able to “turn the key” and achieve growth typical of leading companies in the sector.
Credit: Source link