
• bitcoinBitcoin(BTC)$79,334.00-0.58%
  • ethereumEthereum(ETH)$2,495.330.21%
  • tetherTether(USDT)$1.00-0.01%
  • binancecoinBNB(BNB)$741.72-0.95%
  • rippleXRP(XRP)$1.40-0.64%
  • usd-coinUSDC(USDC)$1.000.00%
  • solanaSolana(SOL)$104.33-1.10%
  • tronTRON(TRX)$0.334514-0.17%
  • Figure HelocFigure Heloc(FIGR_HELOC)$1.060.00%
  • zcashZcash(ZEC)$1,164.94-4.17%
  • HyperliquidHyperliquid(HYPE)$85.44-2.13%
  • dogecoinDogecoin(DOGE)$0.0903270.94%
  • RainRain(RAIN)$0.016314-2.66%
  • USDSUSDS(USDS)$1.000.00%
  • moneroMonero(XMR)$522.46-0.43%
  • chainlinkChainlink(LINK)$12.813.81%
  • whitebitWhiteBIT Coin(WBT)$76.744.38%
  • leo-tokenLEO Token(LEO)$9.22-1.20%
  • cardanoCardano(ADA)$0.2209241.04%
  • stellarStellar(XLM)$0.1927004.98%
  • bitcoin-cashBitcoin Cash(BCH)$262.122.31%
  • daiDai(DAI)$1.000.01%
  • Ethena USDeEthena USDe(USDE)$1.00-0.01%
  • uniswapUniswap(UNI)$6.92-3.04%
  • litecoinLitecoin(LTC)$55.182.27%
  • USD1USD1(USD1)$1.000.01%
  • CantonCanton(CC)$0.105596-3.69%
  • the-open-networkGram (prev. Toncoin)(GRAM)$1.40-1.12%
  • hedera-hashgraphHedera(HBAR)$0.0827512.87%
  • avalanche-2Avalanche(AVAX)$8.146.45%
  • suiSui(SUI)$0.834.21%
  • Global DollarGlobal Dollar(USDG)$1.000.00%
  • shiba-inuShiba Inu(SHIB)$0.0000050.78%
  • nearNEAR Protocol(NEAR)$2.32-4.73%
  • paypal-usdPayPal USD(PYUSD)$1.000.00%
  • BlackRock USD Institutional Digital Liquidity FundBlackRock USD Institutional Digital Liquidity Fund(BUIDL)$1.000.00%
  • crypto-com-chainCronos(CRO)$0.057253-0.21%
  • tether-goldTether Gold(XAUT)$4,408.22-0.17%
  • Circle USYCCircle USYC(USYC)$1.140.00%
  • MemeCoreMemeCore(M)$1.152.36%
  • BittensorBittensor(TAO)$258.91-2.18%
  • Ripple USDRipple USD(RLUSD)$1.00-0.01%
  • okbOKB(OKB)$114.891.57%
  • Ondo US Dollar YieldOndo US Dollar Yield(USDY)$1.150.01%
  • AsterAster(ASTER)$0.770.27%
  • mantleMantle(MNT)$0.624.46%
  • aaveAave(AAVE)$132.45-0.18%
  • pax-goldPAX Gold(PAXG)$4,409.66-0.22%
  • OndoOndo(ONDO)$0.3869222.59%
  • polkadotPolkadot(DOT)$1.0813.07%
TradePoint.io
  • Main
  • AI & Technology
  • Stock Charts
  • Market & News
  • Business
  • Finance Tips
  • Trade Tube
  • Blog
  • Shop
No Result
View All Result
TradePoint.io
No Result
View All Result

TAN: Time To Dip Your Toes, But Technical Risks Still In Play

September 22, 2023
in Market & News
Reading Time: 5 mins read
A A
TAN: Time To Dip Your Toes, But Technical Risks Still In Play
ShareShareShareShareShare

ArtistGNDphotography

YOU MAY ALSO LIKE

Fires burn after deadly Russian bomb attack on Ukraine

Videos show man firing AR-15 at Las Vegas homes

While the Nasdaq Composite is up impressively in 2023, so many non-mega-cap tech stocks are flat to even sharply lower on the year. One of the toughest places to be overweight is the solar industry, which includes some semiconductor firms.

I am upgrading the Invesco Solar ETF (NYSEARCA:TAN) from a sell to a hold based on a better valuation and the chance of some modest technical buying, though tax-loss selling risks come about during this part of the calendar. TAN is down more than 25% in 2023, sharply losing out to the Energy sector and semiconductor ETFs.

2023 ETF Performance Heat Map: TAN Underperforms Energy Funds

2023 ETF Performance Heat Map: TAN Underperforms Energy Funds

Finviz

For background, according to the issuer, TAN invests in global developed market equities, focusing on companies in renewable energy sectors, excluding coal, petroleum, and nuclear energy. The fund invests in growth and value stocks and promotes environmental responsibility. It generally allocates over 90% of its assets to index-related securities, calculated and administered by MAC Indexing LLC. The index TAN tracks is comprised of companies in the solar energy industry.

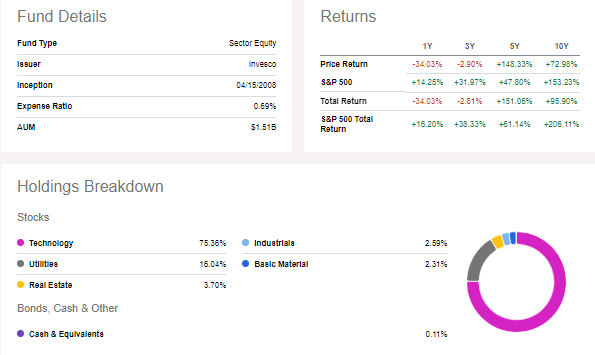
TAN is a large ETF with more than $1.5 billion in assets under management, though it does not pay a dividend, per Seeking Alpha, but Invesco lists the payout rate at 0.31%. With a somewhat high 0.69% annual expense ratio, it has a weak expense score and a concentrated portfolio. Momentum is also bleak with TAN – I will highlight how the recent downtrend has played out as technicians would have expected. On the bright side, liquidity is robust as TAN has an average daily volume of more than 700,000 shares with a 30-day median bid/ask spread of just seven basis points.

One thing I found intriguing after shares have lost about a quarter of their value since early May is the valuation. Invesco lists the current price-to-earnings ratio at just 14.9. On a forward basis, the P/E is likewise cheap at 14.6. With a price-to-book ratio of just 2.0, it is not expensive (though I acknowledged that the portfolio looked like a value back in February too). Moreover, those figures were as of June 30 – back when the fund’s market price was much higher. Morningstar shows a current price-to-book ratio of just 1.2 – well under the S&P 500’s average.

Still, it is a risky play given that the average market cap size is under $9 billion, and the 48-holding portfolio has a high 63% of assets in the top 10 positions and 21% exposure to China (tariffs have recently been placed on some Chinese solar companies). Finally, most of the exposure is to the Information Technology sector, as shown below.

TAN: Fund Details & Holdings Breakdown

TAN: Fund Details & Holdings Breakdown

Seeking Alpha
TAN: A Concentrated Allocation

TAN: A Concentrated Allocation

Morningstar

Seasonally, TAN tends to trade sideways from late September through mid-December, according to data from Equity Clock. With severe underperformance so far in 2023, it is conceivable that tax-loss selling could result in further volatility as mutual funds close up their books in the next several days and then as the retail crowd considers their individual situations in December.

TAN: Neutral Seasonal Trends, But Tax-Loss Selling A Risk

TAN: Neutral Seasonal Trends, But Tax-Loss Selling A Risk

Equity Clock

The Technical Take

Back in the second quarter, I outlined a possible way to play TAN’s underperformance. To be clear, I was bearish on the fund, but I offered some hope for the bulls. I viewed the mid-$50s as support, and that’s where the ETF trades today. Still, TAN went on to notch fresh lows not seen since September 2020, so the $55 to $56 area has been penetrated. I see the next possible support at the February 2020 pre-Covid peak, just shy of $42.

On the upside, notice in the chart below on the left-hand side of the graph that there’s high volume by price from the upper $50s to near $90 – that’s tough slogging for the bulls on any rallies as investors who currently hold capital losses may look to sell to get back to even. Moreover, the RSI momentum indicator at the top of the 5-year zoom shows momentum stuck in the bearish 20 to 60 range – I would like to see that break before getting overly optimistic on TAN. Finally, with a declining long-term 200-day moving average and a downtrend resistance line off the late 2021 peak, there’s further evidence of an established downtrend after the fund consolidated in a symmetrical triangle that saw the apex break to the bearish side this past summer.

Overall, shares hang near critical support but further settling under $55 poses risks.

TAN: Solar Stocks Plunge To Possible Mid-$50s Support

TAN: Solar Stocks Plunge To Possible Mid-$50s Support

StockCharts.com

The Bottom Line

I am upgrading TAN from a sell to a hold. The portfolio is a better value today and the technical situation, while not favorable, could see some buyers step up.

Credit: Source link

ShareTweetSendSharePin

Related Posts

Fires burn after deadly Russian bomb attack on Ukraine
Market & News

Fires burn after deadly Russian bomb attack on Ukraine

September 7, 2026
Videos show man firing AR-15 at Las Vegas homes
Market & News

Videos show man firing AR-15 at Las Vegas homes

September 7, 2026
Tropical Storm Bertha threatens Southeast U.S.
Market & News

Tropical Storm Bertha threatens Southeast U.S.

September 7, 2026
Australian mother welcomes identical quadruplet girls
Market & News

Australian mother welcomes identical quadruplet girls

September 7, 2026
Next Post
Goods, Home prices Extend Stock Rally

Goods, Home prices Extend Stock Rally

Leave a Reply Cancel reply

Your email address will not be published. Required fields are marked *

Search

No Result
View All Result
AI Boom Fuels a New Tech Debt Binge

AI Boom Fuels a New Tech Debt Binge

September 3, 2026
German leaders on manhunt for suspect in Berlin Pride attack

German leaders on manhunt for suspect in Berlin Pride attack

September 4, 2026
Stay Tuned NOW Streaming Behind The Scenes! – Jul 23

Stay Tuned NOW Streaming Behind The Scenes! – Jul 23

September 6, 2026

About

Learn more

Our Services

Legal

Privacy Policy

Terms of Use

Bloggers

Learn more

Article Links

Contact

Advertise

Ask us anything

©2020- TradePoint.io - All rights reserved!

Tradepoint.io, being just a publishing and technology platform, is not a registered broker-dealer or investment adviser. So we do not provide investment advice. Rather, brokerage services are provided to clients of Tradepoint.io by independent SEC-registered broker-dealers and members of FINRA/SIPC. Every form of investing carries some risk and past performance is not a guarantee of future results. “Tradepoint.io“, “Instant Investing” and “My Trading Tools” are registered trademarks of Apperbuild, LLC.

This website is operated by Apperbuild, LLC. We have no link to any brokerage firm and we do not provide investment advice. Every information and resource we provide is solely for the education of our readers. © 2020 Apperbuild, LLC. All rights reserved.

No Result
View All Result
  • Main
  • AI & Technology
  • Stock Charts
  • Market & News
  • Business
  • Finance Tips
  • Trade Tube
  • Blog
  • Shop

© 2023 - TradePoint.io - All Rights Reserved!