
pablorebo1984/iStock Editorial via Getty Images
Synopsis
XPO, Inc (NYSE:XPO) specialises in providing freight transportation services. XPO’s historical financial results have reported consistent revenue growth. However, 2023’s growth was modest due to the soft freight transportation environment. In terms of profit margins, they expanded year-over-year. For 1Q24, XPO continues to report revenue growth while margins remain robust year-over-year. XPO’s commitment to investing in network capacity and its strong market positioning are expected to support its outlook. Additionally, XPO also focuses on providing high service quality, which has resulted in decreasing damage claims and a higher yield. Overall, I am recommending a buy rating for XPO.
Historical Financial Analysis
Author’s Chart Author’s Chart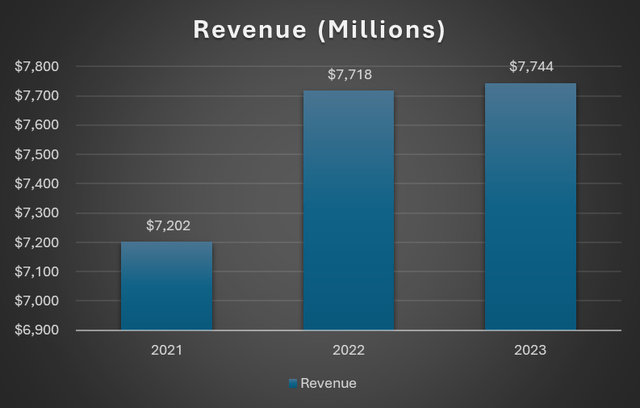
For FY2021, XPO reported revenue of approximately $7.202 billion. Revenue grew to $7.718 billion for FY2022, which represents a year-over-year increase of 7.2%. This revenue growth was driven by growth in XPO’s Less-Than-Truckload [LTL] segment. For FY2022, XPO’s North American LTL segment grew 12.6% to approximately $4.6 billion.
For FY2023, although revenue continued to grow, it was modest. Revenue year-over-year growth was modest at 0.3%. Even though gross revenue per hundredweight grew 4.9%, volume was flat year-over-year due to the soft freight transportation environment in the first half of 2023.
However, volume started to pick up momentum in the second half of 2023, driven by XPO’s service quality improvements and capacity investment. Additionally, the ceasing of operations by one of XPO’s competitors in the third quarter of the year also contributed to the volume growth seen in the second half of the year. The competitor is Yellow Corporation, and its exit caused disruption to the industry as it is considered a major competitor. Yellow Corporation’s freight was diverted to other larger LTL companies, which included XPO.
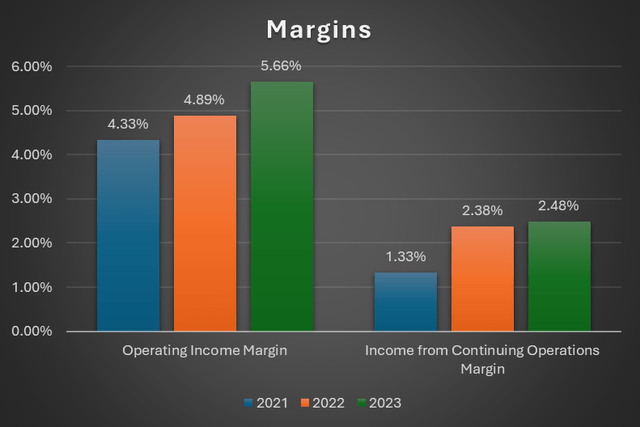
Moving onto margins, both its operating income margin and income from continuing operations margin have shown positive movement. In FY2021, XPO’s operating income margin was 4.33%, and it expanded to 4.89% in FY2022. For FY2023, it has expanded yet again to 5.66%. The drivers behind the operating income margin expansion are improvements to purchased transportation cost. Additionally, XPO’s income from continuing operations margin expanded from 1.33% in FY2021 to 2.48% in FY2023.
First Quarter 2024 Earnings Analysis
For 1Q24, XPO’s total revenue increased 5.8% to approximately $2.018 billion from the previous period’s $1.907 billion. The revenue growth was driven by higher yield and tonnage per day in its North American LTL segment. However, these benefits were partially offset by lower fuel surcharge income.
XPO’s revenue can be broken down into North American LTL and European transportation segments. North American LTL grew 9% year-over-year, while European transportation segments increased 1.3%. For its North American LTL segment, its pounds per day increased by 2.6%, shipments per day were up by 4.7%, and gross revenue per hundredweight increased by 9.8%. However, the average weight per shipment contracted slightly by 1.9%. These statistics suggest that XPO’s North American LTL segment performed well for the quarter.
Regarding profitability margins, both its adjusted EBITDA margin and adjusted net income from continuing operations margin expanded year-over-year. XPO’s adjusted EBITDA margin expanded from 11.01% to 14.27%. The expansion was driven by adjusted EBITDA growth in both its operating segments. The North American LTL segment’s adjusted EBITDA increased by 40.1%, while its European transportation segment increased by 2.7%. Moving on, its adjusted net income from continuing operations margin expanded from 3.41% to 4.81%. Overall, XPO’s 1Q24 margins performed well when compared with the previous period.
Author’s Chart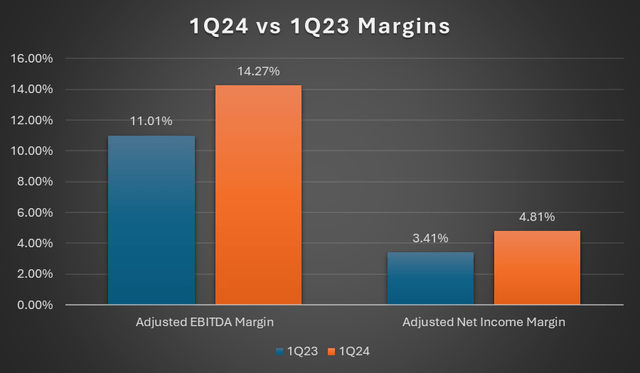
Strong Market Positioning and Reach in North America LTL Market
The North American LTL industry’s market size is estimated to be in the ballpark of $52 billion. More importantly, this industry is considered to be a foundational and crucial part of the US economy. For context, 75% of market share in the North American LTL industry is held by the top ten LTL companies. Additionally, this industry has the added advantage of benefiting from demand strength spanning across various sectors.
For FY2023, XPO’s North American LTL segment reported revenue was approximately $4.7 billion, which translates to approximately 9% of total market share. By revenue, XPO is the third-largest LTL carrier in North America. Therefore, these statistics indicate that XPO is a major player in the North American LTL industry.
10-K
To give you a better understanding of XPO’s scale and reach in the North American market, XPO’s current network covers 99% of US zip codes. It has 293 service centres, with an additional 28 service centres acquired.
Investors Relations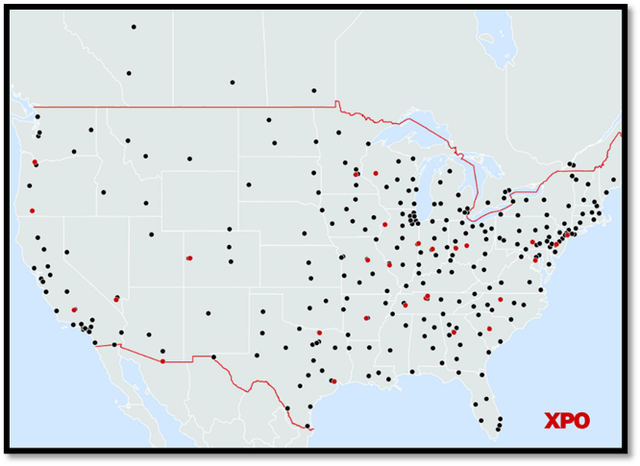
Investing in the Expansion of Network Capacity
Investors Relations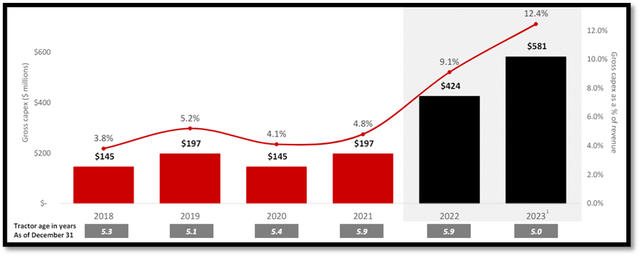
Currently, one of the strategic initiatives XPO’s management is emphasising is the investment in expanding its network capacity. XPO is expanding its linehaul fleets with tractors that have better fuel efficiency, expanding its in-house trailer manufacturing, and also adding new doors in markets facing capacity constraints. Since late 2021, XPO has increased its trailer counts by more than 11,000 units, with 6,400 in 2023. More than 2,400 tractors were added as well, while new doors increased by 551.
Looking at the chart, it is clear that the average age of tractors has seen improvements in 2023, as the average age fell to five years vs. 5.9 in 2022 and 2021. This average age is also the lowest since 2018. These investments, when combined, allow XPO to transport more freight and also maintain strong network fluidity. Apart from these benefits, they also improve XPO’s overall service quality.
Focus on Being a Premium Service Organisation
Investors Relations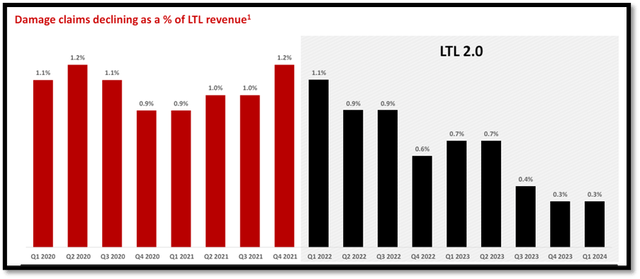
Through investment in training programmes, advanced equipment, and the implementation of technology that enhances efficiency and accuracy, XPO was able to achieve significant improvements to its service quality.
Looking at the chart, damage claims as a percentage of revenue before 2022 were hovering between 0.9% and 1.2%. Ever since the start of 2022, the damage claim percentage has been consistently decreasing. In 1Q22, it was 1.1%, but by 1Q24, it had dropped significantly to just 0.3%, showing strong improvements. By doing so, it shows XPO’s determination to ensure that it builds and holds the brand image of being a premium service organisation.
With approximately 33,000 customers ranging from local to blue-chip companies and an average tenure of 16 years with its top ten customers, XPO’s focus and commitment to service quality are the right strategic decisions. This will not only allow XPO to retain its existing customers but also attract new ones and continue to expand its current large clientele base.
Investors Relations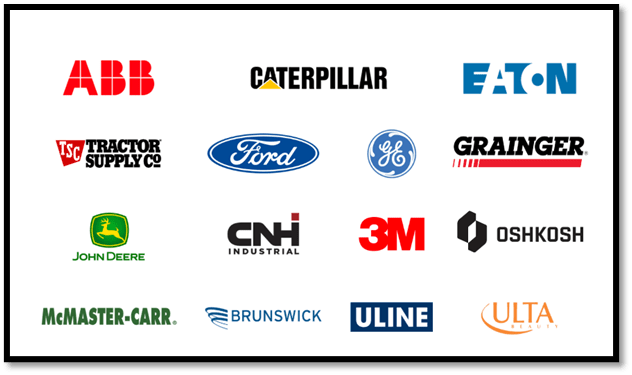
Benefits of Service Excellence
Investors Relations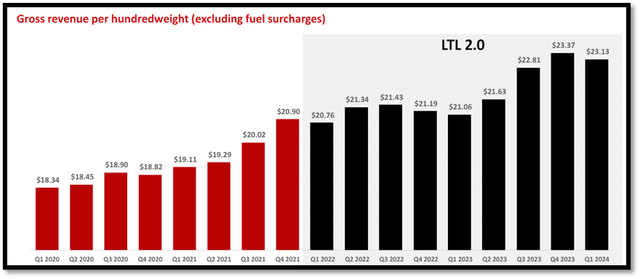
As a result of its focus and commitment to service quality, it was able to drive growth in its gross revenue per hundredweight. In 1Q20, gross revenue per hundredweight was $18.34. Ever since then, it has been consistently growing. By 1Q24, the gross revenue per hundredweight had increased to $23.13, which represents an improvement of approximately 26%. Looking ahead, I anticipate XPO’s commitment to premium service quality, proven by the contracting damage claim percentage, will bolster its growth outlook.
Relative Valuation Model
Author’s Relative Valuation Model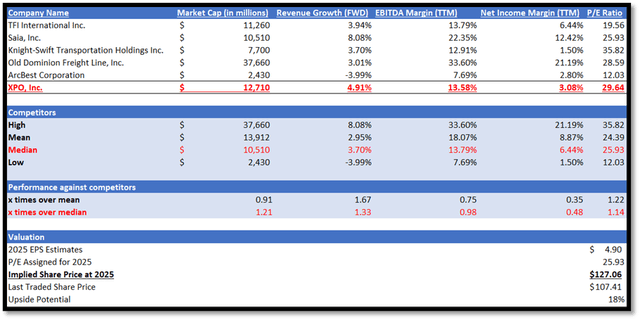
XPO operates in the cargo ground transportation industry. As a recap, XPO is a leading provider of freight transportation services. I will be comparing XPO against its peers in terms of growth outlook and profitability margins.
Regarding growth outlook, XPO outperformed its peers as it has a forward revenue growth rate of 4.91% vs. peers’ median of 3.70%, representing 1.33x over its peers’ median. In terms of profitability margins, results were mixed, as XPO’s EBITDA margin TTM performed in line but underperformed in terms of net income margin TTM. XPO’s EBITDA margin TTM is 13.58%, close to peers’ median of 13.79%. However, XPO’s net income margin TTM of 3.08% is lower than peers’ median of 6.44%.
Currently, XPO’s forward P/E ratio is 29.64x, higher than peers’ median of 25.93x. Given XPO’s mixed performance against its peers, I argue that XPO’s forward P/E should be trading in line with its peers’ median. Therefore, I will adjust my 2025 target P/E down towards its peers’ median.
For 2024, the market revenue estimate for XPO is approximately $8.25 billion, while the EPS is $3.69 per share. For 2025, the market revenue estimate is $8.91 billion, while the EPS is $4.90 per share. Based on my discussion on XPO’s growth catalyst, these estimates are justified as they share the same positive expectations. Therefore, by applying my 2025 target P/E to XPO’s 2025 EPS estimate, my target share price is $127.06.
Risk
In 2024, the overall freight environment remains recessionary, largely due to supply and demand imbalances. During the COVID pandemic, there was a surge of carriers entering the market as they aimed to capitalise on the strong demand for freight movement. Although courier counts have been decreasing over the last few years, challenges to achieving a balance between supply and demand still persist, as retraction is happening much slower than in a normal cycle. The reason behind this is due to the profits made by these carries when spot rates surged, and these profits allowed them to stay longer in the market.
Conclusion
Although XPO’s revenue has been consistently growing, growth in 2023 was modest due to a soft freight transportation environment affecting demand. However, despite that, both of its profit margins expanded annually. For its 1Q24 result, its revenue grew 5.8%, driven by higher yield and tonnage per day in its North American LTL segment. In addition, its profit margins remained robust year-over-year.
XPO has a strong market position in the North American LTL market. Therefore, its commitment to investing in its network capacity for the long term and its focus on being a premium service provider are anticipated to support and strengthen its growth outlook. On these notes, I am recommending a buy rating for XPO.
Credit: Source link