
DNY59
The Utilities Select Sector SPDR ETF (NYSEARCA:XLU) is a high-quality ETF administered by State Street Global Advisors. XLU is benchmarked against the Utilities Select Sector Index, incepted in December 1998, providing investors an opportunity to invest in a well-diversified utilities-focused ETF.
XLU provides investors exposure to several themes within the sector. These include “electric utility, water utility, multi-utility, independent power, renewable electricity producers, and gas utility industries.” As a result, it’s intended for investors considering a “targeted investing” approach, as attractive opportunities present themselves from time to time.
Utilities plays are usually well-insulated against the recessionary forces. As a result, investors typically consider XLU as a defensive setup bolstered by the earnings visibility in its top holdings. XLU also boasts a relatively attractive dividend yield compared to the S&P 500 (SPX) (SPY). Accordingly, XLU last traded at a trailing twelve months or TTM dividend yield of 3.34%, well above SPY’s TTM dividend yield of 1.42%. Seeking Alpha Quant assigned an “A+” dividend grade to XLU, corroborating the strength of XLU as a core holding for income investors looking to invest in a well-diversified utilities portfolio.
As a growth investor, given its long-term underperformance to SPY, I’m less interested in adding XLU to my portfolio. XLU delivered a total return of 136% over the past ten years, well below SPY’s 209% gain over the same period. As a result, I’m only keen if I assess a significant opportunity resulting from a dislocation in the market, leading to massive pessimism. I believe such an opportunity arrived as XLU bottomed out in October 2023.
As a result, I added XLU to my portfolio in mid-October 2023, anticipating the worst was likely to be over. Bearish investors must be wondering whether I’m being delusional, adding XLU in mid-October when the 10Y yield (US10Y) broke the 5% mark in the same month (it has since dropped to 4.18%). XLU has gained nearly 17% in price-performance terms from its October lows through this week’s highs. Is the market wrong? Is the market crazy? Isn’t the Fed supposed to be higher for longer in mid-October? Didn’t the Fed say it would remain cautious about cutting interest rates, even though we have seen a continued normalization in inflation rates?
Always remember that the market is forward-looking. The market has intensified their bets of more rate cuts than previously anticipated. As a result, I believe it could explain why XLU bottomed out in October and even outperformed SPY from its October lows. By the time you read about the market’s anticipation of rate cuts in the news media, you would have missed out on buying at the most attractive risk/reward entry levels presented in XLU. Therefore, while there isn’t any doubt that XLU was battered by the surge in long-term rates over the past year, I assessed it has reached significant pessimism.
My thesis is also supported by the relative valuation levels in XLU’s leading constituent stocks.
| XLU Top 10 Holdings | Weight |
|---|---|
| 1. NextEra Energy Inc (NEE) | 13.07% |
| 2. Southern Co (SO) | 8.46% |
| 3. Duke Energy Corp (DUK) | 7.77% |
| 4. Sempra (SRE) | 4.93% |
| 5. American Electric Power Co Inc (AEP) | 4.44% |
| 6. Dominion Energy Inc (D) | 4.24% |
| 7. Exelon Corp (EXC) | 4.21% |
| 8. Constellation Energy Corp (CEG) | 3.89% |
| 9. PG&E Corp (PCG) | 3.87% |
| 10. Xcel Energy Inc (XEL) | 3.67% |
XLU top ten holdings. Data source: Seeking Alpha
The top ten holdings in XLU comprise nearly 60% of the fund’s weighting. As a result, paying close attention to their relative performances could be telling. XLU last traded at a forward normalized P/E of 15.5x, well below the sector’s 10Y average of 21.2x.
XLU top ten holdings valuation (1/2) (TIKR) XLU top ten holdings valuation (2/2) (TIKR)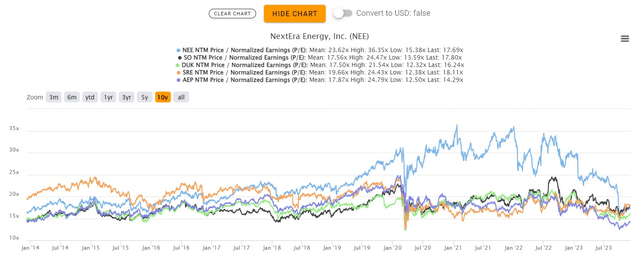
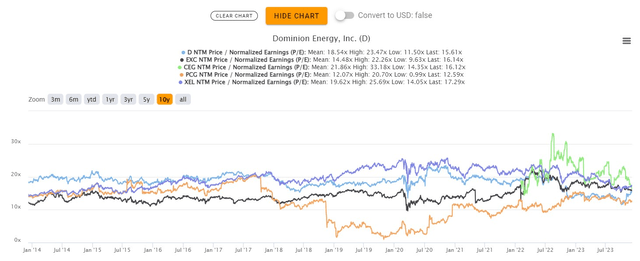
As seen above, seven out of the top ten holdings last traded below their 10Y normalized P/E averages, suggesting relative undervaluation. Morningstar’s valuation estimates suggest the utilities sector remains 9% below its fair valuation, corroborating my thesis.
Bolstered by less intense interest rate headwinds that affected XLU since it topped out in September 2022, I believe the mean-reversion thesis to close the relative underperformance gap against SPY is overdue.
XLU/SPY price chart (monthly) (TradingView)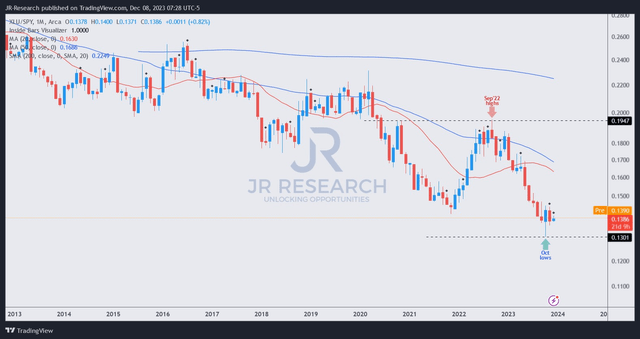
As seen above, XLU has consolidated against SPY since it bottomed out in October 2023 and even outperformed from its lows. However, the surge in SPY has also led to increased risk-on moves as investors rotated aggressively into risk-on plays.
However, I assessed the bear trap or false downside breakdown (see price action glossary) in XLU/SPY was validated in October. As a result, investors who missed adding XLU’s recent lows should consider capitalizing on its consolidation before investors rotate out of risk-on sectors back into defensive ones, taking profits as tech stocks surge.
Please don’t wait until the coast is clear before putting capital to work in battered sector ETFs like XLU, as the risk/reward might no longer be so attractive at that point.
Rating: Initiate Buy.
Important note: Investors are reminded to do their due diligence and not rely on the information provided as financial advice. Please always apply independent thinking and note that the rating is not intended to time a specific entry/exit at the point of writing unless otherwise specified.
We Want To Hear From You
Have constructive commentary to improve our thesis? Spotted a critical gap in our view? Saw something important that we didn’t? Agree or disagree? Comment below with the aim of helping everyone in the community to learn better!
Credit: Source link