

su tim
This monthly article series reports aggregate industry metrics in materials. It is also a top-down analysis of sector ETFs like the Materials Select Sector SPDR Fund ETF (NYSEARCA:XLB), whose largest holdings are used to calculate these metrics.
Shortcut
The next two paragraphs in italic describe the dashboard methodology. They are necessary for new readers to understand the metrics. If you are used to this series or if you are short of time, you can skip them and go to the charts.
Base Metrics
I calculate the median value of five fundamental ratios for each industry: Earnings Yield (“EY”), Sales Yield (“SY”), Free Cash Flow Yield (“FY”), Return on Equity (“ROE”), Gross Margin (“GM”). The reference universe includes large companies in the U.S. stock market. The five base metrics are calculated on trailing 12 months. For all of them, higher is better. EY, SY and FY are medians of the inverse of Price/Earnings, Price/Sales and Price/Free Cash Flow. They are better for statistical studies than price-to-something ratios, which are unusable or non available when the “something” is close to zero or negative (for example, companies with negative earnings). I also look at two momentum metrics for each group: the median monthly return (RetM) and the median annual return (RetY).
I prefer medians to averages because a median splits a set in a good half and a bad half. A capital-weighted average is skewed by extreme values and the largest companies. My metrics are designed for stock-picking rather than index investing.
Value and Quality Scores
I calculate historical baselines for all metrics. They are noted respectively EYh, SYh, FYh, ROEh, GMh, and they are calculated as the averages on a look-back period of 11 years. For example, the value of EYh for packaging in the table below is the 11-year average of the median Earnings Yield in packaging companies.
The Value Score (“VS”) is defined as the average difference in % between the three valuation ratios (EY, SY, FY) and their baselines (EYh, SYh, FYh). The same way, the Quality Score (“QS”) is the average difference between the two quality ratios (ROE, GM) and their baselines (ROEh, GMh).
The scores are in percentage points. VS may be interpreted as the percentage of undervaluation or overvaluation relative to the baseline (positive is good, negative is bad). This interpretation must be taken with caution: the baseline is an arbitrary reference, not a supposed fair value. The formula assumes that the three valuation metrics are of equal importance.
Current data
The next table shows the metrics and scores as of writing. Columns stand for all the data defined above.
|
VS |
QS |
EY |
SY |
FY |
ROE |
GM |
EYh |
SYh |
FYh |
ROEh |
GMh |
RetM |
RetY |
|
|
Chemicals |
-12.98 |
-5.05 |
0.0294 |
0.4688 |
0.0173 |
16.22 |
41.95 |
0.0423 |
0.4481 |
0.0199 |
17.85 |
42.38 |
7.10% |
12.24% |
|
Constr. Materials |
-3.87 |
39.69 |
0.0452 |
0.6018 |
0.0390 |
21.25 |
36.29 |
0.0406 |
0.7972 |
0.0384 |
13.43 |
29.98 |
3.43% |
39.92% |
|
Packaging |
-13.20 |
-2.06 |
0.0429 |
1.1095 |
0.0240 |
16.88 |
26.29 |
0.0491 |
1.0412 |
0.0361 |
18.43 |
25.20 |
7.79% |
10.18% |
|
Mining/Metals |
5.21 |
4.20 |
0.0433 |
0.8537 |
0.0347 |
9.25 |
23.32 |
0.0420 |
1.1578 |
0.0250 |
9.41 |
21.19 |
8.24% |
24.55% |
Value and Quality chart
The next chart plots the Value and Quality Scores by industry (higher is better).
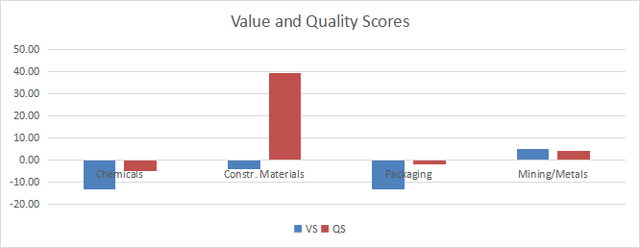
Value and quality in basic materials (Chart: author; data: Portfolio123)
Evolution since last month
The value score has improved in mining/metals and deteriorated in other industries.
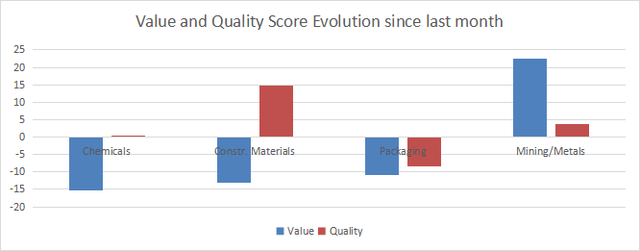
Variation in value and quality (Chart: author; data: Portfolio123)
Momentum
The next chart plots median returns in subsectors.
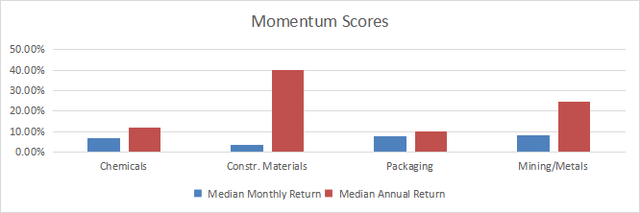
Momentum in basic materials (Chart: author; data: Portfolio123)
Interpretation
The materials sector was close to its 11-year averages in valuation and quality metrics at the beginning of May, as reported in my S&P 500 monthly dashboard. The mining/metals subsector has both value and quality scores slightly above the historical baseline. The construction materials industry is marginally overvalued, but shows an excellent quality score. Packaging and chemicals are moderately overvalued and close to the quality baseline.
About XLB
The Materials Select Sector SPDR Fund started investing operations on 12/16/1998 and tracks the Materials Select Sector Index, which is capital-weighted. It has 28 holdings, a total expense ratio of 0.09% and a 30-day SEC yield of 1.75%. The fund is overweight in the chemicals industry, which represents 65.3% of asset value.
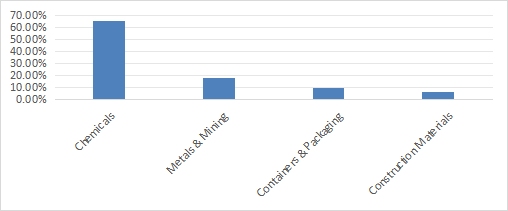
XLB industry breakdown (Chart: author; data: SSGA)
The next table lists the top 10 holdings with fundamental ratios and dividend yields. The portfolio is very concentrated: they represent 66.3% of asset value and the heaviest position weighs 20.3% (Linde Plc).
|
Ticker |
Name |
Weight% |
EPS growth %TTM |
P/E TTM |
P/E fwd |
Yield% |
|
LIN |
Linde plc |
20.26 |
43.18 |
33.56 |
27.98 |
1.29 |
|
FCX |
Freeport-McMoRan, Inc. |
7.26 |
-36.46 |
47.67 |
34.42 |
1.11 |
|
SHW |
The Sherwin-Williams Co. |
7.19 |
14.98 |
33.33 |
27.37 |
0.92 |
|
ECL |
Ecolab, Inc. |
5.74 |
34.09 |
43.25 |
35.44 |
0.98 |
|
APD |
Air Products and Chemicals, Inc. |
5.56 |
13.66 |
23.77 |
21.42 |
2.70 |
|
NEM |
Newmont Corp. |
4.80 |
-304.13 |
N/A |
18.20 |
2.29 |
|
NUE |
Nucor Corp. |
4.15 |
-33.39 |
10.13 |
12.99 |
1.25 |
|
DOW |
Dow, Inc. |
4.01 |
-58.10 |
35.30 |
19.67 |
4.73 |
|
CTVA |
Corteva, Inc. |
3.82 |
-51.79 |
71.99 |
19.98 |
1.13 |
|
MLM |
Martin Marietta Materials, Inc. |
3.50 |
118.40 |
17.17 |
25.08 |
0.51 |
Ratios: Portfolio123
Since 1/1/2000, XLB has outperformed the S&P 500 Index (SP500). However, the difference in annualized return is hardly significant: only 27 bps. Volatility is quite high, resulting in an inferior risk-adjusted performance (Sharpe ratio in the next table).
|
Total return |
Annualized return |
Max Drawdown |
Sharpe ratio |
Volatility |
|
|
XLB |
501.58% |
7.64% |
-59.83% |
0.39 |
20.64% |
|
S&P 500 |
465.74% |
7.37% |
-55.19% |
0.43 |
15.40% |
Over the last 12 months, XLB has lagged the broad index by about 7% in total return:
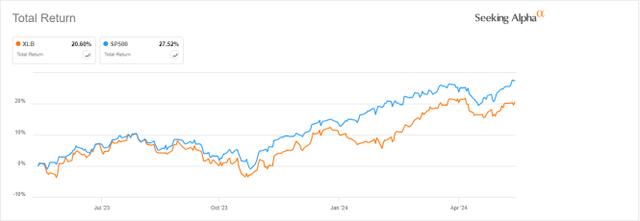
XLB vs S&P 500, 12-month total return (Seeking Alpha)
In summary, XLB provides capital-weighted exposure to the materials sector. It is heavily overweight in chemical companies and in its top holdings. Investors who are concerned by risks related to this concentration may prefer the Invesco S&P 500 Equal Weight Materials ETF (RSPM).
Dashboard List
I use the first table to calculate value and quality scores. It may also be used in a stock-picking process to check how companies stand among their peers. For example, the EY column tells us that a mining company with an Earnings Yield above 0.0433 (or price/earnings below 23.09) is in the better half of the industry regarding this metric. A Dashboard List is sent every month to subscribers with the most profitable companies standing in the better half among their peers regarding the three valuation metrics at the same time. The stocks below are part of the list sent to subscribers a few weeks ago.
|
CE |
Celanese Corp. |
|
BLDR |
Builders FirstSource, Inc. |
It is a rotational model with a statistical bias toward excess returns on the long-term, not the result of an analysis of each stock.
Credit: Source link