
Just_Super
This article series aims at evaluating ETFs (exchanged-traded funds) regarding the relative past performance of their strategies and quality metrics of their current portfolios. Holdings change over time and reviews are updated when necessary.
WTV strategy
WisdomTree U.S. Value Fund (NYSEARCA:WTV) is an actively managed fund with a strategy based on shareholder yield, a concept combining dividends, buybacks and debt reduction. It has 121 holdings, a distribution yield of 1.60% and a total expense ratio of 0.12%. Distributions are paid quarterly.
The fund started investing operations 02/23/2007, but it was reshuffled twice, in 2017 and in 2022. Until 12/18/2017, it was a value fund tracking the WisdomTree U.S. LargeCap Value Index. Then, it became WisdomTree U.S. Quality Shareholder Yield Fund, with the ticker QSY. It was rebranded in January 2022 with the current name and ticker. The new name is confusing, as the strategy has little to do with the valuation metrics used in other value funds. Anyway, changing names and tickers doesn’t impact the relevance of historical data. Therefore, I will take into account data from 12/18/2017, when the fund started executing a shareholder yield strategy.
As described by WisdomTree, WTV implements
a quantitative actively managed strategy that invests primarily in large- and mid-capitalization U.S. companies with high total shareholder yield and favorable quality characteristics, such as return on equity (ROE) and return on assets (ROA).
As an actively managed fund, WTV may have a flexible and adaptative strategy, but it also lacks the transparency of index-based ETFs. WisdomTree defines shareholder yield as “the combination of dividend yield and buyback yield”, which doesn’t correspond to the widely accepted definition of shareholder yield, including debt reduction. However, debt is taken into account in the strategy description.
The next chart shows that shareholder shield and quality metrics are combined in equal weight to create a composite score.
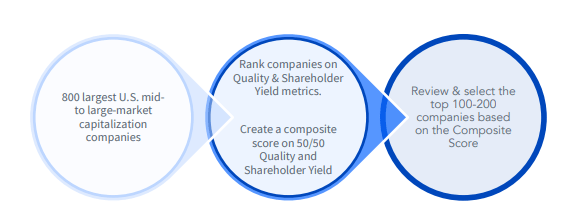
WTV methodology (WisdomTree)
The portfolio is reconstituted on an annual basis, but a more active approach may be taken depending on market opportunities.
WTV portfolio
The fund invests exclusively in U.S. companies, with a tilt to mid caps (about 54% of assets). The heaviest sectors in the portfolio are consumer discretionary (15.9% of asset value) and financials (15.2%). Compared to the S&P 500 (SPY), WTV massively underweights technology and consumer staples. It overweights mostly materials, consumer discretionary, energy and industrials. The fund is better diversified across sectors than the benchmark.
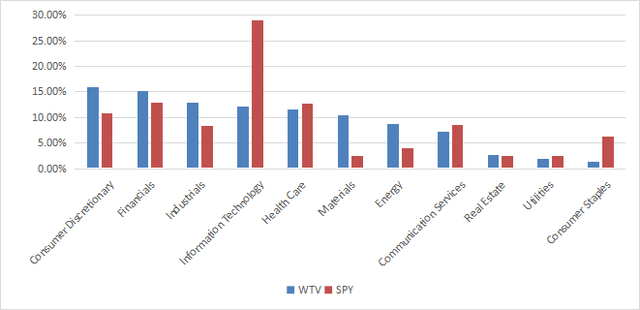
Sector breakdown (chart: author, data: WisdomTree, SSGA)
The top 10 holdings, listed in the next table, represent 16% of asset value. The heaviest position weighs 2.48%, so the fund is well-diversified and risks related to individual companies are low.
|
Ticker |
Name |
weight% |
EPS growth %ttm |
P/E ttm |
P/E fwd |
Yield% |
|
META |
Meta Platforms, Inc. |
2.48% |
7.92 |
29.37 |
23.17 |
0 |
|
CAH |
Cardinal Health, Inc. |
2.00% |
115.26 |
175.97 |
15.36 |
1.87 |
|
BLDR |
Builders FirstSource, Inc. |
1.97% |
-27.93 |
12.54 |
11.13 |
0 |
|
HCA |
HCA Healthcare, Inc. |
1.65% |
14.89 |
12.66 |
14.14 |
0.93 |
|
CVX |
Chevron Corp. |
1.47% |
-23.48 |
10.73 |
10.72 |
4.19 |
|
X |
United States Steel Corp. |
1.30% |
-62.06 |
7.88 |
8.49 |
0.56 |
|
MCK |
McKesson Corp. |
1.30% |
79.26 |
18.10 |
16.78 |
0.54 |
|
LH |
Laboratory Corp. of America Holdings |
1.30% |
-60.10 |
28.97 |
15.94 |
1.33 |
|
OC |
Owens Corning |
1.28% |
-4.58 |
11.05 |
10.30 |
1.67 |
|
NRG |
NRG Energy, Inc. |
1.27% |
-200.77 |
N/A |
8.32 |
3.16 |
Ratios from Portfolio123
Modelling shareholder yield
Price history is too short to assess the long-term potential of the strategy. I ran a simulation on the Portfolio123 platform to evaluate the performance of a ranking system based on shareholder yield on a longer period. I have used the following formula to define the shareholder yield factor:
(Dividend paid TTM + Equity Purchased TTM – Equity Issued TTM + Total Debt – Total Debt 12 months ago)/Market Capitalization
The simulation is run in the S&P 500 index, by ranking stocks in 10 buckets from lower to higher shareholder yields. The next chart plots the annualized return of the 10 buckets, starting in January 1999 with an annual rebalancing in equal weight. The red bar on the left represents the performance of the equal-weight S&P 500 index, used as a benchmark.
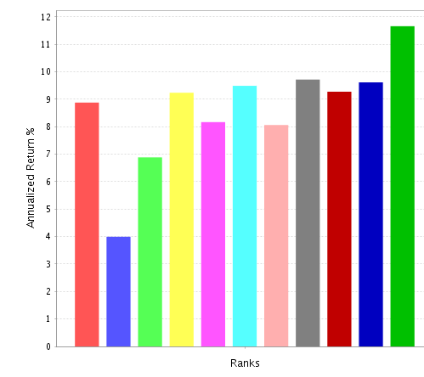
Shareholder yield ranking system performance since 1999 (Portfolio123)
This simulation shows an excess annualized return over 2.5% for the top decile (on the right) relative to the benchmark (on the left). It is significant enough to validate on 25 years of historical data the concept of shareholder yield as a valuable investing factor. However, like for all factors, the statistical bias vary with time. For the last 5 years, the excess return is below 1% for the same bucket (next chart).
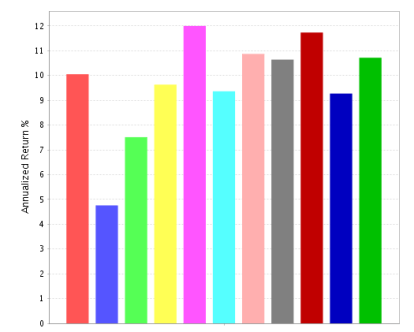
Shareholder yield ranking system performance, last 5 years (Portfolio123)
Fundamentals
WTV is much cheaper than the S&P 500 regarding the usual valuation ratios, as reported below.
|
WTV |
SPY |
|
|
Price/Earnings TTM |
12.39 |
22.64 |
|
Price/Book |
2.22 |
4 |
|
Price/Sales |
0.84 |
2.58 |
|
Price/Cash Flow |
7.67 |
15.71 |
I have scanned holdings with my preferred quality metrics. In my ETF reviews, risky stocks are companies with at least 2 red flags among: bad Piotroski score, negative ROA, unsustainable payout ratio, bad or dubious Altman Z-score, excluding financials and real estate where these metrics are unreliable. With these assumptions, 18 holdings are risky and they weigh 15% of asset value. It is not very good, but still acceptable.
Based on my calculation of aggregate metrics reported in the next table, the portfolio quality is similar to the benchmark.
|
WTV |
SPY |
|
|
Altman Z-score |
3.44 |
3.58 |
|
Piotroski F-score |
5.64 |
5.73 |
|
ROA % TTM |
8.38 |
7.23 |
WTV vs competitors
The next table compares characteristics of WTV and two other funds implementing a shareholder yield strategy:
- iShares Core Dividend ETF (DIVB), reviewed here,
- Cambria Shareholder Yield ETF (SYLD), reviewed here.
|
WTV |
DIVB |
SYLD |
|
|
Strategy start |
12/18/2017 |
11/7/2017 |
5/13/2013 |
|
Expense Ratio |
0.12% |
0.05% |
0.59% |
|
AUM |
$179.85M |
$266.44M |
$949.45M |
|
Avg Daily Volume |
$0.89M |
$1.57M |
$4.83M |
|
Holdings |
121 |
426 |
102 |
|
Top 10 |
16.03% |
26.55% |
16.42% |
|
Turnover |
66.00% |
65.00% |
41.00% |
|
Dividend Yield TTM |
1.64% |
3.00% |
2.46% |
WTV is the smallest (in assets under management) and less liquid of the three funds. It has the less attractive dividend yield, but the expense ratio is on the cheap side.
As reported on the next chart, SYLD is leading the pack in total return since WTV started a shareholder yield strategy (12/18/2017). WTV also lags SPY on this time interval.
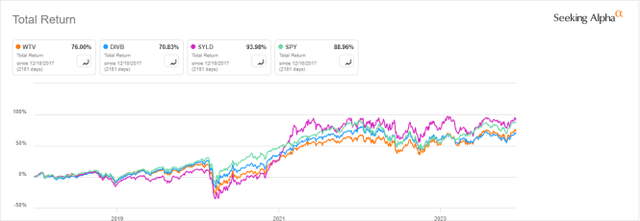
WTV vs DIVB, SYLD, SPY, total return since 12/18/2017 (Seeking Alpha)
In 2023 to date, WTV is still lagging the S&P 500, but it is ahead of its competitors:
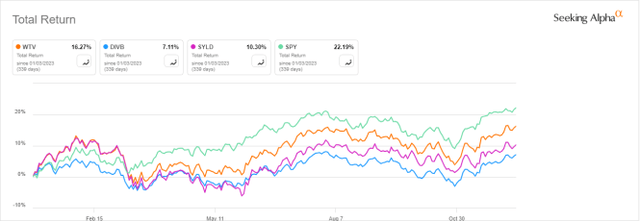
WTV vs DIVB, SYLD, SPY, year-to-date total return (Seeking Alpha)
Annualized distributions went up from $0.72 to $1.19 per share between 2018 and 2022. It is an increase of 65.3%, while the cumulative inflation has been about 18% in the same time, based on CPI. VTW shows attractive dividend growth characteristics, but the annual sum of distributions is likely to go down in 2023 (currently $0.75 for the first 3 quarters).
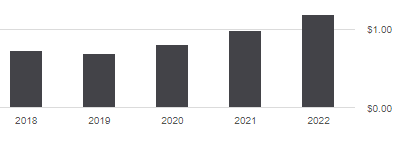
WTV Distribution history (Seeking Alpha)
Takeaway
WisdomTree U.S. Value Fund (WTV) is an actively managed ETF with a quantitative model combining shareholder yield and quality metrics. The heaviest sectors are consumer discretionary and financials, and the fund is well-diversified across sectors and holdings. WTV has attractive valuation and dividend growth metrics, but quality is average. Regarding total return since it started the shareholder yield strategy in December 2017, the fund has lagged its main competitor Cambria Shareholder Yield ETF, which has a higher fee but a better liquidity.
Credit: Source link