

• bitcoinBitcoin(BTC)$79,383.001.42%
  • ethereumEthereum(ETH)$2,500.501.10%
  • tetherTether(USDT)$1.000.02%
  • binancecoinBNB(BNB)$750.09-0.11%
  • rippleXRP(XRP)$1.432.81%
  • usd-coinUSDC(USDC)$1.000.01%
  • solanaSolana(SOL)$104.331.55%
  • tronTRON(TRX)$0.3390490.12%
  • Figure HelocFigure Heloc(FIGR_HELOC)$1.040.00%
  • zcashZcash(ZEC)$1,270.249.33%
  • HyperliquidHyperliquid(HYPE)$86.694.51%
  • dogecoinDogecoin(DOGE)$0.0909222.15%
  • RainRain(RAIN)$0.016309-3.04%
  • USDSUSDS(USDS)$1.000.02%
  • whitebitWhiteBIT Coin(WBT)$81.972.61%
  • moneroMonero(XMR)$497.13-1.50%
  • chainlinkChainlink(LINK)$12.16-2.95%
  • leo-tokenLEO Token(LEO)$9.190.21%
  • cardanoCardano(ADA)$0.2210031.71%
  • stellarStellar(XLM)$0.1886190.61%
  • bitcoin-cashBitcoin Cash(BCH)$259.041.61%
  • daiDai(DAI)$1.000.02%
  • Ethena USDeEthena USDe(USDE)$1.000.00%
  • USD1USD1(USD1)$1.00-0.01%
  • CantonCanton(CC)$0.1063712.37%
  • litecoinLitecoin(LTC)$54.18-1.93%
  • uniswapUniswap(UNI)$6.71-4.77%
  • the-open-networkGram (prev. Toncoin)(GRAM)$1.400.75%
  • hedera-hashgraphHedera(HBAR)$0.078639-1.55%
  • avalanche-2Avalanche(AVAX)$7.96-0.87%
  • nearNEAR Protocol(NEAR)$2.6214.85%
  • suiSui(SUI)$0.810.49%
  • Global DollarGlobal Dollar(USDG)$1.00-0.01%
  • shiba-inuShiba Inu(SHIB)$0.0000050.35%
  • crypto-com-chainCronos(CRO)$0.059975-0.89%
  • paypal-usdPayPal USD(PYUSD)$1.000.01%
  • BlackRock USD Institutional Digital Liquidity FundBlackRock USD Institutional Digital Liquidity Fund(BUIDL)$1.000.00%
  • tether-goldTether Gold(XAUT)$4,395.130.11%
  • MemeCoreMemeCore(M)$1.180.07%
  • Circle USYCCircle USYC(USYC)$1.140.01%
  • BittensorBittensor(TAO)$267.125.84%
  • Ripple USDRipple USD(RLUSD)$1.000.01%
  • okbOKB(OKB)$114.47-0.55%
  • Ondo US Dollar YieldOndo US Dollar Yield(USDY)$1.150.04%
  • mantleMantle(MNT)$0.641.98%
  • AsterAster(ASTER)$0.75-1.04%
  • aaveAave(AAVE)$129.100.17%
  • polkadotPolkadot(DOT)$1.178.43%
  • Pump.funPump.fun(PUMP)$0.0046608.77%
  • pax-goldPAX Gold(PAXG)$4,398.440.11%
TradePoint.io
  • Main
  • AI & Technology
  • Stock Charts
  • Market & News
  • Business
  • Finance Tips
  • Trade Tube
  • Blog
  • Shop
No Result
View All Result
TradePoint.io
No Result
View All Result

Why We Like U.S. Fixed Income

September 20, 2023
in Market & News
Reading Time: 4 mins read
A A
Why We Like U.S. Fixed Income
ShareShareShareShareShare

DNY59

YOU MAY ALSO LIKE

Put Cash To Work With Short-Duration ETFs

Brent crude rises above $100 a barrel as Middle East conflict escalates – Reuters

By Paul Mielczarski

At the start of the year, many investors predicted 2023 would be the year of the bond. Instead, while fixed income returns have struggled, US equities have delivered double-digit returns.

Stocks have benefited from conservative investor positioning at the end of 2022, a resilient US economy, and the expectation of an AI-led investment boom.

Going forward, we believe there is a compelling case for being long US fixed income over equities:

  1. The economic outlook for lower inflation and slower growth favors US bonds. The Federal Reserve (Fed) is likely done raising rates, and the focus will shift to an easing cycle. Core inflation momentum is converging toward the Fed’s 2% target. The labor market is rebalancing rapidly, due to lower labor demand and strong labor force growth, which should lead to lower wage growth. Global growth is rolling over, led by China and Europe. While US growth has been resilient so far, we expect growth to slow as monetary policy lags kick in.
  2. US agency mortgage-backed securities look particularly attractive, with a higher yield than equities. We believe US fixed income valuations overall are compelling versus equities. Within fixed income, our preference is for agency mortgage-backed securities (MBS), which offer similar yields to investment grade bonds but with no credit risk and lower duration risk. The chart below compares the forward-looking US equity earnings yield with the yield on agency MBS. For the first time in 20 years, mortgage bonds have a higher yield than stocks (see Exhibit 1).1
  3. US equity earnings yield with the yield on agency MBS

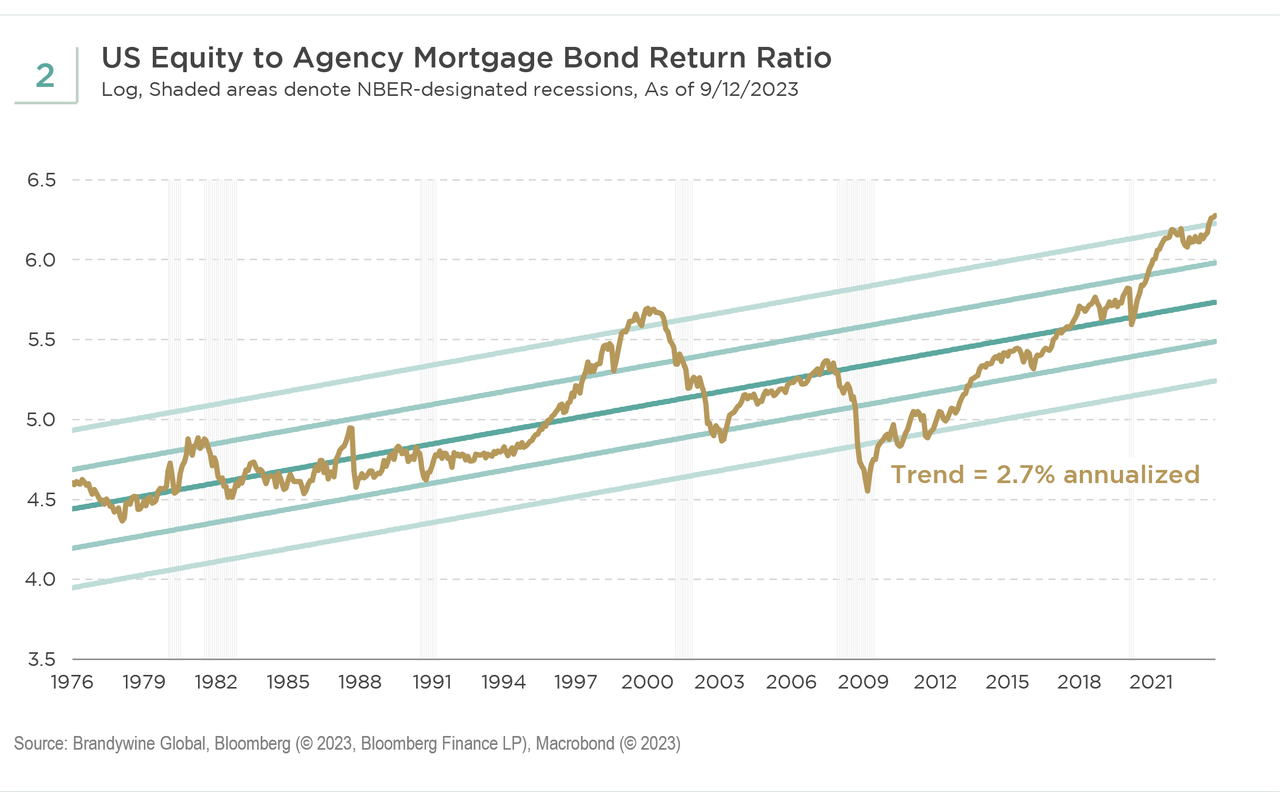
  4. Lower volatility over equities also supports the case for bonds. Return volatility of mortgage bonds is roughly 50-75% lower than US equities, making them very attractive from a portfolio construction perspective. In the late 1990s, equity yields were significantly below MBS yields, and that episode ended badly for US equity investors. The chart below shows that the equity-to-MBS return ratio is already more than two standard deviations above its long-term trend (see Exhibit 2).2 The last time we saw that was at the peak of the equity market bubble in 2000.
  5. equity-to-MBS return ratio

  6. Bonds may provide advantages across a range of economic outcomes. Overall, we believe US fixed income offers investors attractive asymmetry across a range of economic scenarios. In a soft-landing scenario, bonds are likely to generate decent returns, although they may struggle to outperform cash. In a deeper growth slowdown or financial shock, they could significantly outperform equities.

While US growth resilience has been surprising this year, it is important to recall that the full impact of the Fed’s cumulative, aggressive tightening is still to come. We see a variety of factors suggesting slower growth ahead and supporting our outlook for US bonds.

1 Exhibit 1 uses the S&P 500 Index to derive the earnings yield for US equities and the Bloomberg US Mortgage-Backed Securities (MBS) Index to derive the Agency MBS yield.

2 Exhibit 2 uses the MSCI USA Index to derive the equity total return and the Bloomberg US Mortgage-Backed Securities (MBS) Index to derive the Agency MBS total return.

The S&P 500 Index is a broad measure of U.S. domestic large cap stocks. The 500 stocks in this capitalization-weighted index are chosen based on industry representation, liquidity, and stability.

The MSCI USA Index is designed to measure the performance of the large and mid-cap segments of the US market. With 628 constituents, the index covers approximately 85% of the free float-adjusted market capitalization in the US.

The Bloomberg US Mortgage-Backed Securities (MBS) Index tracks fixed-rate agency mortgage-backed pass-through securities guaranteed by Ginnie Mae (GNMA), Fannie Mae (OTCQB:FNMA), and Freddie Mac (FHLMC). The index is constructed by grouping individual TBA-deliverable MBS pools into aggregates or generics based on program, coupon, and vintage.

Original Post

Editor’s Note: The summary bullets for this article were chosen by Seeking Alpha editors.

Credit: Source link

ShareTweetSendSharePin

Related Posts

Put Cash To Work With Short-Duration ETFs
Market & News

Put Cash To Work With Short-Duration ETFs

September 9, 2026
Brent crude rises above 0 a barrel as Middle East conflict escalates – Reuters
Market & News

Brent crude rises above $100 a barrel as Middle East conflict escalates – Reuters

September 9, 2026
ASP Isotopes Inc. (ASPI) Analyst/Investor Day Transcript
Market & News

ASP Isotopes Inc. (ASPI) Analyst/Investor Day Transcript

September 9, 2026
Stock futures are little changed after losing session; Brent crude nears 0 per barrel: Live updates – CNBC
Market & News

Stock futures are little changed after losing session; Brent crude nears $100 per barrel: Live updates – CNBC

September 9, 2026
Next Post
First Impressions of Apple’s New iPhone X and iPhone 8

First Impressions of Apple's New iPhone X and iPhone 8

Leave a Reply Cancel reply

Your email address will not be published. Required fields are marked *

Search

No Result
View All Result
Meet Switchyard: A Rust Proxy and Library That Routes and Translates LLM Traffic Across OpenAI and Anthropic APIs

Meet Switchyard: A Rust Proxy and Library That Routes and Translates LLM Traffic Across OpenAI and Anthropic APIs

September 2, 2026
Morning News NOW Full Episode – July 23

Morning News NOW Full Episode – July 23

September 6, 2026
Florida authorities search for suspected murderer

Florida authorities search for suspected murderer

September 6, 2026

About

Learn more

Our Services

Legal

Privacy Policy

Terms of Use

Bloggers

Learn more

Article Links

Contact

Advertise

Ask us anything

©2020- TradePoint.io - All rights reserved!

Tradepoint.io, being just a publishing and technology platform, is not a registered broker-dealer or investment adviser. So we do not provide investment advice. Rather, brokerage services are provided to clients of Tradepoint.io by independent SEC-registered broker-dealers and members of FINRA/SIPC. Every form of investing carries some risk and past performance is not a guarantee of future results. “Tradepoint.io“, “Instant Investing” and “My Trading Tools” are registered trademarks of Apperbuild, LLC.

This website is operated by Apperbuild, LLC. We have no link to any brokerage firm and we do not provide investment advice. Every information and resource we provide is solely for the education of our readers. © 2020 Apperbuild, LLC. All rights reserved.

No Result
View All Result
  • Main
  • AI & Technology
  • Stock Charts
  • Market & News
  • Business
  • Finance Tips
  • Trade Tube
  • Blog
  • Shop

© 2023 - TradePoint.io - All Rights Reserved!