
Mlenny
Performance Assessment
In my last article on the JPMorgan Equity Premium Income ETF (NYSEARCA:JEPI), I expressed my view that it would underperform the S&P500 (SPY) (SPX) since my market outlook was bullish and JEPI’s covered-call strategy did not fare as well in rising markets. Hence, I had rated it a ‘Sell’ (see how to interpret my ratings at the end of this article).
Performance since Author’s Last Article on JEPI (Seeking Alpha, Author’s Last Article on JEPI)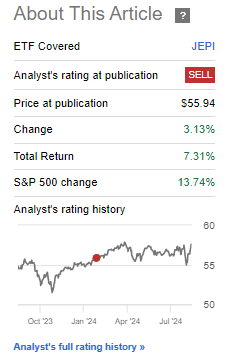
Since then, JEPI has indeed underperformed the S&P500 on a total shareholder return basis by 6.43%. So I was accurate in my assessment.
Thesis
August 2024 has had a volatile start, with the S&P500 falling more than 8%, only to rebound more than 9% so far. Given this market volatility, it made sense to revisit and update my broader market outlook and its implications for JEPI. My analysis leads me to still prefer the S&P500 (I personally invest in the Vanguard S&P500 ETF (VOO) to gain this exposure) over JEPI:
- The market is poised to go higher, making JEPI less attractive
- JEPI’s underexposure to technology is unfavorable in the face of rate cuts
- Fund flows indicate sentiment away from JEPI
- JEPI is more expensive than SPY
- Technicals indicate further relative underperformance for JEPI vs. SPY
The market is poised to go higher, making JEPI less attractive
In the market, although there may be sharp corrections such as the >8% fall in 3 days, I believe there is no need to panic and adopt an overly defensive stance if such corrections are not accompanied by worsening fundamentals.
S&P500 YoY EPS and Recessions History (Yardeni Research)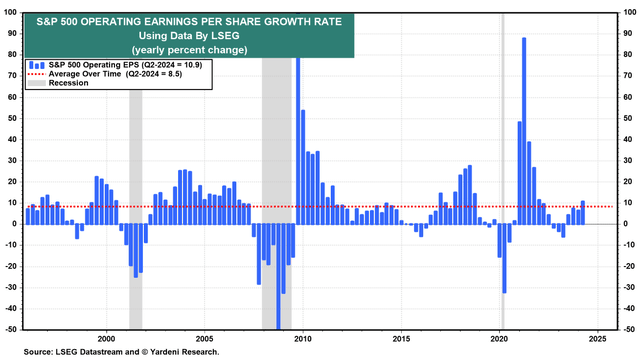
This seems to be the case right now, since the S&P500’s Q2 CY24 YoY EPS has been quite healthy at 10.9%, even ticking above the longer-term average of 8.5%. Recessionary periods and their associated longer stock market drawdowns tend to correlate with consecutive quarters of negative EPS growth. We are not in that market condition right now. Hence, I still lean fundamentally bullish on the overall market.
Technically too, I believe the recent sharp, V-shaped recovery in the S&P500 is a very positive sign of a fresh, emerging bull swing up that could last multiple quarters. A confirmation of a breakout above recent highs would increase my confidence in this view:
S&P500 Bullish Outlook (TradingView, Author’s Analysis)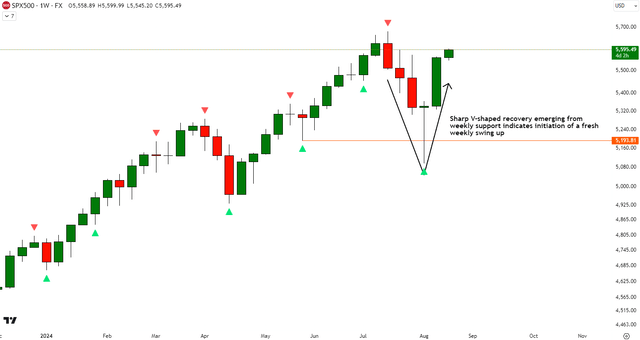
A bull market is unfavorable for JEPI as its covered call strategy to generate income tends to do best in sideways to downward markets. JEPI has 13.5% of its overall portfolio allocated to this strategy via equity-linked notes. I discussed this feature in more detail in my last article on JEPI.
JEPI’s underexposure to technology is unfavorable in the face of rate cuts
JEPI ETF has a 16.8% underweight to the Technology sector vs. SPY. (14.8% portfolio exposure to Technology vs. 31.6% for the SPY):
JEPI’s Net Sector Exposure vs SPY (ETF Filings, Author’s Analysis)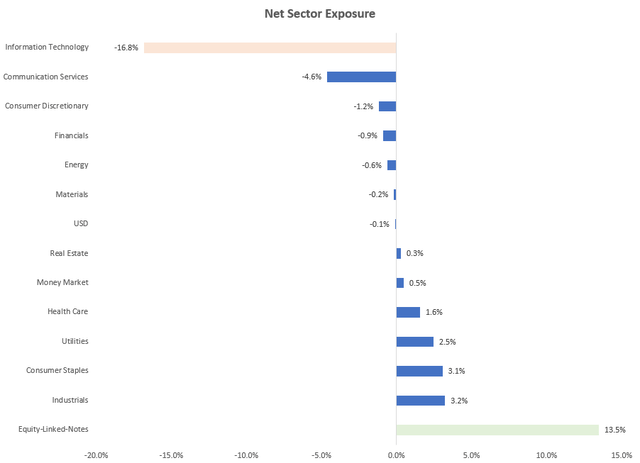
I believe this is unfavorable given a likely interest rate cut scenario, which tends to benefit longer-duration technology stocks more.
Target Rate Probabilities for September Fed 2024 Meeting (CME FedWatch Tool, Author’s Highlights)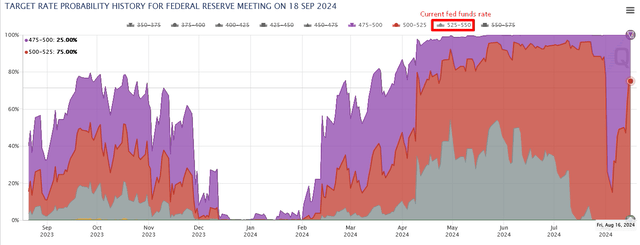
The current Fed Funds rate stands at 525-550bps. In the September 2024 meeting, the market is pricing in a cut of between 25bps (75% chance) to 50bps (25% chance), with a 0% probability of rates being kept constant or hiked further.
The Jackson Hole Symposium, in which central bankers discuss broader monetary policy strategy, takes place later this week. Naturally, this is a key event worth monitoring that I would be tracking in case any updates to the rate-cut thesis are due.
Fund flows indicate sentiment away from JEPI
Looking at the JEPI ETF’s fund flows, we see that August 2024 has been particularly bad for JEPI with largely negative outflows:
JEPI Fund Flows (ETF Database)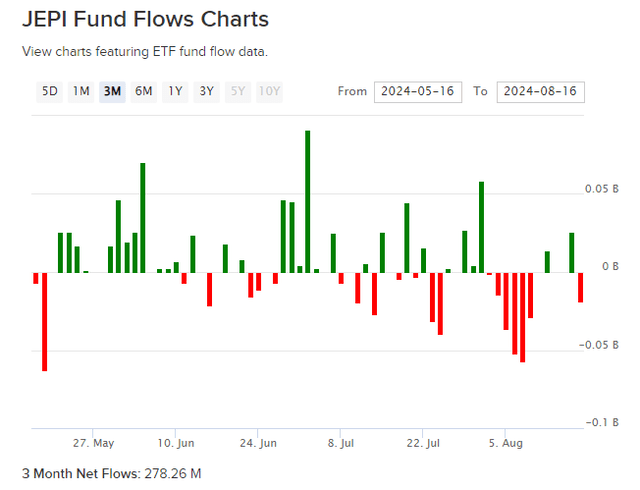
I believe this is a reflection of market sentiment expecting bullish markets based on a rate cut catalyst.
JEPI is more expensive than SPY
From a valuation perspective, JEPI currently trades at a PE of 18.15x. The SPY trades at a PE of 17.86x. So JEPI is slightly more expensive than SPY due to a 1.62% premium. This is another reason to prefer the S&P500 over JEPI.
Technicals indicate further underperformance for JEPI vs. SPY
If this is your first time reading a Hunting Alpha article using Technical Analysis, you may want to read this post, which explains how and why I read the charts the way I do. All my charts reflect total shareholder return as they are adjusted for dividends/distributions.
Relative Read of JEPI vs. SPX500
JEPI vs SPX500 Technical Analysis (TradingView, Author’s Analysis)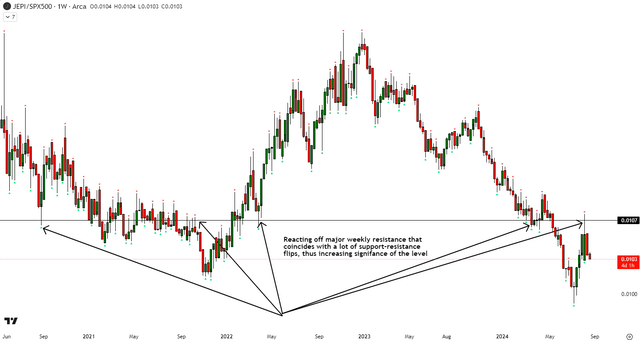
From a relative JEPI vs. S&P500 perspective, the ratio chart is rejecting off a major weekly resistance level, which has a prominent history of acting as both support and resistance, thus making the level of significant importance. I anticipate further downside toward the weekly lows and potentially beyond.
Can the first rate cut lead to a market correction?
If September 2024’s Federal Reserve meeting results in a rate cut, that would be the first rate cut in the rate hike cycle that started in 2022:
Federal Funds Rate (TradingView, Federal Reserve)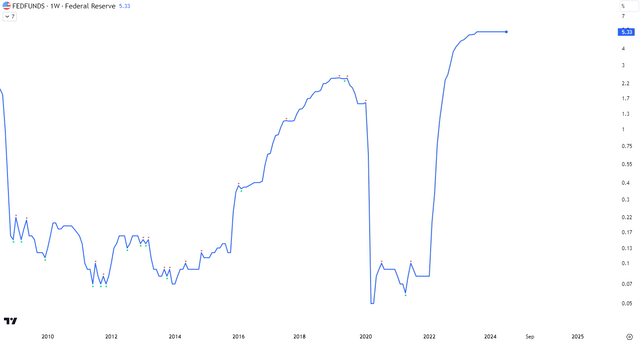
Historical data reveals that since 1974, the S&P500 has fallen 20.5% on average following the first rate cut in a ~9-month period. If such a phenomenon occurs, it would change my thesis materially since a weaker market would make JEPI’s covered call strategy much more attractive. Hence, under those circumstances, I would expect JEPI to outperform the S&P500.
However, despite this historical data, a material market correction is not my base case. Because the details in the history show that in this dataset, rate cuts were typically in response to an imminent recession. That does not seem to be the circumstance this time, as seen in both the S&P500 EPS growth data discussed earlier and in the recent downward revisions of recession probabilities in the next twelve months.
Takeaway & Positioning
My preference for the S&P500 over JEPI has been accurate since my last coverage of JEPI at the start of this year. A volatile start to August 2024 prompted me to review my broader market outlook and its implications on JEPI vs S&P500.
The S&P500 YoY EPS growth data is quite healthy, and we are nowhere close to negative growth territory, which is when recessions and longer-term market drawdowns tend to occur. Hence, my broader market (S&P500) outlook remains bullish, especially since the technicals also align positively. Given JEPI’s weakness in bullish, rising markets due to its covered call strategy, which makes up 13.5% of its overall portfolio, I believe this does not bode well for preferring JEPI over the S&P500.
Furthermore, the market’s expectations of rate cuts in the September 2024 Federal Reserve meeting would be beneficial for long-duration equity such as technology stocks. JEPI has a relative 16.8% net underweight to this sector vs. the SPY, which is another point against JEPI.
From a valuation perspective, JEPI has no case vs. SPY, since the former is trading at a small 1.6% premium to the latter. Technically too, relative to the S&P500, JEPI/SPX500 seems poised for further downside ahead as it rejects off a key weekly level. This would correspond to negative alpha ahead for JEPI vs. SPY.
Rating: ‘Sell’
How to interpret Hunting Alpha’s ratings:
Strong Buy: Expect the company to outperform the S&P500 on a total shareholder return basis, with higher than usual confidence. I also have a net long position in the security in my personal portfolio.
Buy: Expect the company to outperform the S&P500 on a total shareholder return basis
Neutral/hold: Expect the company to perform in-line with the S&P500 on a total shareholder return basis
Sell: Expect the company to underperform the S&P500 on a total shareholder return basis
Strong Sell: Expect the company to underperform the S&P500 on a total shareholder return basis, with higher than usual confidence
The typical time-horizon for my views is multiple quarters to around a year. It is not set in stone. However, I will share updates on my changes in stance in a pinned comment to this article and may also publish a new article discussing the reasons for the change in view.
Credit: Source link