


peshkov/iStock via Getty Images
Dear Partners,
While individual client returns may differ based on their inception dates, consolidated performance of all accounts for the period ending December 31, 2025 is as follows:
*Performance is from Nov 8 – Dec 31, 2021
What a year! The “tariff tantrum, ” back in April 2025, when markets dropped close to 20%, now seems like a distant memory. Overall, we had a good batting average this year where, with the exception of a few companies, the majority of the portfolio helped drive our positive performance.
While we had a good year, we want to reiterate that yearly performance numbers are not that relevant. A portfolio’s returns should be looked at on a rolling three year basis and then on a full cycle basis which includes a market downturn or bear market.
White Falcon portfolio construction diverges significantly from popular market indexes. We do not manage the portfolio to any particular index. We construct a portfolio of 20-25 stocks that meet our quality and valuation criteria. Our primary benchmark for success is generating positive absolute returns adjusted for risk over a complete market cycle.
White Falcon’s rolling three-year annualized return , our preferred metric for performance, net of fees, now stands at 25.9% CAGR , surpassing the performance of most major indices including the S&P 500. Said another way, $1 million invested with White Falcon three years ago has doubled and grown to almost $2 million today.
Our four year returns of 16.1% CAGR are closer to full cycle returns as they incorporate the bear market of 2022. While the S&P 500 in CAD compounded at 13.1% in the last four years – helped in part by USD appreciation – we still delivered roughly 3% or 300 basis points (BPS) of outperformance over the S&P 500 after fees and expenses. Most people, of course, do not put 100% of their life savings into the S&P 500. Many advisors recommend allocating client capital to all-in-one, self-balancing funds such as BlackRock (BLK)’s XEQT, which delivered a 4-year CAGR of 11.9%. Over that same period, White Falcon has outperformed Blackrock’s XEQT by approximately 4.2% or 420 bps after all fees and expenses.
Compounding is the magic of investing – Jim Rogers
To illustrate the power of compounding, consider a $1 million portfolio invested for twenty years. Compounding at 8% annually, that capital grows to roughly $4.7 million. Increase the return to 10%, and the ending value jumps to about $6.7 million. That 2% or 200 bps difference doesn’t sound dramatic in any single year, but over two decades it adds up to an additional $2 million or about 40% more wealth! We believe it is worth trying to beat the market because even a small edge, compounded over decades, can create meaningful extra wealth.
It has now been three years since the bear market of 2022, and one of the most common questions we receive is about future returns. The truth is, no one can predict the future. What we can do is stay focused on the companies we own. So in this letter, we’ll take you through several of our holdings and explain why we remain optimistic about their long-term prospects.
The top 5 positions for the White Falcon portfolio are precious metal royalty companies, AMD, NFI Group (NFI), EPAM, and Nu Holdings.
Advanced Micro Devices (AMD) designs a broad range of digital semiconductors serving PCs, gaming consoles, and data centers, including the rapidly expanding AI market. Under CEO Lisa Su, the company was pulled back from the brink of bankruptcy and reshaped into a high-performance computing leader. Over the past decade, AMD has steadily taken market share from Intel (INTC) and emerged as a credible No. 2 in GPUs behind Nvidia (NVDA). Given AMD’s volatility, we initiated a position in November 2022 and added to it again in April 2025. Management has guided to approximately $10 in Earnings per share (EPS) for FY2027E and more than $20 in EPS by 2030E. If the company delivers on these targets, then it should be a $400+ stock in a few years which is roughly 75% higher than current levels.
EPAM Systems (EPAM) is an engineering-driven IT services firm that sits at the critical intersection of enterprise technology and real-world implementation. It was deemed as an AI loser but the market is slowly realizing that, (1) a lot of corporations are still not on the cloud, (2) core systems will need to be modernized before AI is deployed, and (3) custom agents will require high-end custom development, and (4) EPAM can incorporate AI and productivity into its delivery organisation (e. g. its recent partnership with Cursor) and can grow without adding headcount. EPAM is currently trading at 11x EBITDA and 17x EPS based on this year’s estimates. We expect EPAM to grow revenues in the mid-teens and earnings in the high-teens over the next several years. If the company executes on that trajectory, the share price should broadly track earnings growth over time.
Nu Holdings (NU) is a perfect hold in some ways. It’s growing fast, earning great returns, and still trades at a pretty reasonable valuation. Most companies growing 30% with 30% ROEs trade at huge multiples. Nu trades at a high teens multiple of earnings. The market still treats Nu like a regular bank in Brazil and not a high-quality tech-enabled compounding. With Nu’s expansion in Mexico and Colombia, growing revenue per user in Brazil, and operating leverage, Nu is likely to keep growing earnings at 30+% for many years to come and its stock price will likely follow.
New Flyer Industries (NFI) manufactures buses in North America and operates in a duopolistic industry structure. The story of NFI has been two steps forward and one step back as the supply chain in this segment of manufacturing is so complicated that one weak link can uptrend supplies to the customer. We believe that the worst is behind and going forward, NFI can grow intrinsic value due to (1) strong backlog, (2) strong earnings power with increasing exposure to EV buses, and (3) debt payoff. NFI currently trades at 11x this year’s earnings and we think it can re-rate to 15-20x within the next two years as it executes on its backlog and pays down debt. If this happens, NFI has a 50-100% upside from current levels.
Our three precious metals holdings in Royal Gold (RGLD), Triple Flag (TFPM) and Franco-Nevada (FNV) were responsible for a third of our gains this year. It has been a fascinating year for precious metals with gold up 64% and silver up 146% for the year! As we’ve discussed previously, our allocation to these companies was intended to serve as a hedge against macroeconomic volatility. This is likely the most fully valued part of the portfolio due to which our allocation to this basket is at the lower end of our targeted 10-15% allocation.
We also hold a number of positions whose fundamentals strengthened even though their market prices remained essentially unchanged for the year. This includes our positions in Amazon (AMZN), Rentokil (RTO), Ag Growth (AFN), EPAM and Grifols (GRFS). That widening gap between intrinsic value and market price strengthens our conviction and positions us well for when fundamentals ultimately assert themselves.
As contrarian value investors, we sometimes go into areas that make no sense in that time but offer asymmetric opportunities. Currently, housing is one such sector. Given high interest rates, all housing and refinancing activity in the US and Canada is depressed. We’ve built a small basket of companies that stand to benefit if rates decline and demand rebounds. Timing any cycle is difficult, which is why the position size remains small. These businesses carry significant operating leverage to a housing recovery and are currently priced as though the downturn will last forever. That combination creates an attractive setup. In the appendix to this letter, we present our thesis on Huntsman Corp (HUN) which is a part of this basket.
To give credit where it’s due, George has a habit of casually asking, “Have you looked at stock xyz?” More often than not, it’s not immediately obvious why anyone would bother looking at such a name. Only after digging in do you uncover the real story. One such name this year was Canadian Solar (CSIQ). Ordinarily, a solar stock wouldn’t even make our list. But as I dug deeper, a few things stood out: (1) Solar has quietly become the cheapest source of power in many places around the world (without subsidies), (2) Panel manufacturing remains brutally competitive, but the stronger players are shifting toward full systems (including batteries), (3) Canadian Solar had a JV with Blackrock to build a power company, and (4) while Canadian Solar has most of its manufacturing in China, it was founded by a Canadian engineer who understands governance and transparency.
What ultimately pushed us to take a position was the valuation: the company was trading at roughly a quarter of its sum-of-the-parts (SOTP) value. Our experience with discounts to SOTP situations is mixed. Usually, one asset or another has an issue that prevents the discount from ever closing. In this case, however, sentiment was so depressed – solar wasn’t exactly in favour politically in the US – that even modestly positive news was enough to re-rate the stock. We have a cost base of under $10 per share while the stock touched a high of $30 before retrenching back to $20 per share. Today, solar stocks have become AI beneficiaries as solar plus storage is seen as a viable option to supply clean power to datacenters.
A market downturn doesn’t bother us. It is an opportunity to increase our ownership of great companies with great management at good prices. – Warren Buffett
The two stocks we added to the portfolio following the April taper tantrum – Wayfair (W) and Aritzia (ATZ) – delivered exceptional returns. As a long-only mandate, drawdowns during volatile markets are inevitable. What matters is how we respond, and these two examples demonstrate our discipline in turning volatility into opportunity.
As valuations no longer offered a margin of safety, we exited both stocks before the end of the year. Given their performance since, we wonder if it would have been more prudent to trim to smaller positions rather than fully exit. As long as the business has fundamental tailwinds, a smaller position size allows us to participate in long-term compounding while still managing risk. We are currently running this experiment with few of our fully valued positions.
In essence, while recent performance has been strong, we believe that the portfolio remains well-positioned. The underlying businesses are healthy, valuations remain attractive, and our discipline around risk and quality gives us confidence in the path ahead.
We say this fully aware that markets are sitting at all-time highs and valuations are stretched. We’ve long recognized that the mechanics of price discovery have shifted: there is effectively no ceiling for stocks with strong momentum, just as there is no floor for companies facing deteriorating sentiment. This dynamic has produced a series of rolling mini-bubbles – pockets of the market where a sector begins to rise, attracts more participants simply because it is rising, and accelerates far beyond what fundamentals alone would justify. But this same structure contains the seeds of its own reversal. When expectations are sky-high, even a hint of negative news can flip the narrative instantly, and prices can unwind just as quickly as they climbed.
We see this clearly in the AI sector. Yes, many companies are trading at elevated valuations, with some priced almost entirely on hopes and dreams. However, when an AI company fails to meet lofty expectations, the selling is swift and indiscriminate. That behaviour is characteristic of a frothy environment, but not necessarily a bubble.
Anyone who isn’t confused, really doesn’t understand the situation. – Edward R. Morrow
For us, true bubble conditions would require additional ingredients. We would expect to see a meaningful buildup of leverage tied to AI, and we would expect to see IPOs of major private players – such as Anthropic or OpenAI – coming to market at aggressive valuations and being wildly oversubscribed. Those would be the signs that caution is warranted.
As we have said in the past, we participate in the market of stocks and not the stock market. This same market structure creates meaningful opportunities for active managers who focus on intrinsic value. When prices disconnect from fundamentals, we have the flexibility to trim positions that have become overvalued and redeploy capital into stocks and sectors that the market has abandoned.
In closing, I want to express my sincere gratitude to every investor partner of White Falcon. None of this would be possible without your trust and support. If you know other like-minded people who share our long-term mindset, we’d be grateful for an introduction. In my experience, nothing is more powerful than a referral from someone who understands our philosophy.
Please feel free to get in touch with me for any questions or feedback you may have.
With gratitude,
Balkar Sivia, CFAFounder and Portfolio Manager, White Falcon Capital Management Ltd.
Huntsman Corp (HUN)
The best time to get involved with cyclicals is when the economy is at its weakest, earnings are at their lowest, and public sentiment is at its bleakest. – Peter Lynch
 HUN) showing price and volume from July 2021 to January 2026. The chart includes a 200-day Simple Moving Average (SMA) line. The current price is 11.77 USD, up 0.47 (+4.17%) from the previous close. The SMA is at 10.30. The chart shows a significant decline in price starting around 2024, with a notable spike in volume in late 2024. The koyfin logo is visible in the bottom right corner.” width=”640″ height=”325″ contenteditable=”false” loading=”lazy” srcset=”https://static.seekingalpha.com/uploads/2026/1/22/542689-17691343403593102_origin.jpg?io=w640 640w,https://static.seekingalpha.com/uploads/2026/1/22/542689-17691343403593102_origin.jpg?io=w480 480w,https://static.seekingalpha.com/uploads/2026/1/22/542689-17691343403593102_origin.jpg?io=w320 320w,https://static.seekingalpha.com/uploads/2026/1/22/542689-17691343403593102_origin.jpg?io=w240 240w” sizes=”(max-width: 767px) calc(100vw – 36px), (max-width: 1023px) calc(100vw – 180px), 552px”>
Huntsman is a global specialty chemicals company headquartered in the Woodlands, Texas, operating more than 60 facilities in 25+ countries with ~7,000 employees.
Huntsman has undergone a strategic transformation, evolving from its origins as a widely diversified chemical conglomerate into a highly focused operator of specialty chemicals. This transition is guided by a disciplined “best-owner” philosophy, a strategy where management systematically evaluates and prunes the company’s portfolio approximately every five years.
Several critical milestones have defined this evolution over the past two decades. This process began in earnest in 2006 with the divestiture of the Base Chemicals division, followed by the sale of Titanium Dioxide (TiO 2 ) assets in 2014. The refining of the portfolio continued with the sale of Chemical Intermediates in 2019 and reached a recent peak with the 2022 divestiture of the Textile Effects division.
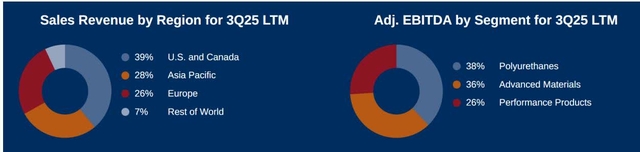
Today, Huntsman operates as a prominent global producer of differentiated organic chemical products, generating approximately $6 billion in annual revenue as of the third quarter of 2025.
The company’s operational structure is organized into three primary business segments.
Source: Huntsman Corporation
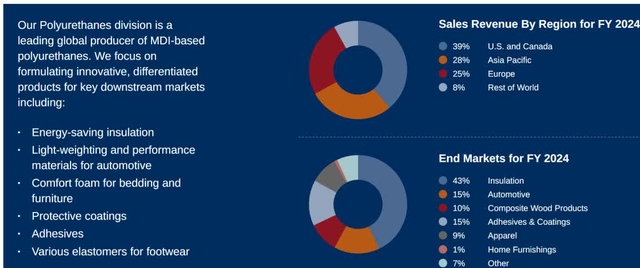
Polyurethanes is the largest contributor, accounting for 65% of total revenue. For the third quarter of 2025, the Polyurethanes segment reported revenue of $956 million and an Adjusted EBITDA of $48 million. This segment centers its product focus on Methylene Diphenyl Diisocyanate (MDI) based polyurethanes. Utilizing proprietary “splitter technology, ” Huntsman is capable of converting crude MDI into over 2, 400 highly tailored formulations for various end markets, including construction insulation, automotive components, furniture, and appliances. Geographically, the segment maintains a strong presence in North America, with the US and Canada accounting for 39% of total company revenue, leaving the firm significantly leveraged to the residential construction market.
Source: Huntsman Corporation
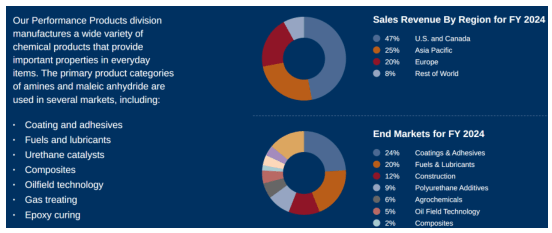
The second segment, Performance products, contributes 17% of total revenue, posting $246 million in revenue and $29 million in Adjusted EBITDA for the third quarter of 2025. This division focuses on Amines and Maleic Anhydride, serving markets such as coatings, adhesives, fuels, lubricants, urethane catalysts, and oilfield technology. To address structural overcapacity in the maleic anhydride market, the company recently implemented a strategic shift by closing its facility in Moers, Germany.
Source: Huntsman Corporation
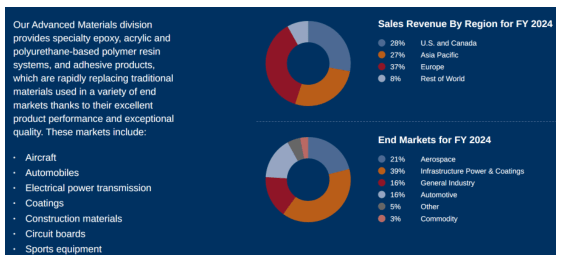
The third segment, Advanced Materials, represents 18% of revenue. In Q3 2025, it generated $265 million in revenue and $44 million in Adjusted EBITDA. This segment specializes in epoxy, acrylic, and polyurethane-based polymer resin systems for the aerospace, transportation, industrial, and power generation sectors. A significant growth vector for this division is the “E-GRADE” purification of chemicals used in semiconductor cleaning.
Source: Huntsman Corporation
MDI
The global methylene diphenyl diisocyanate (MDI) market size and share was valued at USD 28.90 billion in 2024 and is expected to grow at a CAGR of 6.1% over the next 10 years (Polaris Research estimate). The global MDI market is currently characterized by a supply glut that is exerting significant pricing pressure. Capacity expansions are a major factor, with BASF
expected to add 150kt of contracted MDI capacity in the United States in 2026. Simultaneously, Wanhua Chemical in China has announced a massive 700kt expansion. While US anti-dumping duties have successfully reduced direct imports from Wanhua by approximately 250kt, global supply balances remain loose. Wanhua’s volumes are increasingly displacing European production, forcing high-cost producers in that region to dump product in the US. But, in the medium to long term, their only option is capacity closures.
Data from the first nine months of 2025 shows that while China exported 617kt of MDI globally—with significant volumes going to the Netherlands and Russia—direct exports to the US fell to only 7% of China’s total exports, down from 22% in 2024. As mentioned, Chinese overcapacity continues to depress the global pricing floor, which limits Huntsman’s ability to raise prices aggressively outside of its most specialized formulations.
As we look at the U. S. market of around 1, 200 kilotons, you’ve got roughly 75, 000 tons coming in from Europe. You’ve got roughly another 150, 000 tons that will be coming on this next year. And I would remind you that it’s usually not when the kilotons come into the market when you feel the impact of it, it’s usually the year before, right? When people are out premarketing, preselling, pre — cutting the market to try to find a place for all of that inventory as it comes in. – Peter Huntsman (Q3 2025 earnings call)
Methylene Diphenyl Diisocyanate (MDI) Market
Size, By Region, 2020 – 2034 (USD Billion)
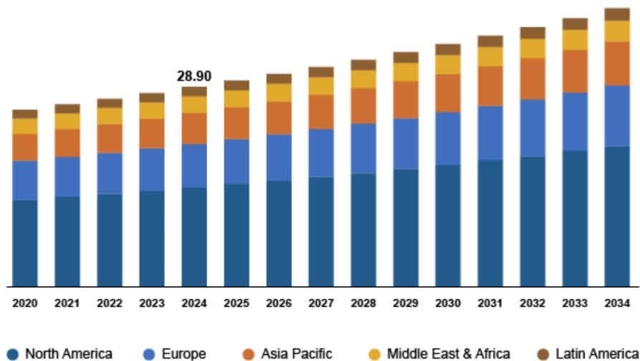
Source: Polaris Research
Longer term, green building standards like LEED and Energy Star provide incentives to the building owners to use energy-efficient materials in their buildings, this in turn is driving the demand for MDI, thereby driving the industry growth in North America.
Cyclically, while the market is not close to a bottom the set up is getting better. The new capacity from BASF will be absorbed in 1H 2026 and then thereafter we can have positive surprises from (A) no further capacity additions, (B) EU volumes declining, and (C) construction markets getting better. The market has not turned but is close to turning and the extent of dividend cut proposed by the board/management shows that they are more bullish on the numbers for this year and next compared to the average analyst.
Other divisions
The cyclicality of the MDI division is hiding the quality of Huntsman’s other divisions.
In the Aerospace and Defense sector, Huntsman competes in a high-tech market with extreme safety standards. While rivals like Hexcel are more vertically integrated into carbon fiber production, Huntsman focuses on the resin systems that bind those fibers together. Another aggressive competitor, Syensqo, targets specialty polymers for aircraft light-weighting. Huntsman’s primary advantage in this space is its Araldite® brand, which has a 70-year history and is often part of the original design specifications for major airframes, creating a formidable competitive moat.
The (growth) think it will probably be in the next — within the next couple of quarters, next 3, 4, 5 quarters. The reason is that you’ve got to make sure that you understand the difference between deliveries and build rate. – Peter Huntsman (Q2 2025 earnings call)
Advanced Materials, as you see the build rates improve in aerospace, you see the continuation of the build-out on the power grid, you see consumers demand continue to improve, hopefully, in the automobile area, you ought to see all of those things — yes, some will be consumer-driven, others will be infrastructure driven and others will just be the ability for manufacturing to get it right. – Peter Huntsman (Q3 2025 earnings call)
In the semiconductor market, the focus is on extreme purity. Huntsman faces competition from Japanese giants like Shin-Etsu and specialized US firms like Entegris. The high barriers to entry here are not just in chemical production, but in the sophisticated logistics and filtration technology required to deliver products without contamination.
On the electronics side, I’d remind you, that’s about 40% of our earnings. I say boring because in 2018, the business made up about 20%. Today, it’s 40%. So the business for us has doubled over the last 7 years. We’ve seen phenomenal growth at a time when a lot of businesses have been flat to down during that time period. And I think that over the course of the next decade, electronics and power is going to continue to grow. – Peter Huntsman (Q3 2025 earnings call)
These are structural growth businesses that benefit from long term trends but are also under-earning due to these specific factors. As these factors reverse, they should also contribute to earnings growth in the quarters ahead. As Huntsman is mainly considered an MDI company, the quality and durability of these divisions is often overlooked.
Self Help
To protect margins during this cyclical trough, Huntsman’s management has launched aggressive restructuring and cost-reduction programs. A major initiative aims for over $100 million in cost savings, with an $80 million run-rate already achieved as of Q3 2025. This program includes the permanent closure of the Moers, Germany, maleic anhydride plant to eliminate structural cost disadvantages in Europe. Additionally, the company is undergoing SG&A realignment through headcount reductions and corporate streamlining to narrow the cost gap with larger competitors.
In addition, Huntsman announced a dividend cut from a $0.25 quarterly rate to an $0.0875 quarterly rate. The absolute annual dividend total moved lower from $172m to $46m which is still tight but between working capital and better P&L in 26′ and 27′ the management and the board feel confident in their ability to maintain the reduced payout. The shares were up the day the dividend cut was announced!
Debt
It is important to note that Huntsman has $1.5 bn in debt with 2025 EBITDA at $280 mn which is a 5.4x debt/EBITDA ratio and worse when looked at on a FCF basis. However, the debt is low cost and there is no near maturities and this debt is spaced out:
- • 4.500% Senior Notes due 2029: $750 million outstanding
- • 2.950% Senior Notes due 2031: $400 million outstanding
- • 5.700% Senior Notes due 2034: $350 million outstanding.
- • Revolving Credit Facility (due May 2027): A $1.2 billion facility.
In May 2025, the company amended this agreement to provide “covenant relief, ” increasing the permitted leverage ratio to allow more breathing room while earnings are weak.
Huntsman maintains a solid liquidity position with approximately $1.4 billion in combined cash and unused borrowing capacity. The dividend cut, as mentioned above, also helps with debt ratios going forward.
Future Estimates
Looking ahead to 2026, consensus estimates that revenue is projected to be relatively flat at $5.75 billion while EBITDA is expected to recover to $342 million. Management does not anticipate a quick “V-shaped” recovery in MDI pricing due to the aforementioned capacity additions by BASF. Looking strictly at these numbers the stock is not cheap as it is trading at 11x 2026F consensus EBITDA.
As a base case, we believe demand supply will be more in balance 2H 2026 going into 2027 due to which consensus estimates will have to increase. Due to this, the downside to the stock is likely limited.
This is what consensus has for Huntsman:
If the company is to achieve $450 mn in EBITDA in 2027 then at 10x EBITDA, this is still $18 per share or a 52% upside to the current stock price in two years.
The bull case for Huntsman rests on the company’s high operating leverage and its potential to benefit when the industry cycle eventually turns. Key drivers for this scenario include a macro recovery, declining interest rates, and rebound in the US housing market. Furthermore, if competitor capacity additions are delayed or if high-cost European competitors shut down more capacity than expected, the global MDI supply/demand balance could tighten.
In a bull case, normalized EBITDA could reach $700 million or above (given cost cuts). Applying a 10x multiple to an $700 million recovery EBITDA would imply a stock price of $35+ per share. A lot has to go right for this scenario but it is in the realm of possibilities.
Original Post
Editor’s Note: The summary bullets for this article were chosen by Seeking Alpha editors.
Credit: Source link


")


