

VisionsofAmerica/Joe Sohm
As explained in Prof. Robert Jarrow’s book, cited below, forward rates contain a risk premium above and beyond the market’s expectations for the 3-month forward rate. We document the size of that risk premium in this graph. It shows the zero-coupon yield curve implied by current Treasury prices compared with the annualized compounded yield on 3-month Treasury bills (US3M) that market participants would expect based on the daily movement of government bond yields in 14 countries since 1962. The risk premium, the reward for a long-term investment, is large and widens over most of the 30-year maturity range. The graph also shows a sharp downward shift in expected yields in the first few years, then the decline continues at a slow but steady pace for the full 30 years. We explain the details below.
SAS Institute Inc.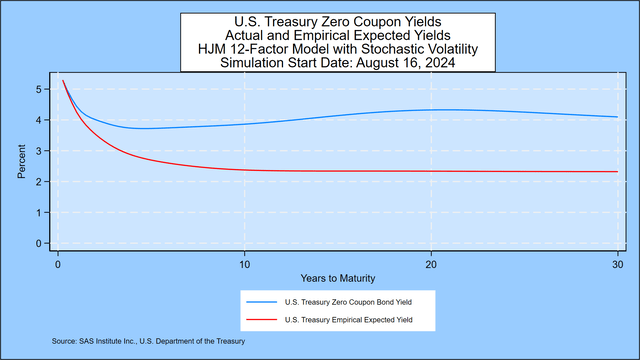
For more on this topic, see the analysis of government bond yields in 14 countries through June 30, 2024, given in the appendix.
Inverted Yields, Negative Rates, and U.S. Treasury Probabilities 10 Years Forward
The negative 2-year/10-year Treasury spread has now persisted for 531 trading days. The spread is currently at a negative 17 basis points, widening 6 basis points from last week. The table below shows that the current streak of inverted yield curves is the longest in the U.S. Treasury market since the 2-year Treasury yield was first reported on June 1, 1976. The second-longest streak is 423 trading days, starting on August 18, 1978.
SAS Institute Inc.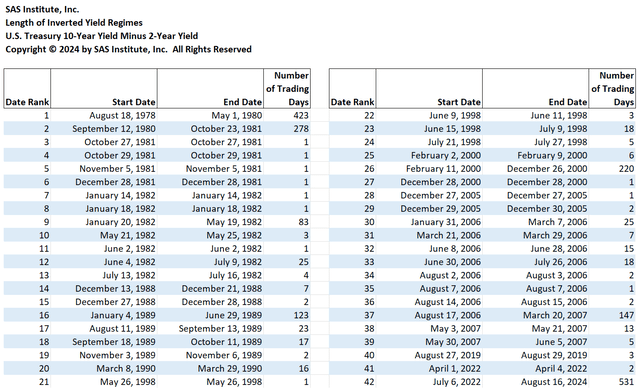
In this week’s forecast, the focus is on three elements of interest rate behavior: the future probability of the recession-predicting inverted yield curve, the probability of negative rates, and the probability distribution of U.S. Treasury yields over the next decade.
We start with the closing U.S. Treasury yield curve, published daily by the U.S. Department of the Treasury. Using a maximum smoothness forward rate approach, Friday’s implied forward rate curve shows a quick rise in 1-month forward rates to an initial peak of 5.47%, versus 5.47% last week. After the initial rise, there is a decline and brief rise until rates peak again at 5.03%, compared to 5.13% for the 30-year horizon.
SAS Institute Inc.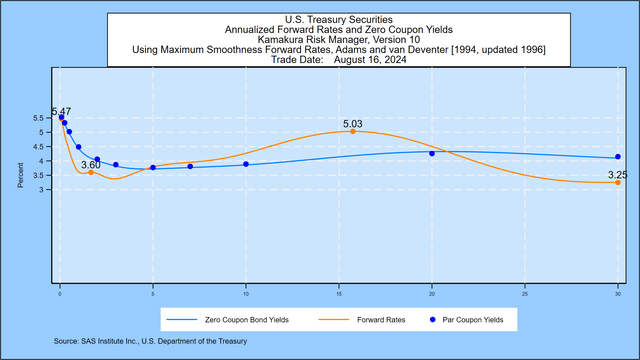
Using the methodology outlined in the appendix, we simulate 100,000 future paths for the U.S. Treasury yield curve out to thirty years. The next three sections summarize our conclusions from that simulation.
Inverted Treasury Yields: Inverted Now, 42.5% Probability by February 14, 2025
Numerous economists have concluded that a downward sloping U.S. Treasury yield curve is an important indicator of future recessions. A recent example is this paper by Alex Domash and Lawrence H. Summers. We measure the probability that the 10-year par coupon Treasury yield is lower than the 2-year par coupon Treasury for every scenario in each of the first 80 quarterly periods in the simulation[1]. The next graph indicates that the probability of an inverted yield now peaks at 42.5%, compared to 36.1% one week before, in the 91-day period ending February 14, 2025.
SAS Institute Inc.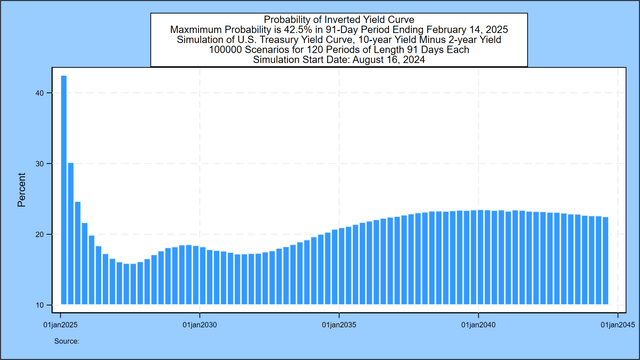
Negative Treasury Bill Yields: 12.3% Probability by October 20, 2045
The next graph describes the probability of negative 3-month Treasury bill rates for all but the first 3 months of the next 3 decades. The probability of negative rates starts near zero and then peaks at 12.3%, compared to 12.2% one week earlier, in the 91-day period ending October 20, 2045
SAS Institute Inc.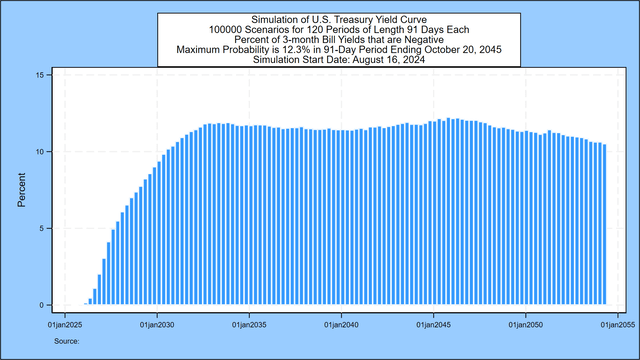
Calculating the Default Risk from Interest Rate Maturity Mismatches
In light of the interest-rate-risk-driven failure of Silicon Valley Bank on March 10, 2023, we have added a table that applies equally well to banks, institutional investor, and individual investor mismatches from buying long-term Treasury bonds with borrowed short-term funds. We assume that the sole asset is a 10-year Treasury bond purchased at time zero at par value of $100. We analyze default risk for four different initial market value of equity to market value of asset ratios: 5%, 10%, 15%, and 20%. For the banking example, we assume that the only class of liabilities is deposits that can be withdrawn at par at any time. In the institutional and retail investor case, we assume that the liability is essentially a borrowing on margin/repurchase agreement with the possibility of margin calls. For all investors, the amount of liabilities (95, 90, 85 or 80) represents a “strike price” on a put option held by the liability holders. Failure occurs via a margin call, bank run, or regulatory takeover (in the banking case) when the value of assets falls below the value of liabilities.
The graph below shows the cumulative 10-year probabilities of failure for each of the 4 possible capital ratios when the asset’s maturity is 10 years. For the 5 percent case, that default probability is 43.99%, compared to 44.31% from last week.
SAS Institute Inc.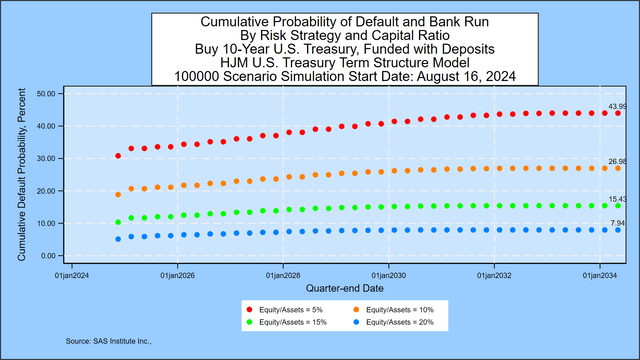
This default probability analysis is updated weekly based on the U.S. Treasury yield simulation described in the next section. The calculation process is the same for any portfolio of assets with credit risk included.
U.S. Treasury Probabilities 10 Years Forward
In this section, the focus turns to the decade ahead. This week’s simulation shows that the most likely range for the 3-month U.S. Treasury bill yield in ten years is from 0% to 1%, unchanged from last week. There is a 25.11% probability that the 3-month yield falls in this range, a change from 24.94% one week before. For the 10-year Treasury yield, the most likely range is from 2% to 3%, also unchanged from last week. The probability of being in this range is 22.57%, compared to 22.29% one week prior.
In a recent post on Seeking Alpha, we pointed out that a forecast of “heads” or “tails” in a coin flip leaves out critical information. What a sophisticated bettor needs to know is that, on average for a fair coin, the probability of heads is 50%. A forecast that the next coin flip will be “heads” is literally worth nothing to investors because the outcome is purely random.
The same is true for interest rates.
In this section, we present the detailed probability distribution for both the 3-month Treasury bill rate and the 10-year U.S. Treasury yield 10 years forward using semi-annual time steps.[2] We present the probability of where rates will be at each time step in 1 percent “rate buckets.” The forecast for 3-month Treasury yields is shown in this graph:
SAS Institute Inc.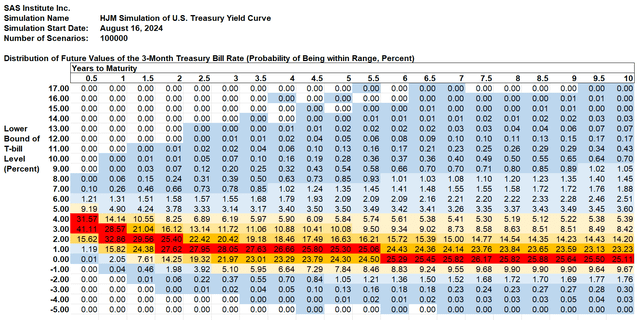
3-Month U.S. Treasury Yield Data:
The probability that the 3-month Treasury bill yield will be between 1% and 2% in 2 years is shown in column 4: 27.62%. The probability that the 3-month Treasury bill yield will be negative (as it has often been in Europe and Japan) in 2 years is 1.98% plus 0.06% plus 0.00% = 2.03% (difference due to rounding). Cells shaded in blue represent positive probabilities of occurring, but the probability has been rounded to the nearest 0.01%. The shading scheme works like this:
- Dark blue: the probability is greater than 0% but less than 1%
- Light blue: the probability is greater than or equal to 1% and less than 5%
- Light yellow: the probability is greater than or equal to 5% and 10%
- Medium yellow: the probability is greater than or equal to 10% and less than 20%
- Orange: the probability is greater than or equal to 20% and less than 25%
- Red: the probability is greater than 25%.
The chart below shows the same probabilities for the 10-year U.S. Treasury Yield (US10Y) derived as part of the same simulation.
SAS Institute Inc.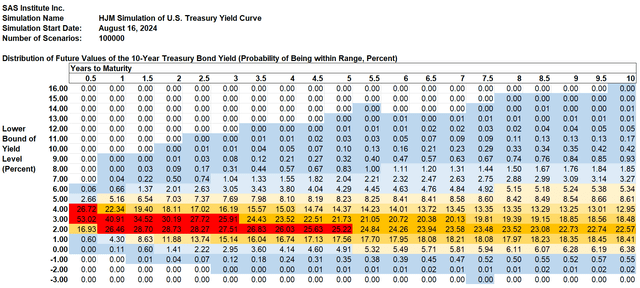
10-Year US Treasury Yield Data:
Appendix: Treasury Simulation Methodology
The probabilities are derived using the same methodology that SAS Institute Inc. recommends to its KRIS® and Kamakura Risk Manager® clients. A moderately technical explanation is given later in the appendix, but we summarize it in plain English first.
Step 1: We take the closing U.S. Treasury yield curve as our starting point.
Step 2: We use the number of points on the yield curve that best explains historical yield curve shifts. Using daily government bond yield data from 14 countries from 1962 through June 30, 2024, we conclude that 12 “factors” drive almost all movements of government bond yields. The countries on which the analysis is based are Australia, Canada, France, Germany, Italy, Japan, New Zealand. Russia, Singapore, Spain, Sweden, Thailand, the United Kingdom, and the United States of America. No data from Russia is included after January 2022.
Step 3: We measure the volatility of changes in those factors and how volatility has changed over the same period.
Step 4: Using those measured volatilities, we generate 100,000 random shocks at each time step and derive the resulting yield curve.
Step 5: We “validate” the model to make sure that the simulation EXACTLY prices the starting Treasury curve and that it fits history as well as possible. The methodology for doing this is described below.
Step 6: We take all 100,000 simulated yield curves and calculate the probabilities that yields fall in each of the 1% “buckets” displayed in the graph.
Do Treasury Yields Accurately Reflect Expected Future Inflation?
We showed in a recent post on Seeking Alpha that, on average, investors have almost always done better by buying long-term bonds than by rolling over short-term Treasury bills. That means that market participants have generally (but not always) been accurate in forecasting future inflation and adding a risk premium to that forecast.
The distribution above helps investors estimate the probability of success from going long.
Finally, as mentioned weekly in the Corporate Bond Investor Friday overview, the future expenses (both the amount and the timing) that all investors are trying to cover with their investments are an important part of investment strategy. The author follows his advice: cover the short-term cash needs first, and then step out to cover more distant cash needs as savings and investment returns accumulate.
Technical Details
Daily government bond yields from the 14 countries listed above form the base historical data for fitting the number of yield curve factors and their volatility. The U.S. historical data is provided by the U.S. Department of the Treasury. The use of the international bond data increases the number of observations to more than 107,000 and provides a more complete range of experience with both high rates and negative rates than a U.S. data set alone provides.
The modeling process was published in a significant paper by David Heath, Robert Jarrow and Andrew Morton in 1992:
Econometrica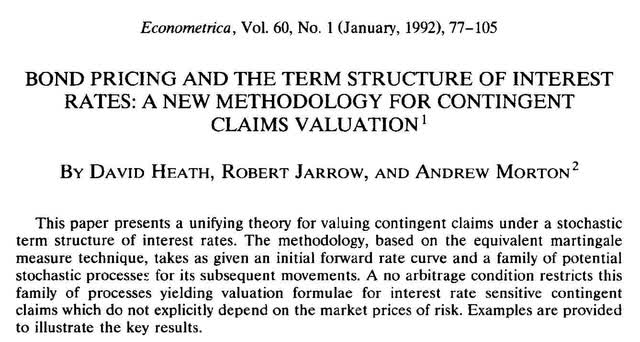
Professor Jarrow’s biography is available here.
For technically inclined readers, we recommend Prof. Jarrow’s book Modeling Fixed Income Securities and Interest Rate Options for those who want to know exactly how the “HJM” model construction works.
Prof. Robert Jarrow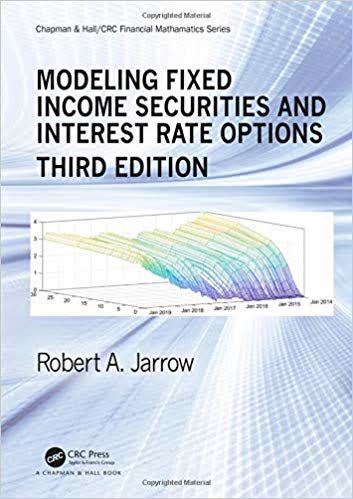
The number of factors, 12 for the 14-country model, has been stable since June 30, 2017. The volatilities for each factor are updated monthly and available to subscribers to the KRIS interest rate and macro-factor data service.
Footnotes:
[1] After the first 20 years in the simulation, the 10-year Treasury cannot be derived from the initial 30 years of Treasury yields.
[2] The full simulation uses 91-day time steps for 30 years forward. This note summarizes just the first 10 years of the full simulation.
Credit: Source link