

















• bitcoinBitcoin(BTC)$77,336.00-1.19%
  • ethereumEthereum(ETH)$2,242.66-0.02%
  • tetherTether(USDT)$1.000.04%
  • binancecoinBNB(BNB)$700.24-1.47%
  • rippleXRP(XRP)$1.24-1.00%
  • usd-coinUSDC(USDC)$1.000.04%
  • solanaSolana(SOL)$95.66-2.22%
  • tronTRON(TRX)$0.322661-2.86%
  • Figure HelocFigure Heloc(FIGR_HELOC)$1.03-0.21%
  • zcashZcash(ZEC)$1,272.380.68%
  • HyperliquidHyperliquid(HYPE)$88.32-3.96%
  • dogecoinDogecoin(DOGE)$0.075232-1.00%
  • moneroMonero(XMR)$595.381.32%
  • USDSUSDS(USDS)$1.000.27%
  • whitebitWhiteBIT Coin(WBT)$74.21-0.86%
  • chainlinkChainlink(LINK)$11.402.68%
  • leo-tokenLEO Token(LEO)$9.440.05%
  • cardanoCardano(ADA)$0.193174-0.08%
  • stellarStellar(XLM)$0.1685720.99%
  • bitcoin-cashBitcoin Cash(BCH)$289.882.09%
  • nearNEAR Protocol(NEAR)$4.300.67%
  • daiDai(DAI)$1.000.04%
  • Ethena USDeEthena USDe(USDE)$1.000.08%
  • RainRain(RAIN)$0.006217-3.57%
  • uniswapUniswap(UNI)$7.014.22%
  • litecoinLitecoin(LTC)$54.98-1.95%
  • USD1USD1(USD1)$1.00-0.02%
  • CantonCanton(CC)$0.0959390.92%
  • avalanche-2Avalanche(AVAX)$8.48-1.12%
  • suiSui(SUI)$0.900.60%
  • the-open-networkGram (prev. Toncoin)(GRAM)$1.18-0.18%
  • hedera-hashgraphHedera(HBAR)$0.0713160.38%
  • tether-goldTether Gold(XAUT)$3,875.77-2.81%
  • Global DollarGlobal Dollar(USDG)$1.00-0.01%
  • paypal-usdPayPal USD(PYUSD)$1.000.20%
  • quant-networkQuant(QNT)$192.70-1.69%
  • shiba-inuShiba Inu(SHIB)$0.0000051.11%
  • BittensorBittensor(TAO)$235.93-0.49%
  • crypto-com-chainCronos(CRO)$0.051532-0.11%
  • EthenaEthena(ENA)$0.1938982.22%
  • Ripple USDRipple USD(RLUSD)$1.00-0.01%
  • Ondo US Dollar YieldOndo US Dollar Yield(USDY)$1.150.12%
  • Circle USYCCircle USYC(USYC)$1.140.03%
  • okbOKB(OKB)$110.64-2.05%
  • MemeCoreMemeCore(M)$0.95-6.11%
  • pepePepe(PEPE)$0.0000053.96%
  • aaveAave(AAVE)$131.985.07%
  • OndoOndo(ONDO)$0.4163625.89%
  • BlackRock USD Institutional Digital Liquidity FundBlackRock USD Institutional Digital Liquidity Fund(BUIDL)$1.000.00%
  • Pump.funPump.fun(PUMP)$0.0040750.00%
TradePoint.io
  • Main
  • AI & Technology
  • Stock Charts
  • Market & News
  • Business
  • Finance Tips
  • Trade Tube
  • Blog
  • Shop
No Result
View All Result
TradePoint.io
No Result
View All Result

Warning Signs For A Breakdown Of Order For The S&P 500

August 6, 2024
in Market & News
Reading Time: 3 mins read
A A
Warning Signs For A Breakdown Of Order For The S&P 500
ShareShareShareShareShare

MicroStockHub/iStock via Getty Images

YOU MAY ALSO LIKE

Women fighting for seats in the AI industry as tech jobs surge

FBI whistleblower: WH pushed unconstitutional investigation into protesters

With the S&P 500 (SPX) having tumbled some 480 points from its 16 July 2024 record high of 5,667.20 as of Monday, 5 August 2024, it’s a good time to consider whether order might be starting to break down within the U.S. stock market.

That’s especially true because the Nasdaq (COMP:IND) has fallen more dramatically in the last several weeks, entering into correction after dropping by more than 10%. Since many of the biggest stocks within the S&P 500 are even more heavily weighted in the Nasdaq Composite Index, it’s very possible the S&P is well on its way to seeing its established state of order come to an end.

As best as we can tell, that relative period of order began on 30 September 2022 and has continued, so far, through the present. As of 5 August 2024, the S&P 500 would have to fall at least another 153 points in short order to throw up an official warning sign that the market’s current state of order is breaking down. The following chart shows how the current period of relative order for the S&P 500 has evolved, the warning sign that would be triggered would be the value of the S&P 500 dropping below its lower red-dashed curve:
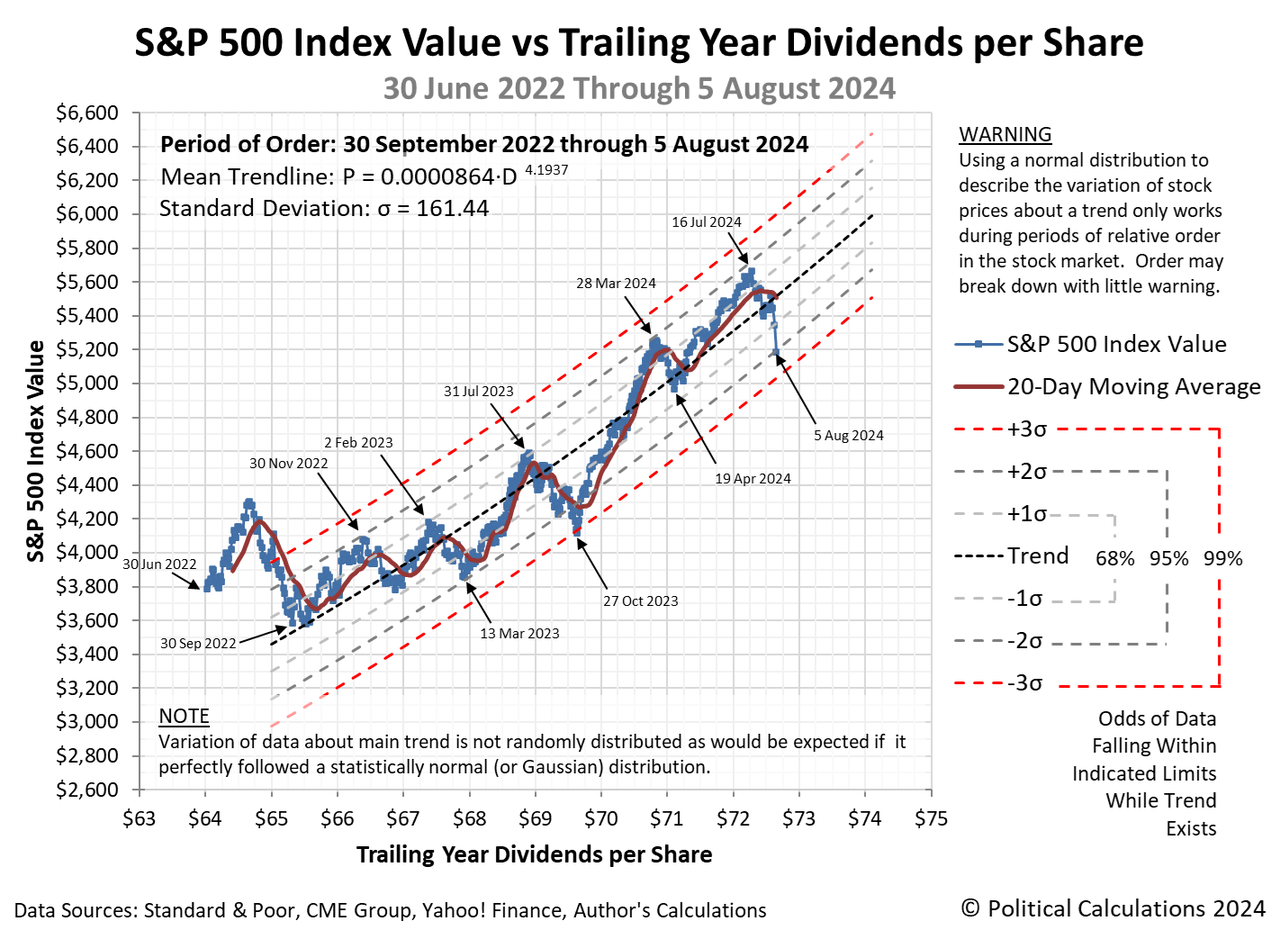
S&P 500 Index Value vs Trailing Year Dividends per Share: 30 June 2022 through 5 August 2024

That the current period of relative order in the stock market has broken down would be confirmed by the 20-day moving average for the S&P 500 falling almost 480 points from its current level to cross below the lower red-dashed curve on this chart.

When that happens, the U.S. stock market will most likely enter into a new chaotic period. As the note on the chart indicates, that change of state can happen with very little warning.

Postscript

Most of the preceding text of this article was drafted on Saturday, 3 August 2024, well ahead of the implosion of Japan’s stock market on Monday, 5 August 2024 and the U.S. stock market’s reaction to the impact of that new information event. Other than updating the chart and adjusting some numbers in the text, we didn’t have to change much of what we had already written.

That said, If the day-to-day change in stock prices continues to be interesting (changing by more than two percent from the previous day’s close), you can use the chart with the latest value of the S&P 500 index to see how close the index is to signaling a breakdown of order in the U.S. stock market. Find the marked data point for 5 August 2024 on the chart, imagine a vertical line passing through it, then point to the position of the latest value of the S&P 500 on that vertical line to see whether it’s above or below that lower red-dashed curve. Falling below that curve is the warning sign.

The confirmation that order has broken down will take longer to play out, since that data is determined by a 20-day moving average. Until then, if the daily value of the index drops below the red-dashed curve and stays below it for many days on end, it would only be a matter of time.

Original Post

Editor’s Note: The summary bullets for this article were chosen by Seeking Alpha editors.

Credit: Source link

ShareTweetSendSharePin

Related Posts

Women fighting for seats in the AI industry as tech jobs surge
Market & News

Women fighting for seats in the AI industry as tech jobs surge

October 31, 2026
FBI whistleblower: WH pushed unconstitutional investigation into protesters
Market & News

FBI whistleblower: WH pushed unconstitutional investigation into protesters

October 31, 2026
Aehr Test Systems: Too Many Variables In Grasping The Addressable Market (NASDAQ:AEHR)
Market & News

Aehr Test Systems: Too Many Variables In Grasping The Addressable Market (NASDAQ:AEHR)

October 31, 2026
Video shows moment of deadly Florida bus crash
Market & News

Video shows moment of deadly Florida bus crash

October 31, 2026
Next Post
NuMind Released: Empowering Custom NLP Model Creation with In-House Foundation Models and Active Learning for Over 10 Industries and Languages

NuMind Released: Empowering Custom NLP Model Creation with In-House Foundation Models and Active Learning for Over 10 Industries and Languages

Leave a Reply Cancel reply

Your email address will not be published. Required fields are marked *

Search

No Result
View All Result
Judge halts Trump administration from clearing trees at D.C. golf course

Judge halts Trump administration from clearing trees at D.C. golf course

October 26, 2026
Zacharia only calls on conservative outlets in first WH press briefing

Zacharia only calls on conservative outlets in first WH press briefing

October 26, 2026
Six frontline Republicans to watch as GOP fights to keep control of the House

Six frontline Republicans to watch as GOP fights to keep control of the House

October 26, 2026

About

Learn more

Our Services

Legal

Privacy Policy

Terms of Use

Bloggers

Learn more

Article Links

Contact

Advertise

Ask us anything

©2020- TradePoint.io - All rights reserved!

Tradepoint.io, being just a publishing and technology platform, is not a registered broker-dealer or investment adviser. So we do not provide investment advice. Rather, brokerage services are provided to clients of Tradepoint.io by independent SEC-registered broker-dealers and members of FINRA/SIPC. Every form of investing carries some risk and past performance is not a guarantee of future results. “Tradepoint.io“, “Instant Investing” and “My Trading Tools” are registered trademarks of Apperbuild, LLC.

This website is operated by Apperbuild, LLC. We have no link to any brokerage firm and we do not provide investment advice. Every information and resource we provide is solely for the education of our readers. © 2020 Apperbuild, LLC. All rights reserved.

No Result
View All Result
  • Main
  • AI & Technology
  • Stock Charts
  • Market & News
  • Business
  • Finance Tips
  • Trade Tube
  • Blog
  • Shop

© 2023 - TradePoint.io - All Rights Reserved!