

Huang Evan
War-related charts are not backing down, and this tells me that geopolitical tensions could be more severe than initially feared.
To provide some context on the price action, geopolitical tensions between Israel and Palestine first hit the headlines on 7-8 October, which was a weekend.
US stock markets gapped lower on Monday, but managed to recover to more than wipe out those losses.
However, it has come to my attention that war-related charts are not reversing their initial moves. In fact, they appear to be consolidating nicely for a continuation move. This has risk-off connotations, and I would suggest erring on the side of caution until there is more clarity.
The first war-related chart is that of gold (NYSEARCA:GLD).
XAU/USD turned lower at a resistance zone on Thursday (12 October) after a stronger-than-expected CPI print. This appeared to put a dent in its recent rally, which started on Monday after the weekend war headlines.
However, we may observe that gold staged a powerful comeback on Friday (13 October), more than erasing the post-CPI losses. In fact, it is surging aggressively towards resistance (horizontal and downtrend). This tells me gold wants to move higher in a hurry, and it may surprise the market if it slices through the resistance quickly.
Daily Chart: XAU/USD
Tradingview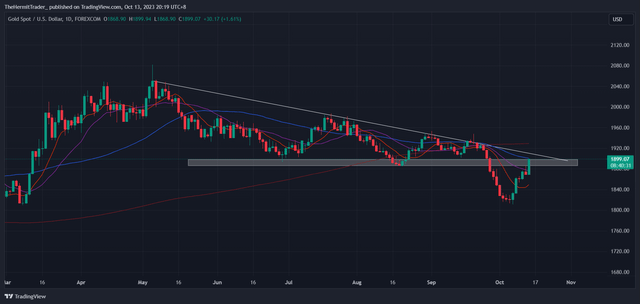
Next, Israel-related equities and FX look likely to weaken further.
The Shekel weakened from 3.84 against the USD to as high as 3.98 after the weekend war news broke. Since then, USD/ILS has shown no signs of exhaustion, and is consolidating nicely at the highs of this range. Technically, USD/ILS looks ready to push higher.
Daily Chart: USD/ILS
Tradingview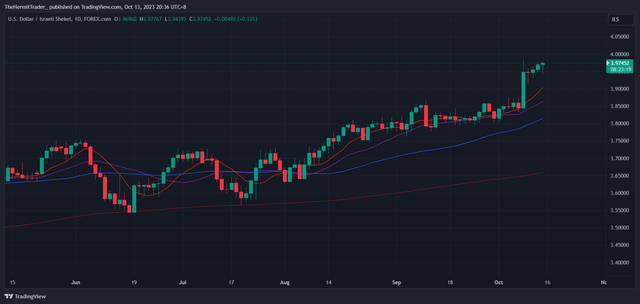
The ARK Israel Innovative Technology ETF (IZRL) is hurtling towards key multi-month supports that have been in place since October 2022. They look very fragile, and are likely to be tested in the coming days.
Daily Chart: IZRL
Tradingview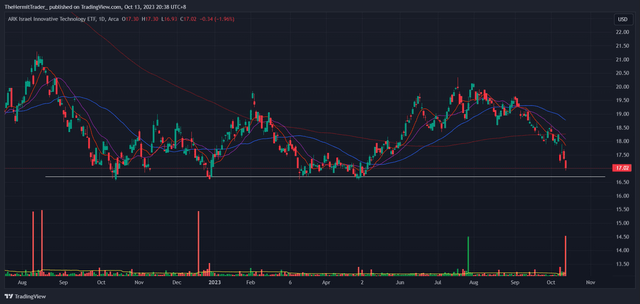
Next, defense-related names popped on the weekend war news, and are not backing down. Instead, they are tightening up and digesting the move. Names like Lockheed Martin (LMT), Northrop Grumman (NOC) and General Dynamics (GD) look ready to make the next continuation move higher.
Daily Chart: LMT
Tradingview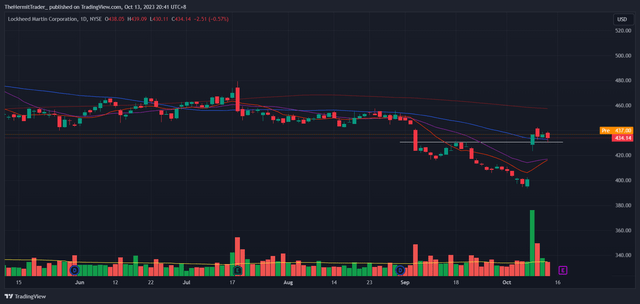
Daily Chart: NOC
Tradingview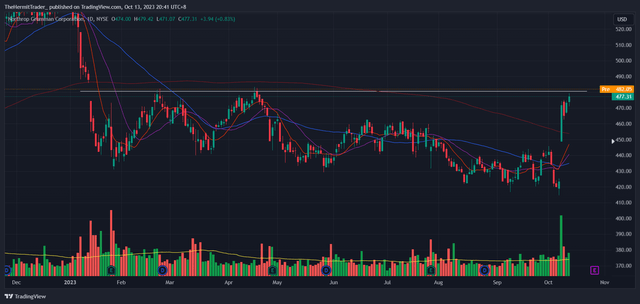
Daily Chart: GD
Tradingview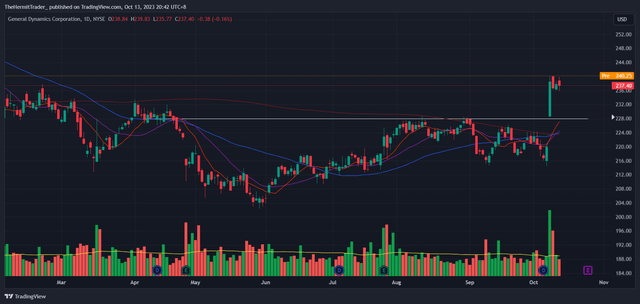
Since the weekend war news, uranium miners (URA) have been showing relative weakness. Prior to that, the energy theme involving uranium, oil & gas, and coal has been strong, which was my strong conviction call I wrote about in articles here and here.
While the war news has lifted the oil & gas sector, as seen from the VanEck Oil Services ETF (OIH), URA has actually traded lower and is tracing out what looks like an early-stage head and shoulders bearish pattern (only confirmed if neckline is broken).
Could the market be concerned that geopolitical tensions may spiral into a nuclear war in the worst case scenario? Even if nuclear weapons were being talked about in the headlines, who would dare own uranium stocks?
Daily Chart: URA
Tradingview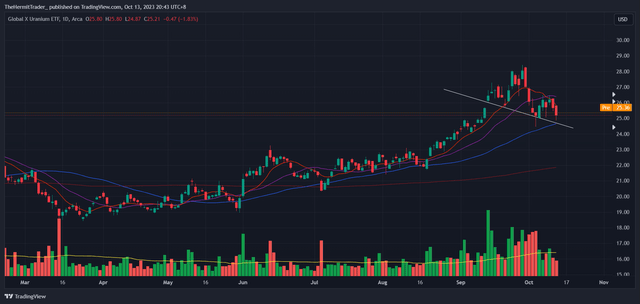
Daily Chart: OIH
Tradingview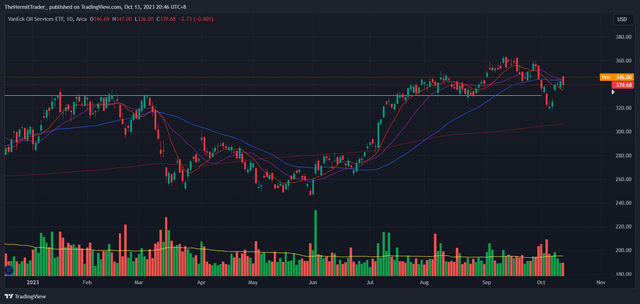
Since the weekend war news, technology stocks have performed well, especially cybersecurity names like Palo Alto Networks (PANW), CrowdStrike (CRWD), NVIDIA (NVDA), and Palantir (PLTR).
These stocks / sectors and their products are involved in defense or military applications and systems, which could explain their strength. Below, I show the strong breakouts in the four stocks.
PANW, CRWD, NVDA and PLTR are up +5.7%, +6.2%, +2.6%, and +8% respectively for the week so far, compared to less than +1% for the S&P 500 (SPY).
Daily Chart: PANW
Tradingview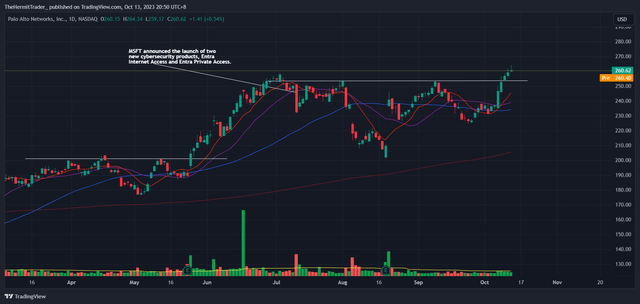
Daily Chart: CRWD
Tradingview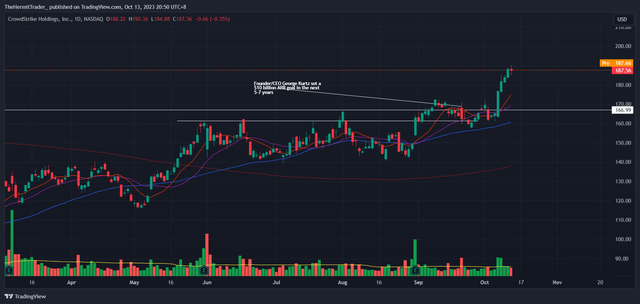
Daily Chart: NVDA
Tradingview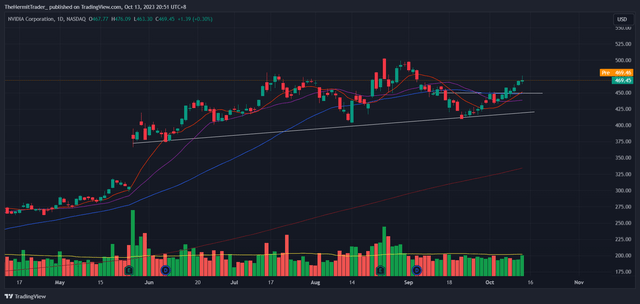
Daily Chart: PLTR
Tradingview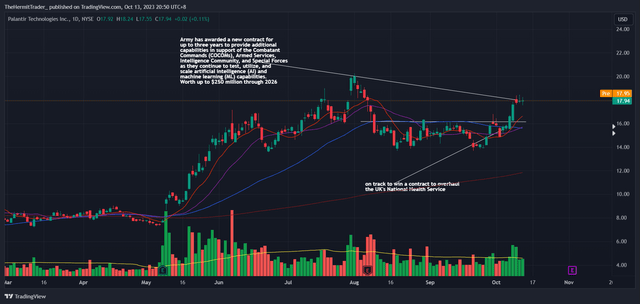
From here, I am closely monitoring Treasuries and the Japanese Yen.
The market is extremely short US Treasuries, and a potential escalation in geopolitical tensions may lead to a short covering rally in Treasury bonds.
I previously wrote in September here that it was too early to buy in to the iShares 20+ Year Treasury Bond ETF (TLT), and I was expecting it to make new all-time lows. Since then, TLT was 5% away from new lows, and I now think TLT has a good chance to rally from here if war-related charts make continuation moves.
Goldman Sachs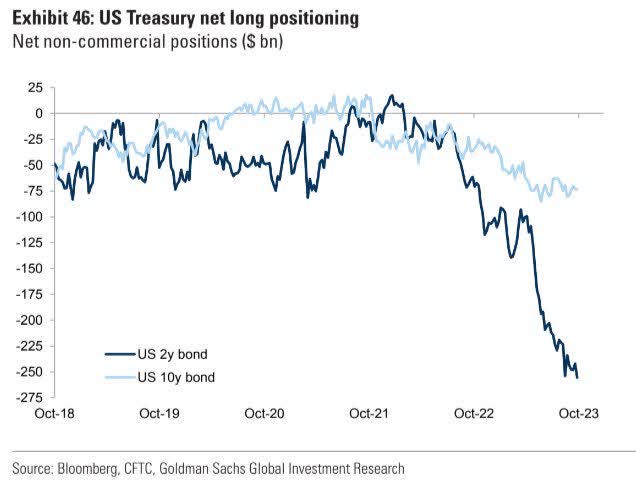
Weekly Chart: TLT
Tradingview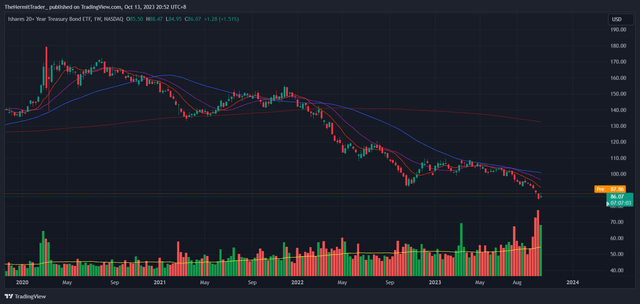
The Japanese Yen has been on a free fall for close to two years. Against the USD, it is now testing October 2022 lows. An escalation in geopolitical tensions would likely cause the JPY to strengthen due to unwinding of FX carry trades. If gold and Treasuries rally, JPY would most likely follow suit.
Weekly Chart: USD/JPY
Tradingview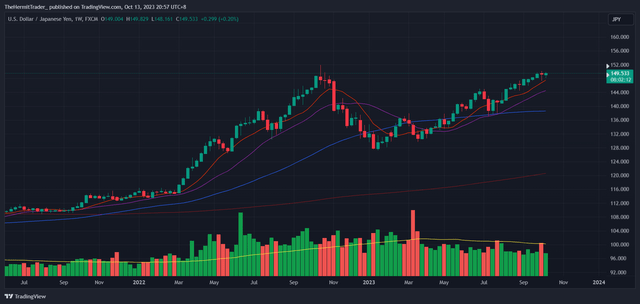
Overall, war-related charts do not look exhausted after their initial moves on Monday after the Israel-Palestine conflict hit the headlines over the weekend.
Gold in particular, stands out for its strength in the face of resistance. I wrote back in September here that the long term charts of precious metals are bullish, but we are lacking a buy setup on the shorter term daily charts.
While the focus of my article was on Silver (SLV), the thesis applies to gold as well. Since the gold to silver ratio has now broken out to the upside, my preference is to buy gold over silver.
Daily Chart: Gold to Silver Ratio
Tradingview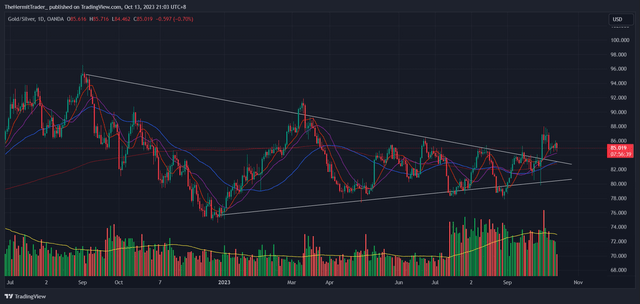
The SPDR Gold Trust provides a liquid and convenient way to be long gold. Similar to gold futures, GLD is testing the same resistance zone.
Daily Chart: GLD
Tradingview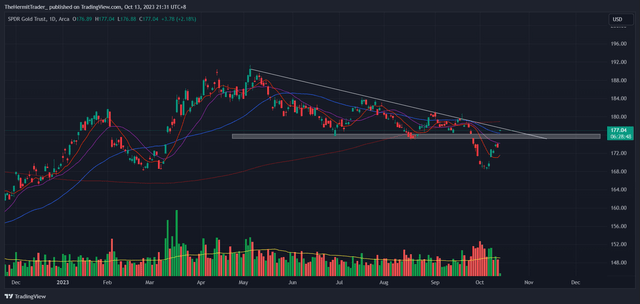
On the long term monthly chart, we can see GLD building out a massive 12 year base that has been in play since September 2011. The larger the base, the higher in space. This means that if a breakout does occur above the $187 pivot for GLD, we can expect a very powerful uptrend with little or no overhead resistance to obstruct prices.
Monthly Chart: GLD
Tradingview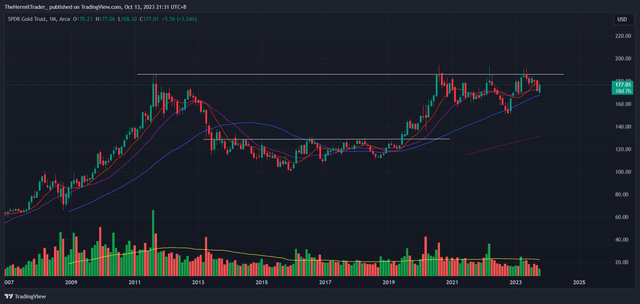
Credit: Source link