
Tero Vesalainen
Investment Thesis
This article will detail two reasons for my “sell” recommendation for the Vanguard Russell 2000 Index ETF (NASDAQ:VTWO). The first reason is that VTWO is less discounted than other analysts suggest, and it relates to the calculation method used for common ratios like price earnings. Second, VTWO has a low 4.99% net income margin and a poor 5.88/10 sector-adjusted profit score, indicating it’s mostly speculative. History suggests this plain-vanilla strategy does not work well for small-caps, and I will highlight four other ETFs that do a better job on both fundamentals and performance. I hope you enjoy the read.
VTWO Overview
Strategy Discussion
VTWO seeks to track the performance of the Russell 2000 Index, a subset of the Russell 3000 Index that comprises approximately 7% of the parent Index and includes about 2,000 of the smallest companies by market cap. The average size is $1.5 billion, but since the Index is market-cap-weighted, the most prominent companies have an outsized effect. VTWO’s top ten holdings are listed below, led by Super Micro Computer (SMCI), a stock that’s seen its price grow by 500% over the last year. I expect SMCI to graduate to the Russell 1000 Index at the subsequent reconstitution.
Vanguard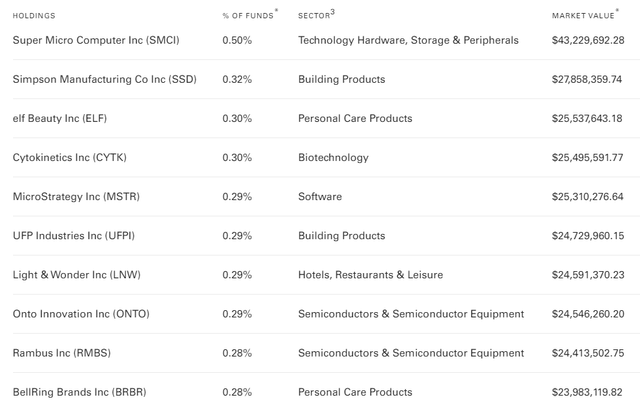
These top ten holdings have market caps above $7 billion and could also move to the Russell 1000 Index shortly. These reconstitutions provide investors with steady exposure to small-cap stocks and effectively allow for some regular profit-taking. The offset is when poor-performing Russell 1000 stocks are downgraded. MicroStrategy (MSTR) is one example of a stock that was dropped last June, and it remains down 18.78% over the last three years.
VTWO is the cheapest Russell 2000 Index ETF, as its expense ratio is just 0.10% compared to 0.19% for the iShares Russell 2000 Index ETF (IWM). Despite this, VTWO’s $8.37 billion in assets under management is a small fraction of IWM’s $62.34 billion, likely because IWM launched ten years prior. Still, new shareholders have few reasons to select IWM over VTWO, illustrated well by their results since VTWO’s September 2010 launch. As shown below, VTWO has a 0.05% annualized edge over IWM, outperforming 8/13 years between 2011 and 2023.
Portfolio Visualizer
Performance Analysis
These returns require context because, as I highlighted in my comprehensive review of small-cap ETFs two weeks ago, dozens of better-performing alternatives exist. For example, VTWO’s ten-year total return through December 2023 is 101%, but S&P SmallCap 600 Index ETFs IJR and VIOO gained 128%. Alternatively, the Vanguard Small Cap ETF (VB), which tracks a CRSP Index, gained 125%. Finally, there are a host of new offerings combining features like value/momentum (XSVM) and value/quality (CALF). These results suggest better approaches, and while buying low-cost Index funds works for large-cap stocks, it does not for small-caps.
Portfolio Visualizer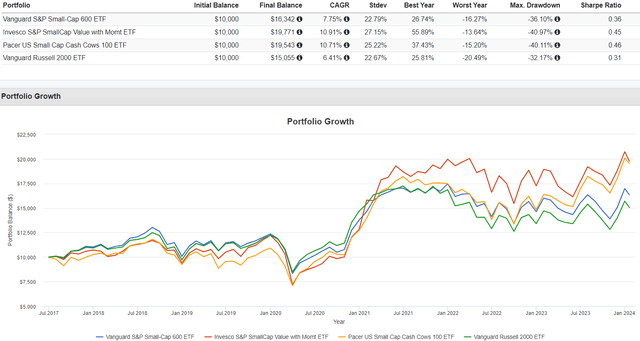
Why VTWO Doesn’t Work: 2 Reasons
VTWO doesn’t work for two reasons. First, there are a limited number of profitability screens. S&P Dow Jones Indices highlighted this in a September 2019 report titled A Tale of Two Small-Cap Benchmarks: 10 Years Later. Here’s an excerpt:
A study performed by S&P Dow Jones Indices (S&P DJI) in 2009 (Dash and Soe) showed that return differences were primarily due to the inclusion of a profitability factor embedded in the S&P SmallCap 600. A later update of the study in 2014 (Brzenk and Soe) confirmed the continuing existence of the quality premium.
Second, VTWO is not necessarily deeply discounted. While some reports like this one suggest a small-cap discount of 25% compared to large-caps, this result should not automatically extend to the Russell 2000 Index because of its lack of profitability screen. Providers like Morningstar exclude non-profitable companies when calculating the P/Es of a portfolio, of which there are 827 in VTWO, or 24.73% of the fund by weight. Morningstar also limits a stock’s P/E to 60, which impacts another 84 stocks, or 6.18% by weight. The figures are 86 (2.11%) and 61 (6.65%) for the Vanguard Russell 1000 ETF (VONE), so it’s not a fair apples-to-apples comparison. Here are four different calculations of VTWO’s vs. VONE’s forward P/E:
- Weighted Average With 60 Cap: 21.50x vs. 28.21x
- Harmonic Average With 60 Cap: 14.28x vs. 21.01x
- Weighted Average With 60 Cap For Non-Profitable: 17.60x vs. 28.88x
- Harmonic Average With 60 Cap For Non-Profitable: 31.02x vs. 21.30x
Method #2 aligns with Morningstar’s calculations and suggests VTWO is 32% undervalued compared to VONE. However, readers should also give weight to the last calculation, which suggests VTWO is 46% overvalued compared to VONE. This approach, which effectively punishes non-profitable stocks by assigning a 60 P/E, might be more reasonable due to VTWO’s composition. Much like value investors don’t typically rely on a single metric (P/E, P/S, P/B, P/CF) to assess valuation, they should not rely on a single calculation method.
VTWO Fundamentals By Sub-Industry
The following table highlights selected fundamental metrics by sub-industry for VTWO compared to VIOO, VB, XSVM, and CALF, with observations to follow:
The Sunday Investor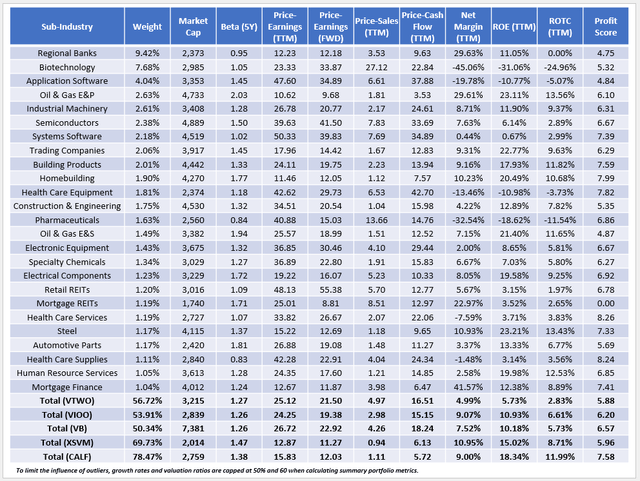
1. VTWO has a $3.22 billion weighted average market cap, which should change when the Index reconstitutes in June. VB’s $7.38 billion market cap is the highest, as CRSP Indexes allow some crossover with the mid-cap Index. Finally, XSVM and CALF select from the S&P SmallCap 600 Index, so comparing their fundamentals with VIOO is most appropriate.
2. I used the weighted average method with a 60 cap, or method #1 when calculating valuation ratios. Even after excluding non-profitable socks, VTWO’s trailing P/E, forward P/E, and trailing P/CF ratios are about 1-2 points more than VIOO’s. Furthermore, its 4.97 P/S ratio is substantially higher, partially due to VTWO’s high 7.68% concentration in Biotechnology. VTWO holds 217 stocks in this sub-industry, and 201 have negative net margins. In contrast, the profitability screens described earlier for the S&P SmallCap 600 Index limit exposure in VIOO to 2.30%. CALF, the most profitable ETF in this sample, has only 0.37% exposure to these stocks.
3. I derived a 5.88/10 profit score for VTWO using Seeking Alpha Factor Grades, the lowest in the sample. XSVM’s 5.96/10 score is close and, at first glance, doesn’t align with its 10.95% net margins, which are more than double VTWO’s. However, these scores are sector-adjusted. Effectively, XSVM achieves these high margins by overweighting highly profitable sectors rather than selecting the most profitable stocks in each sector. This lack of diversification is a cost that’s difficult to measure but is evident based on its high concentration (69.73%) in its top 25 sub-industries.
4. VTWO’s return on assets and total capital figures aren’t impressive either. It is not shown, but the ETF’s Regional Bank holdings have only a 1.11% return on assets, a key screen used by OUSM to avoid the sub-industry’s crisis last year. There is a value play, but based on poor profitability, it’s also speculative, and I suggest limiting exposure to Regional Banks.
Investment Recommendation
I recommend readers sell VTWO in favor of any of the four alternatives listed above. The reason is that VTWO is not a compelling value opportunity, and based on its poor profitability metrics, it’s mostly a speculative play. Investors can gain better and more predictable returns with funds like XSVM and CALF, which are designed to score well on multiple factors. While their expense ratios may be a deterrent, these ETFs have proven their worth by outperforming VTWO by 3% per year over the last seven years, demonstrating that plain-vanilla strategies in the small-cap space don’t work as well.
Thank you for reading.
Credit: Source link