
• bitcoinBitcoin(BTC)$86,213.00-0.71%
  • ethereumEthereum(ETH)$2,749.25-1.00%
  • tetherTether(USDT)$1.000.01%
  • binancecoinBNB(BNB)$784.57-2.41%
  • rippleXRP(XRP)$1.572.68%
  • usd-coinUSDC(USDC)$1.000.01%
  • solanaSolana(SOL)$117.88-0.85%
  • tronTRON(TRX)$0.341795-0.67%
  • zcashZcash(ZEC)$1,514.614.31%
  • Figure HelocFigure Heloc(FIGR_HELOC)$1.042.51%
  • HyperliquidHyperliquid(HYPE)$96.793.74%
  • dogecoinDogecoin(DOGE)$0.0999240.15%
  • moneroMonero(XMR)$567.14-3.74%
  • whitebitWhiteBIT Coin(WBT)$86.68-0.78%
  • chainlinkChainlink(LINK)$12.95-1.24%
  • USDSUSDS(USDS)$1.00-0.01%
  • cardanoCardano(ADA)$0.2515572.53%
  • RainRain(RAIN)$0.013089-6.34%
  • leo-tokenLEO Token(LEO)$8.980.71%
  • stellarStellar(XLM)$0.2146610.57%
  • bitcoin-cashBitcoin Cash(BCH)$339.8227.36%
  • uniswapUniswap(UNI)$9.477.53%
  • nearNEAR Protocol(NEAR)$4.295.33%
  • Ethena USDeEthena USDe(USDE)$1.000.01%
  • avalanche-2Avalanche(AVAX)$11.01-0.90%
  • litecoinLitecoin(LTC)$62.490.28%
  • daiDai(DAI)$1.00-0.01%
  • CantonCanton(CC)$0.113416-2.62%
  • USD1USD1(USD1)$1.00-0.02%
  • hedera-hashgraphHedera(HBAR)$0.0992908.09%
  • suiSui(SUI)$1.01-1.05%
  • the-open-networkGram (prev. Toncoin)(GRAM)$1.45-0.37%
  • shiba-inuShiba Inu(SHIB)$0.0000061.46%
  • BittensorBittensor(TAO)$308.171.11%
  • crypto-com-chainCronos(CRO)$0.0663051.84%
  • Global DollarGlobal Dollar(USDG)$1.000.00%
  • MemeCoreMemeCore(M)$1.31-11.86%
  • paypal-usdPayPal USD(PYUSD)$1.000.00%
  • tether-goldTether Gold(XAUT)$4,355.920.29%
  • okbOKB(OKB)$122.48-0.81%
  • Circle USYCCircle USYC(USYC)$1.140.01%
  • Ripple USDRipple USD(RLUSD)$1.000.03%
  • BitwayBitway(BTW)$0.873.79%
  • BlackRock USD Institutional Digital Liquidity FundBlackRock USD Institutional Digital Liquidity Fund(BUIDL)$1.000.00%
  • Ondo US Dollar YieldOndo US Dollar Yield(USDY)$1.140.36%
  • aaveAave(AAVE)$144.45-0.73%
  • mantleMantle(MNT)$0.672.64%
  • OndoOndo(ONDO)$0.435397-3.97%
  • EthenaEthena(ENA)$0.208522-1.02%
  • Pump.funPump.fun(PUMP)$0.0044934.07%
TradePoint.io
  • Main
  • AI & Technology
  • Stock Charts
  • Market & News
  • Business
  • Finance Tips
  • Trade Tube
  • Blog
  • Shop
No Result
View All Result
TradePoint.io
No Result
View All Result

Volatility And The Decline In Bond Market Yields

August 21, 2024
in Market & News
Reading Time: 5 mins read
A A
Volatility And The Decline In Bond Market Yields
ShareShareShareShareShare

DNY59

YOU MAY ALSO LIKE

NBC Nightly News with Tom Llamas Full Episode – Aug. 26

Kohberger granted new hearing to withdraw guilty plea

My last two posts have dealt with investor changes in financial markets that have impacted the recent performance of the markets and have implications for the future behavior of these markets.

The first of these posts dealt with changes in the volatility of stock prices and reflected the changing investor view concerning the uncertainty of future stock market changes.

The second post focused more on the market uncertainty created by the presidential election and what might happen to stock prices following the completion of voting.

The basic premise of the two articles was that something changed in July, and the change was significant enough that investors needed to fully absorb the rising uncertainties in their portfolio decisions going forward.

This current post is a follow-up to the market results reviewed in these first two efforts.

Again, the focus is on July…and, more specifically, the time immediately following the Republican convention.

More specifically, the time when President Joe Biden took himself out of the presidential contest and suggested that the vice president, Kamala Harris, become the nominee of the Democratic Party for president.

Let’s look at this other evidence.

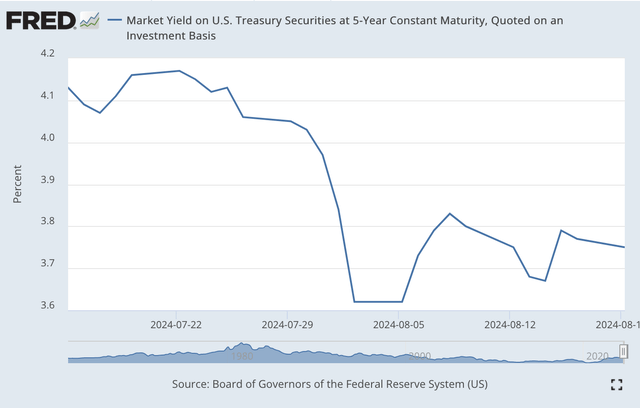
The following charts represent the performance of the yields on the 5-year and the 10-year U.S. Treasury notes from the middle of July up to the present time.

First, the yield on the 5-year Treasury.

Yield on 5-year Treasury

Market Yield of 5-year Treasury Note (Federal Reserve)
Now, the yield on the 10-year Treasury.

Yield on 10-year Treasury

Market Yield on 10-year Treasury Note (Federal Reserve)
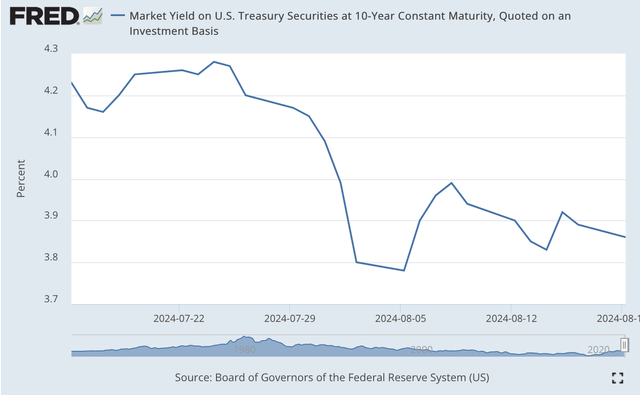
Obviously, something happened in July.

The interesting thing is that the decline in these nominal Treasury yields seems to have come from both a drop in the inflationary expectations built into the nominal yields and a drop in the expected rate of real growth in the economy.

The reduction in yields started right after the conclusion of the Republican convention.

Furthermore, the reduction came right after six months when the inflationary expectations built into the nominal yields had been very stable. I had just written about this stability on July 30, 2024: see “Inflationary Expectations: Much The Same Through The First Half.”

Note that the expected real growth rate built into the Treasury yields in the first six months of 2024 also remained steady.

Investors, since the middle of July, seem to have revised downwards both their expectations for economic growth in the United States and for inflation.

And, these expectations appear to be staying in the market.

As to the expectations built into these yields, investors now seem to believe that the economy will grow at a compound rate of 1.6 percent over the next 5 years, and will grow at a compound rate of 1.7 percent over the next 10 years.

The expected inflation rate in both periods is 2.1 percent.

Basically, investors have dropped both expectations… now expecting lower economic growth…and, expecting lower inflation.

How does this conform with the information on volatility?

I would put it this way.

Given the uncertainty about the outcome of the presidential election this fall, uncertainty has increased concerning the possible economic policies that will be forthcoming from the newly elected president and this uncertainty is being translated into the greater volatility being experienced in the financial markets and by the reduction in expectations about economic growth.

Again, the remarkable thing to me is the fact that all these data have experienced significant changes in the period just following the close of the Republican convention.

And, I believe that there is more evidence of this, evidence that I will be reporting on in the next few weeks.

What does this mean for investors?

Uncertainty relating to the economy and the financial markets has increased substantially in the past month.

Right now, the investment community is having difficulties determining just where things are going.

As a consequence, the volatility in the markets should remain.

I know that there is still the Federal Reserve dilemma…will the Fed reduce its policy rate of interest at its next meeting of the FOMC?

But, right now, it seems as if the presidential election is being viewed as a “toss-up” and this leaves the uncertainty pertaining to the future course of government economic policies “up in the air.”

So, the stock market may get a “bounce” if the Fed does reduce its policy rate of interest.

But, my guess is that the volatility of the market will remain through the finish of the election season…unless there is some other dramatic piece of news.

Then, investors can move on into the future.

But, until then…there is your guess…and there is my guess.

Credit: Source link

ShareTweetSendSharePin

Related Posts

NBC Nightly News with Tom Llamas Full Episode – Aug. 26
Market & News

NBC Nightly News with Tom Llamas Full Episode – Aug. 26

September 22, 2026
Kohberger granted new hearing to withdraw guilty plea
Market & News

Kohberger granted new hearing to withdraw guilty plea

September 22, 2026
ICE releases Padres minor league coach from custody
Market & News

ICE releases Padres minor league coach from custody

September 22, 2026
Ponce Financial Group: Potential Preferred Stock Repurchase Makes It Look More Interesting
Market & News

Ponce Financial Group: Potential Preferred Stock Repurchase Makes It Look More Interesting

September 22, 2026
Next Post
WHO declares global emergency as mpox virus spreads across Africa

WHO declares global emergency as mpox virus spreads across Africa

Leave a Reply Cancel reply

Your email address will not be published. Required fields are marked *

Search

No Result
View All Result
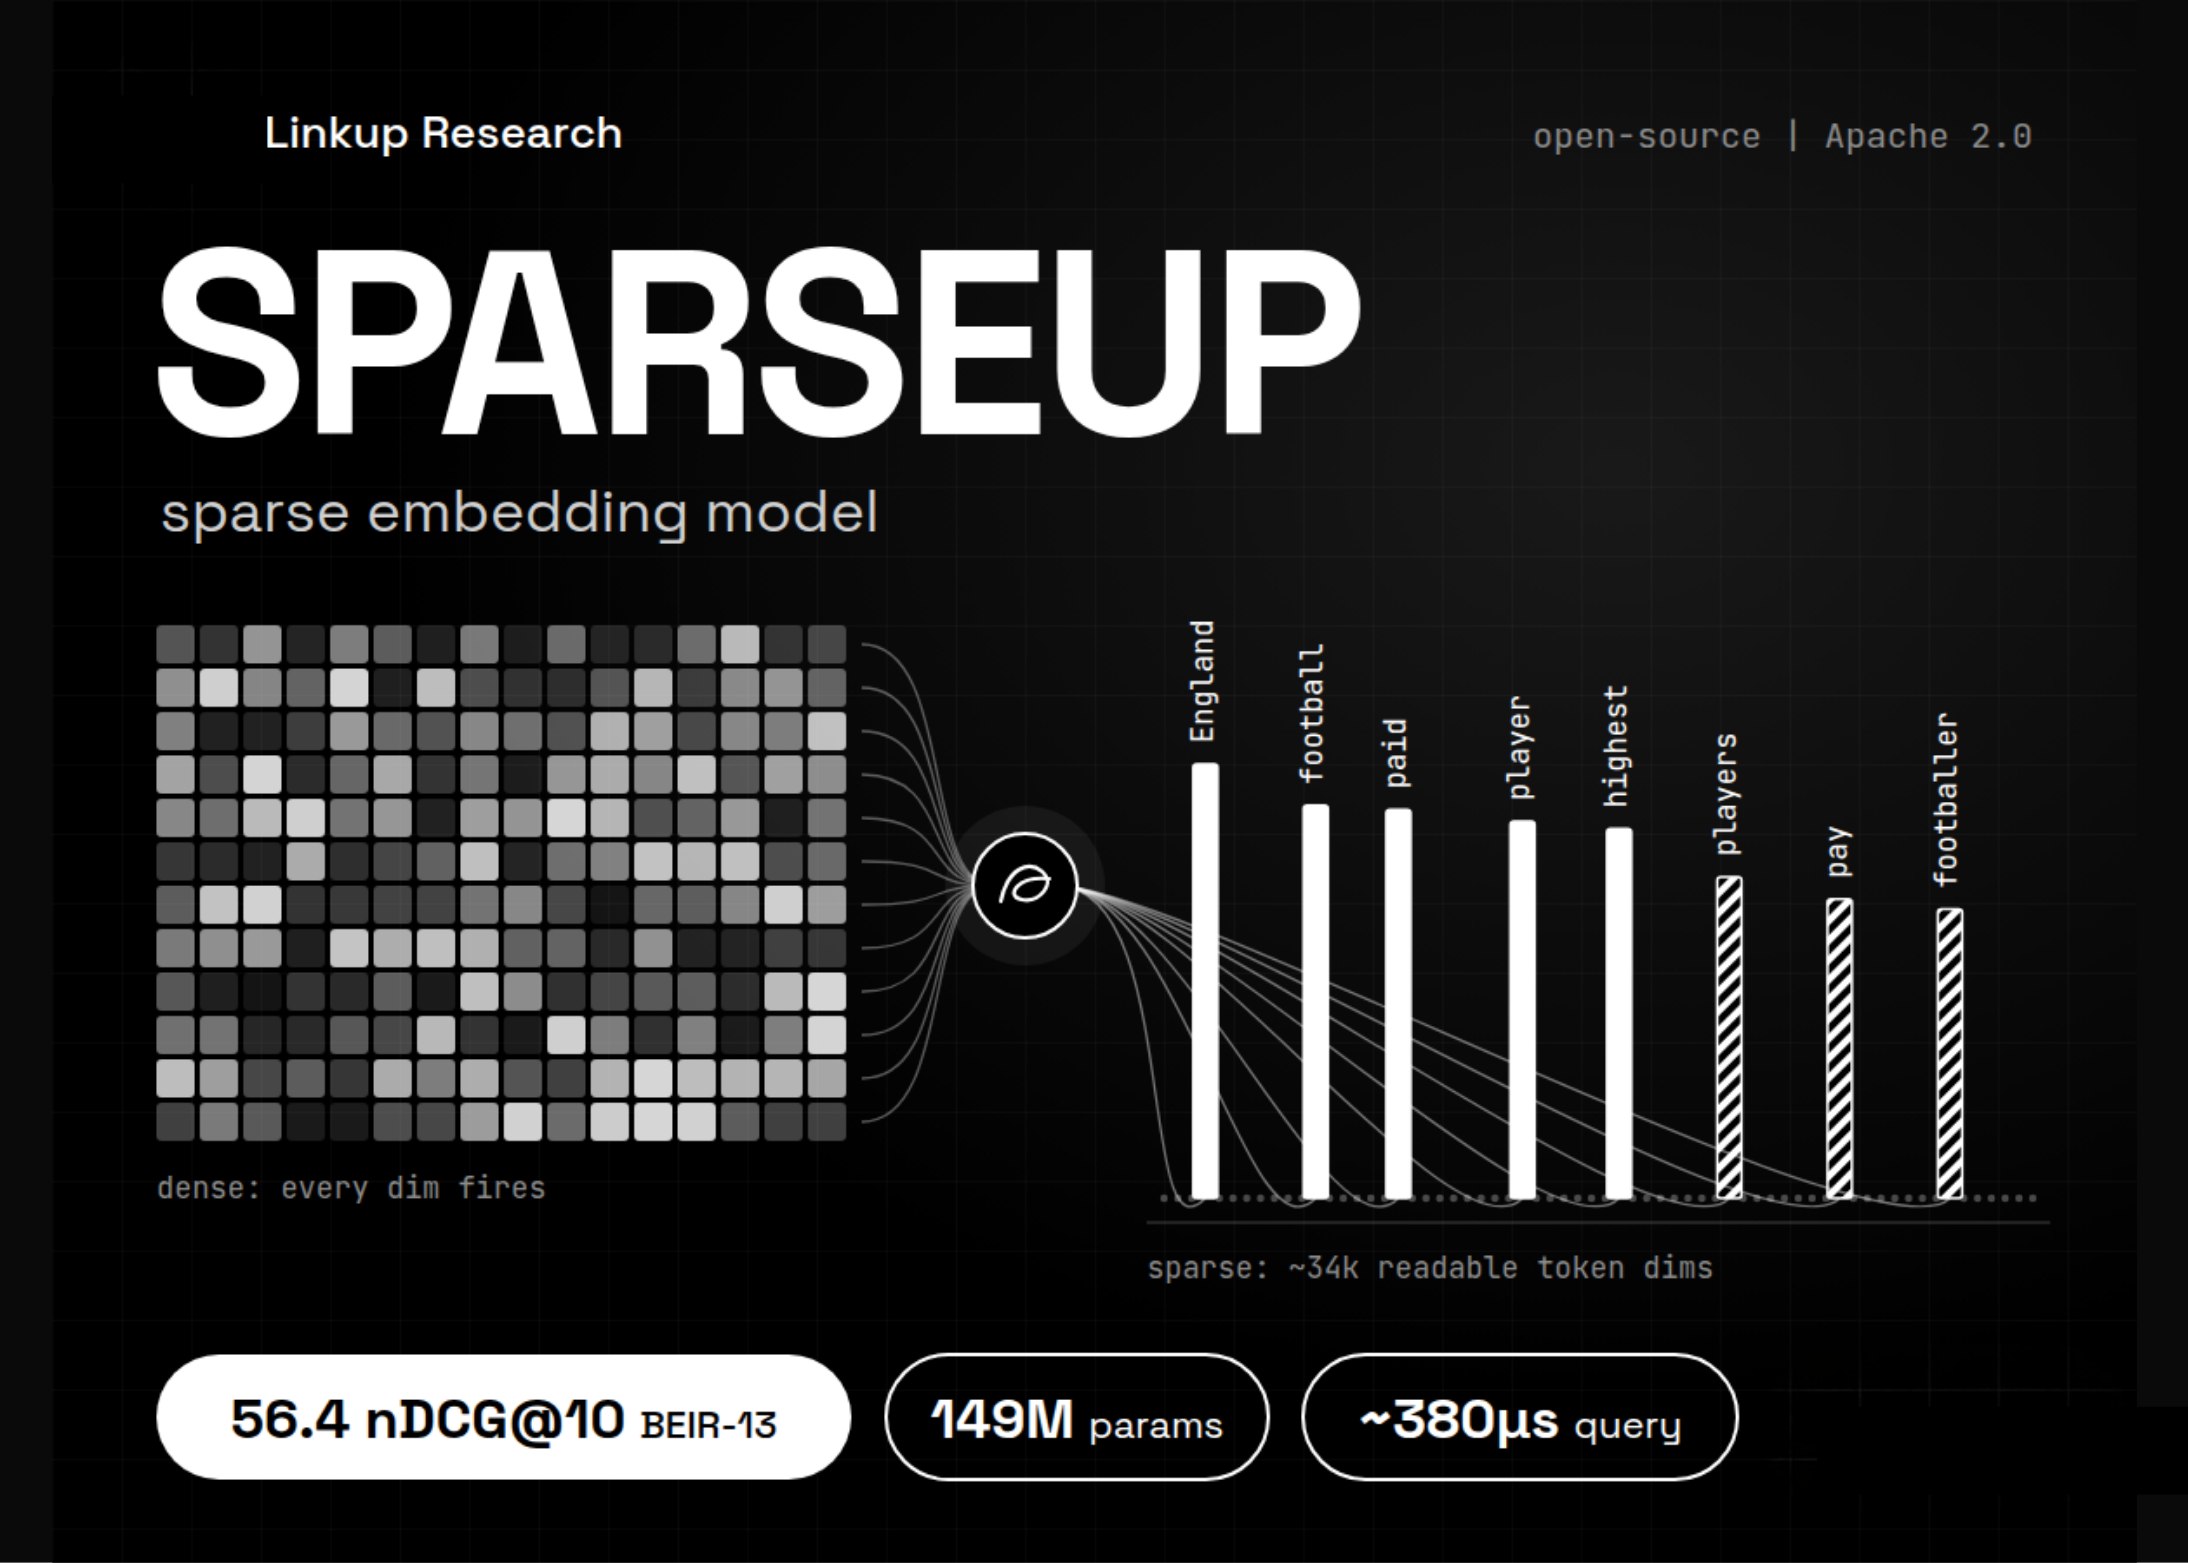
Linkup Research Releases SPARSEUP: A 149M-Parameter Open-Source Sparse Embedding Model

Linkup Research Releases SPARSEUP: A 149M-Parameter Open-Source Sparse Embedding Model

September 19, 2026
Crusoe CEO: Data Center Indusry Has a ‘Marketing Issue’

Crusoe CEO: Data Center Indusry Has a ‘Marketing Issue’

September 20, 2026
Grand Canyon Rescue Operations; How to Quell Settler Violence in the West Bank | Sept. 1

Grand Canyon Rescue Operations; How to Quell Settler Violence in the West Bank | Sept. 1

September 19, 2026

About

Learn more

Our Services

Legal

Privacy Policy

Terms of Use

Bloggers

Learn more

Article Links

Contact

Advertise

Ask us anything

©2020- TradePoint.io - All rights reserved!

Tradepoint.io, being just a publishing and technology platform, is not a registered broker-dealer or investment adviser. So we do not provide investment advice. Rather, brokerage services are provided to clients of Tradepoint.io by independent SEC-registered broker-dealers and members of FINRA/SIPC. Every form of investing carries some risk and past performance is not a guarantee of future results. “Tradepoint.io“, “Instant Investing” and “My Trading Tools” are registered trademarks of Apperbuild, LLC.

This website is operated by Apperbuild, LLC. We have no link to any brokerage firm and we do not provide investment advice. Every information and resource we provide is solely for the education of our readers. © 2020 Apperbuild, LLC. All rights reserved.

No Result
View All Result
  • Main
  • AI & Technology
  • Stock Charts
  • Market & News
  • Business
  • Finance Tips
  • Trade Tube
  • Blog
  • Shop

© 2023 - TradePoint.io - All Rights Reserved!