
Adam Gault
The V Investment Thesis Remains Robust As The Leading Market Player
Visa (NYSE:V) is a stock that requires no introduction, along with Mastercard (MA), attributed to their near duopoly in the global payment processing business.
Based on the latest data released by The Nilson Report, the Visa brand credit and debit cards commands the second largest global market share at 35% in 2022. This is on top of its market leading share of 39% in the all payment card purchase transactions globally.
These numbers are comparatively way ahead of MA’s share at 20%/ 24%, with V only trailing behind the China-based UnionPay’s market share of 40%/ 34%, respectively.
V Valuations
Seeking Alpha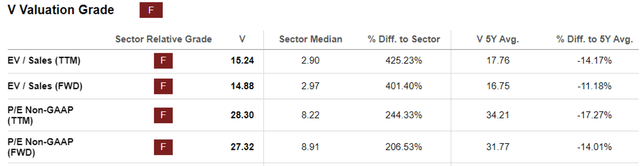
With V being a global payment leader, it is also unsurprising that the stock continues to trade at a premium compared to the fintech sector medians, though lower than its 5Y means. However, investors need not fret, since the stock’s valuations have merely normalized to its pre-pandemic averages.
The same trend has also been observed in its direct competitor, MA, sustaining their robust investment theses as the leaders in the payment processing business.
V is expected to generate a robust top and bottom line growth moving forward as well, at a CAGR of +10.6% and +15.2% through FY2026, compared to its normalized levels of +11.7% and +17.6% between FY2016 and FY2022, respectively.
Based on the consensus FY2026 adj EPS estimates of $12.58 and its FWD P/E of 27.32x, we are still looking at a long-term price target of $343.68, implying an impressive upside potential of +45.8% from current levels.
In addition, V’s dividend investment thesis is excellent, attributed to its expanded +16.8% dividend growth rate over the past five years, compared to the sector median at +7.09%.
Its dividends remain safe as well, based on its consistent TTM Free Cash Flow Yield to Dividend Yield Ratio of 5.03%, compared to its 5Y mean of 5.06% and sector median of 3.75%.
Unfortunately, it is not all roses and sunshine for V.
More Delinquencies Coming For The Credit Card Market
On the one hand, V is only a payment processing service provider and therefore, not exposed to the normalizing provisions for credit losses/ delinquency rates/ bad debts, as that of the issuing banks/ merchants and other fintechs such as Affirm (AFRM) and Upstart (UPST).
Overall Credit Card Debt In Q2’23
New York Fed, GETTY IMAGES, and Yahoo Finance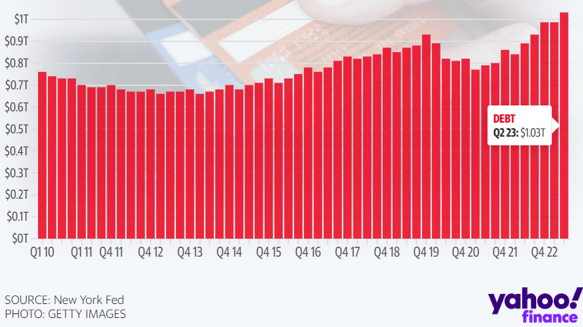
By Q2’23, the overall US credit card debt increased to $1.03T (+4% QoQ/ +15.7% YoY/ +10.7% from FY2019 levels of $0.93T), with delinquencies already normalizing to pre-pandemic levels of 7.2%.
The Normalizing Credit Card Trends
Seeking Alpha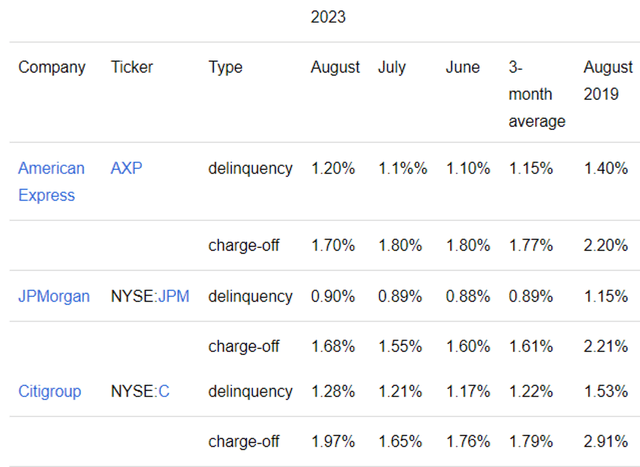
The top three US credit card issuers, namely American Express (AXP), JPMorgan (JPM), and Citigroup (C), have similarly reported a normalizing delinquency and charge-off trends, nearing the hyper-pandemic levels.
On the other hand, we believe that things may worsen from henceforth, since multiple retailers have reported impacted profitability as bad debts and write-offs increase beyond pre-pandemic levels, including Macy’s (M) and Nordstrom (JWN) in their recent earnings calls.
With consumers struggling to pay off their credit card debts despite the robust US labor market, we may see discretionary spending further tightened as the federal student loan repayments restart from October 2023 onwards.
These may impact V’s total Payment Volume Growth moving forward, which has been notably decelerating to +9% YoY in FQ3’23, +10% YoY in FQ2’23, and +7% YoY in FQ1’23. This is compared to FY2022 levels of +15% YoY, FY2021 at +16% YoY, FY2020 at +2% YoY, and FY2019 at +9% YoY.
While the top three US credit card issuers still report robust consumer card spends in the latest quarters, card balances have also grown along with the allowance for credit losses.
These headwinds may potentially trigger a more cautious lending practices by more banks moving forward, speculatively resulting in a slowdown in credit card issuances with a stronger emphasis on higher FICO scores.
V’s August Payments Volume
Seeking Alpha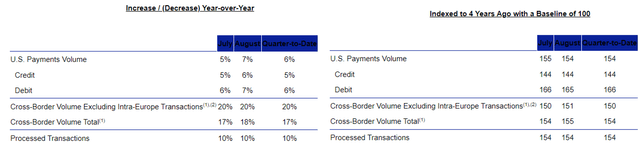
Therefore, while V may continue to record an excellent growth in the US and internationally in August 2023, we believe its US TPV growth rate may decelerate in the near-term, as the consumers adjust their spending at these times of uncertain macroeconomic outlook.
As a result of the temporal headwinds, investors may want to temper their near-term expectations.
So, Is V Stock A Buy, Sell, or Hold?
V 5Y Stock Price
Trading View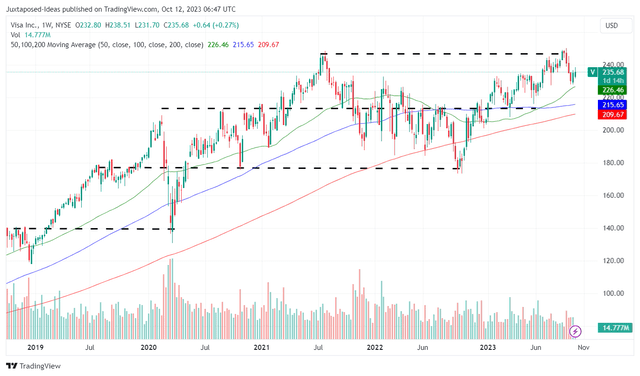
For now, we are cautiously rating V as a Buy, due to its attractive prospect as a high growth/ dividend stock. However, investors must also note that the stock has failed to break out of its resistance levels of $245s in August 2023.
While it appears to be well-supported at $230s, the fintech is also set to present its FQ4’23 earnings call in October 24, 2023, potentially signaling more volatility depending on its performance.
While the V management has previously guided a “low double-digit net revenue growth and mid-teens EPS growth in FY2023, despite concerns about a slowdown and an exchange rate drag,” it remains to be seen how the call may develop, with most of the upside potential likely baked-in already.
This is based on our projected FY2023 adj EPS of $8.62 (+15% YoY as guided by the management) and its FWD P/E of 27.32x, implying that the stock is currently trading near its fair value of $235.49.
Therefore, investors may want to add according to their dollar cost averages/ risk appetite, with us recommending an entry point at V’s previous support levels of $215s for an improved margin of safety.
Credit: Source link