
PM Images
Introduction
In my quest to re-create institutional, complex portfolio strategies using “off-the-shelf” vehicles available to retail investors (AKA, most of my readers), I’ve stumbled upon a new tool: XXXX.
The MAX S&P 500 4X Leveraged ETNs (NYSEARCA:XXXX) is an exchange-traded note (“ETN”) that aims to return 4x the daily returns of the S&P 500’s total return, minus financing costs and management fees, etc.; and I think it could be used intelligently to increase the risk/reward ratio of a portfolio.
Does It Work?
Before we get into how I want to use this fund, let’s see if it holds up its end of the bargain. Do we actually get a 4x amplified S&P 500?
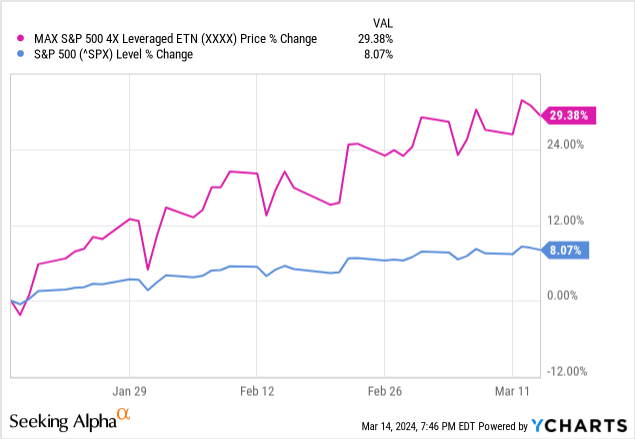
So far, so good. Keep in mind that we will always see less than 4x, but close to it, because of financing costs eating away at some of those returns (more on that next).
We should also consider other metrics like correlation, so we can see the day-to-day changes in XXXX’s ability to follow SPX’s price.
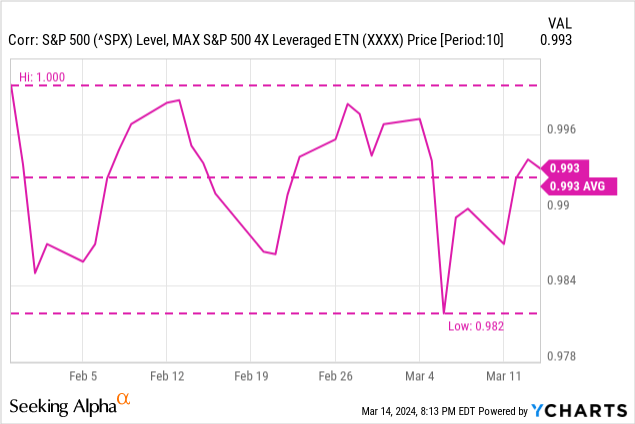
With a low of 0.98 and a high of 1.00, XXXX exhibits an average correlation to SPX of 0.99. Accounting for the loss of financing and management costs daily, we see a functional 1:1 relationship. That’s really good news for this fund. It’s doing its job.
The Cost Of Financing
Currently, financing costs are high, since they are set by the prime rate. We are presently at a 10-year high. This financing cost is a key risk to consider.
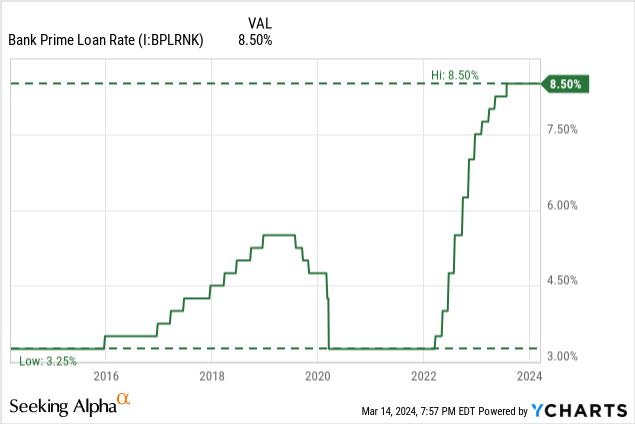
While it is likely to be lower in the future, no one knows for sure where it will go or how long it will take before the Fed begins lowering its Fed funds rate, which directly affects the prime loan rate. It may be this high, or get higher, and there is no telling how badly this will affect XXXX’s returns.
Leverage Risk
This should be apparent, but I feel the need to mention it anyway: there is tremendous risk involved with using leverage. The more leverage, the more risk. The more risk, the more potential reward at least colloquially, I know this is not an absolute truth.
Take a look at various leveraged & un-leveraged SPX products. Note how the drawdowns get sharper the more leverage you add.
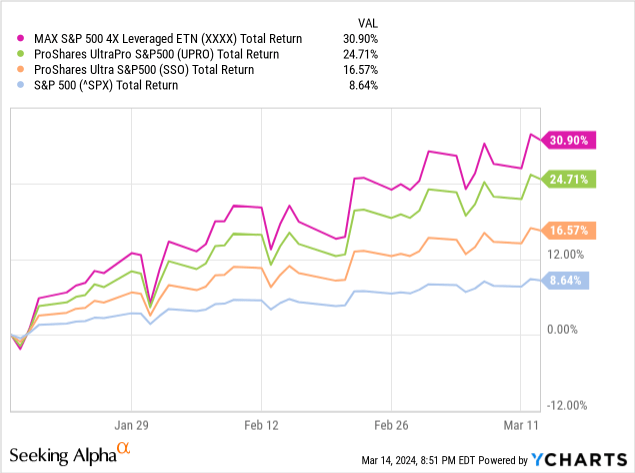
Because of the short timeframe XXXX has been around, this backtest looks good. We can find periods that are absolutely frightening in the longer-lived funds.
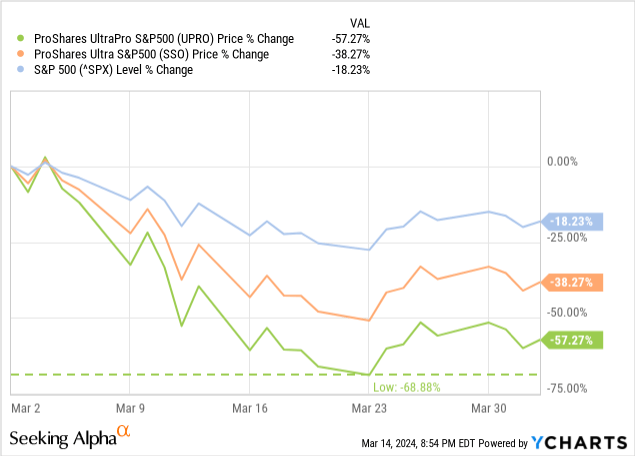
That’s March of 2020, for some context. A total wipeout is very unlikely since the SEC has imposed circuit breakers on the market, preventing a greater than 20% decline in SPX in a single day. A 25% decline in one day would send the fund to zero.
Market-Wide Circuit Breakers – The securities and futures exchanges have procedures for coordinated cross-market trading halts if a severe market price decline reaches levels that may exhaust market liquidity. These procedures, known as market-wide circuit breakers, may halt trading temporarily or, under extreme circumstances, close the markets before the normal close of the trading session.
Market-wide circuit breakers provide for cross-market trading halts during a severe market decline as measured by a single-day decrease in the S&P 500 Index. A cross-market trading halt can be triggered at three circuit breaker thresholds – 7% (Level 1), 13% (Level 2), and 20% (Level 3). These triggers are set by the markets at point levels that are calculated daily based on the prior day’s closing price of the S&P 500 Index.
A market decline that triggers a Level 1 or Level 2 circuit breaker before 3:25 p.m. will halt market-wide trading for 15 minutes, while a similar market decline “at or after” 3:25 p.m. will not halt market-wide trading. A market decline that triggers a Level 3 circuit breaker, at any time during the trading day, will halt market-wide trading for the remainder of the trading day.
Multiply By Four
So, here’s the idea. Leveraged products are useful for creating expanded-canvas portfolios, or portfolios that have total asset exposure above 100%.
It works like this: XXXX provides $4 of exposure to SPX for every $1 you invest since it amplifies your gains and losses by four.
We start with $100. We invest $25 of it in XXXX and put the other $75 in long-term treasuries. This leaves us with $100 of exposure to SPX and $75 of exposure to the 20yr UST.
This brings our $100’s total exposure to $175. This can be scaled up to significantly larger amounts since these assets are all purchasable by ETFs.
Hedgefundie
The seasoned “internet investors” among you may know a story from investing forums where a user named “Hedgefundie” proposed a portfolio using 3x leveraged ETFs (namely UPRO and TMF) to create a stock and bond portfolio that is as levered as possible at the time.
It has done considerably well. Don’t be fooled by the logarithmic graph. There is a difference of $7,000,000 on $10,000 invested in June 1986 (as far back as I could go with the mutual funds I used to simulate these).
Figure 1 (Portfolio Visualizer)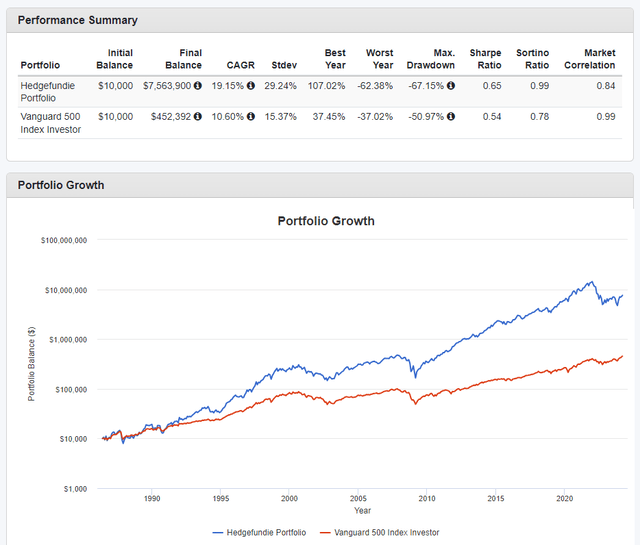
I figured I should share this story as a bit of inspiration for proposed portfolios of this nature.
Adding Uncorrelated Assets
My idea here is to add equal parts exposure to long-term treasuries and managed futures. These are two assets with little correlation with the market and can provide cushions for drawdowns in SPX since they don’t necessarily fall when the market does.
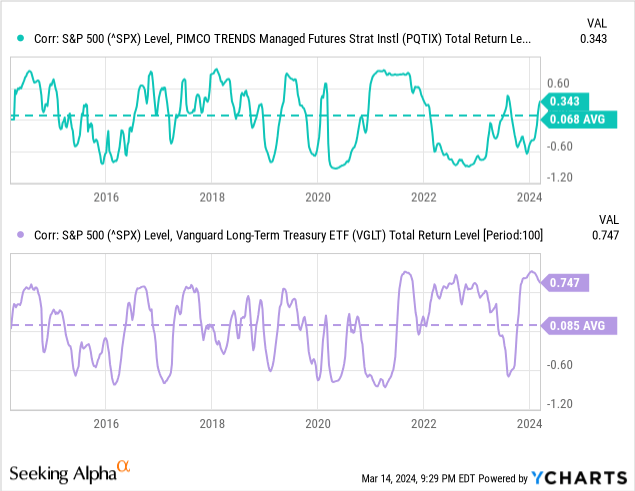
The only rule in the portfolio is that it is re-balanced quarterly and dividends are re-invested.
| Asset | Weight | Exposure |
| XXXX | 25% | 100% |
| VGLT | 37.5% | 37.5% |
| PQTIX | 37.5% | 37.5% |
It has done well over the past 10 years compared to its constituent parts.
Figure 2 (Portfolio Visualizer)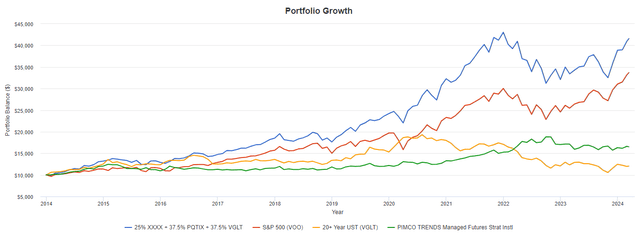
In that 10-year backtest, we also see that the portfolio never experienced a drawdown worse than its constituent parts, bar a month in 2016.
Figure 3 (Portfolio Visualizer)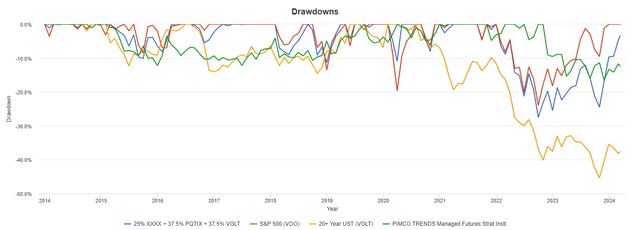
In practice, I would use the iMGP DBi Managed Futures Strategy ETF (DBMF) as my managed futures position and the iShares 20+ Year Treasury Bond ETF (TLT) as my bond exposure.
They can’t be backtested nearly as far as the other funds, but here is how it has performed in the last five years.
Figure 4 (Portfolio Visualizer)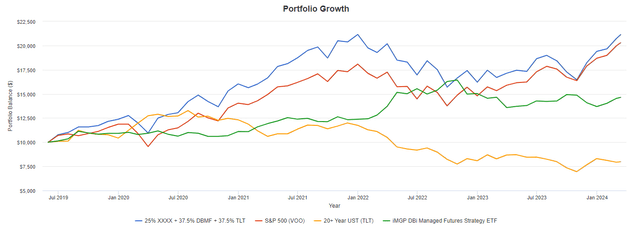
The historical drawdowns show us how this strategy can provide some drawdown protection.
Figure 5 (Portfolio Visualizer)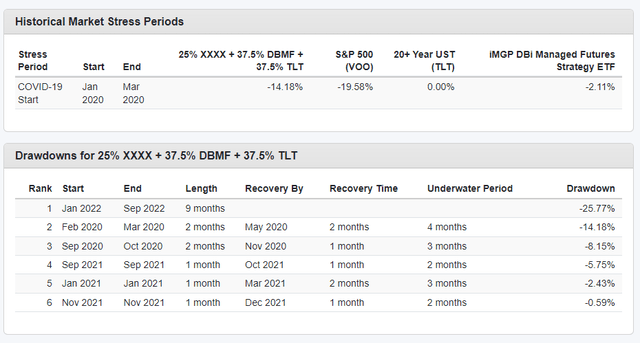
Conclusion
The MAX S&P 500 4X Leveraged ETNs is a useful new tool for investors that has proven its ability to provide the leverage it promises. Using it to create capital efficiency instead of just raw leverage, we can create a portfolio that has the potential to outperform SPX on both a total return and a risk/reward standpoint.
Adding in uncorrelated assets that act as a counterbalance to SPX’s peaks and troughs like bonds and managed futures can help boost both returns and drawdowns over long periods of time.
The risks of holding a leveraged position like XXXX should not be overlooked, and catastrophic failure of the fund is always an option. No matter how tempting backtest may be, they do not consider the risks that investors need to when investing in products like XXXX.
Thanks for reading.
Credit: Source link