

bjdlzx
Commodities in general and energy in particular are performing very well since oil prices started rising again this year. Energy-heavy ETFs like GSG are the top performers.
One energy-light commodity ETF is also performing very well: The United States Commodity Index Fund (NYSEARCA:USCI). This is a so-called optimized ETF that tries to maximise performance by systematically choosing commodities and futures contracts with the strongest backwardation or the mildest contango.
Commodity ETF Performance
Last year, the war in Ukraine pushed oil prices higher. Recession fears led to lower oil prices in the second half of 2022. In response to the lower demand, OPEC lowered supply, and in the second quarter of this year, oil prices started to rise again. The rising oil prices are of course a strong tailwind for the energy-rich commodity ETFs like the iShares S&P GSCI Commodity-Indexed Trust ETF (GSG) and the Invesco Optimum Yield Diversified Commodity Strategy No K-1 ETF (PDBC).
But over the past year, only one commodity ETF outperformed the (well-performing) S&P 500 ETF: USCI!
Figure 1: Total Return Chart (Radar Insights)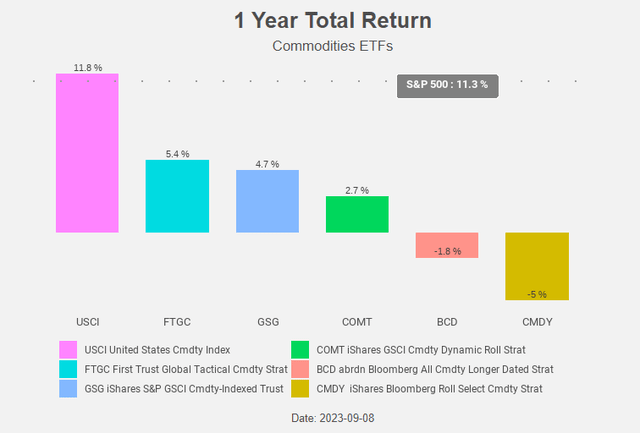
Since oil prices started to decline in June of last year, its lower energy exposure benefitted USCI and offered its investors some downside protection.
Figure 2: Total Return Chart (Radar Insights) Figure 3: Total Return Chart (Radar Insights)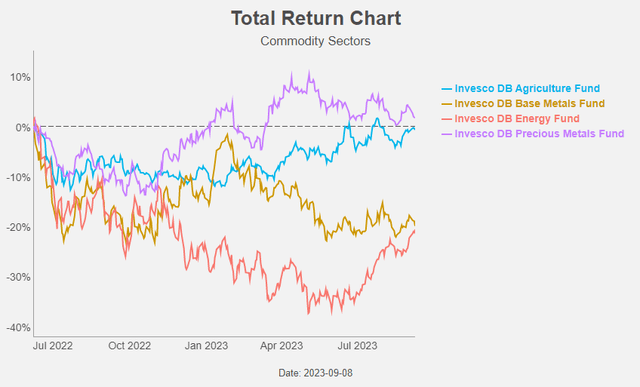
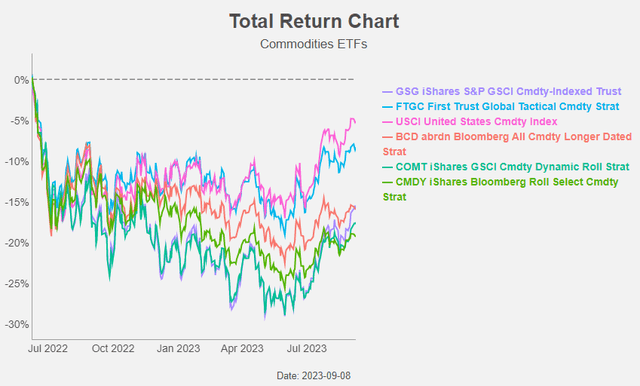
In the second quarter of this year, oil prices started to rise again.
Figure 4: Total Return Chart (Radar Insights)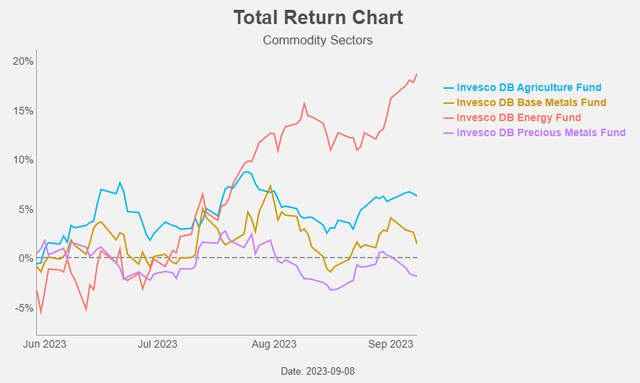
This was a strong tailwind for commodity ETFs, especially the energy-rich ones. But also USCI performed nicely. A nice combination of downside protection and upside potential.
Figure 5: Total Return Chart (Radar Insights)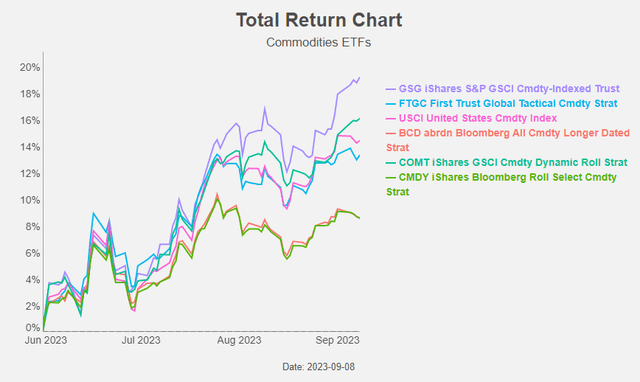
How can we explain this nice performance?
USCI is a so-called optimized ETF that tries to maximise performance by systematically choosing commodities and futures contracts with the strongest backwardation or the mildest contango.
Backwardation and contango
The spot price of a commodity is the price for immediate delivery. In practice, few investors have the ability to take physical delivery of raw materials because of the significant storage and insurance costs they would incur. The closest approximation to the commodity spot market is an ETF or fund that invests in rolling front-month futures contracts. GSG is such an ETF.
The prices of commodity futures with longer-term expiration dates differ usually from the price of the nearest-term or front-month contract. If the price of the front-month contract is higher than the price of the next contract, you make money if you “roll” into the new contract. Selling high and buying low. Your “roll yield” is positive.
Such a futures market is said to be in backwardation. This term was coined by Keynes. Commodity producers fear that the price at harvest will be lower than today and are willing to pay a premium to hedge this risk. As a consequence, future prices will be lower than the spot price and Keynes named this condition (normal) backwardation. This implies that a futures price of a commodity is appreciating as it is getting closer to maturity.
The opposite of backwardation is contango. The price of the front-month contract is lower than the price of the next contract, and you lose money if you “roll” into the new contract. Selling low and buying high. Your “roll yield” is negative.
Figure 6: Backwardation and contango (PTMC)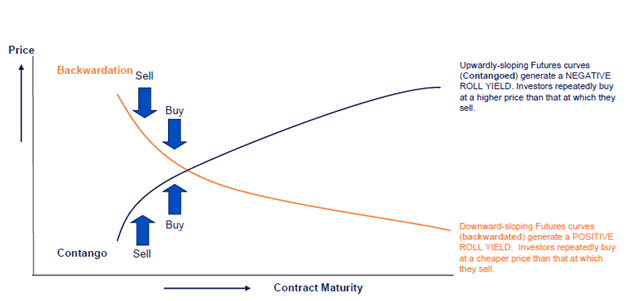
Famous commodity indices like the S&P GSCI Index and the Bloomberg Commodity Index use a basic strategy: the front-month roll. In this case, investors receive the closest exposure they can get to the spot price of a commodity, as the front-month and spot prices tend to move closely together. A possible drawback of this strategy is the negative roll yield when the market is in contango.
To circumvent this problem, so-called optimized strategies were developed. Such strategies try to maximise (roll) yields by systematically choosing commodities and futures contracts with the strongest backwardation or the mildest contango.
United States Commodity Index Fund
United States Commodity Index Fund is benchmarked to the SummerHaven Dynamic Commodity Index (“SDCI”). This is an example of such an optimized strategy. The SDCI “tracks the performance of a fully collateralized portfolio of 14 commodity futures, selected each month from a universe of 27 eligible commodities based on observable price signals, subject to a diversification requirement across major commodity sectors.” The commodity sectors for the SDCI include Precious Metals, Industrial Metals, Energy and agricultural products such as Livestock, Softs, and Grains.
To make sure that the index is well diversified, at least one component from each of the four primary commodity sectors (Precious Metals, Industrial Metals, Petroleum, and Grains) has to be included. If a primary sector is not represented after selecting the 14 commodities, the commodity with the highest backwardation among the commodities of the omitted primary sector is substituted for the commodity with the lowest backwardation among the 14 selected commodities.
Finally, for each of the 14 selected commodities, the contract month with the greatest backwardation (or the least contango) is chosen.
At the end of Q2, the portfolio looked like this. Energy accounts for only 21% of the portfolio.
Figure 7: Portfolio composition (USCF)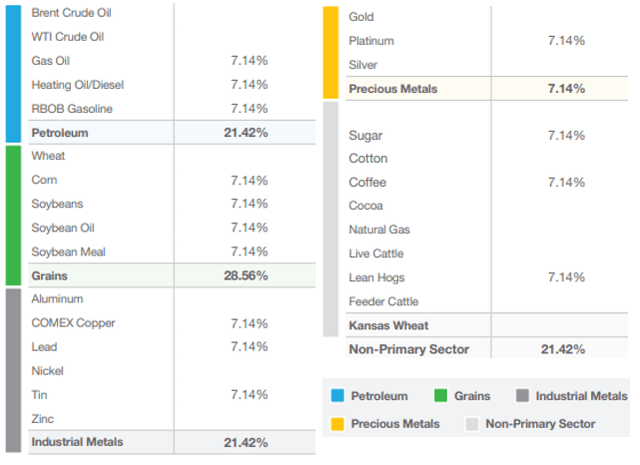
Currently, the below futures are held in USCI. The energy weight increased in the meantime to the maximum level of almost 35%.
Figure 8: Portfolio composition (USCF)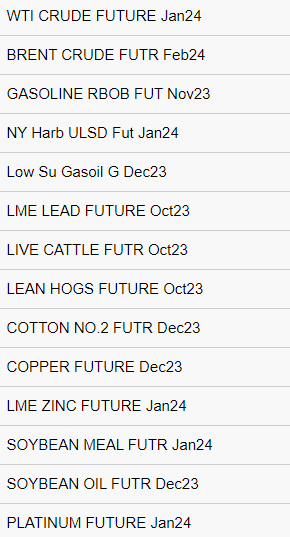
Since a couple of weeks, USCI is again in a long-term uptrend.
Figure 9: Total Return Chart (Radar Insights)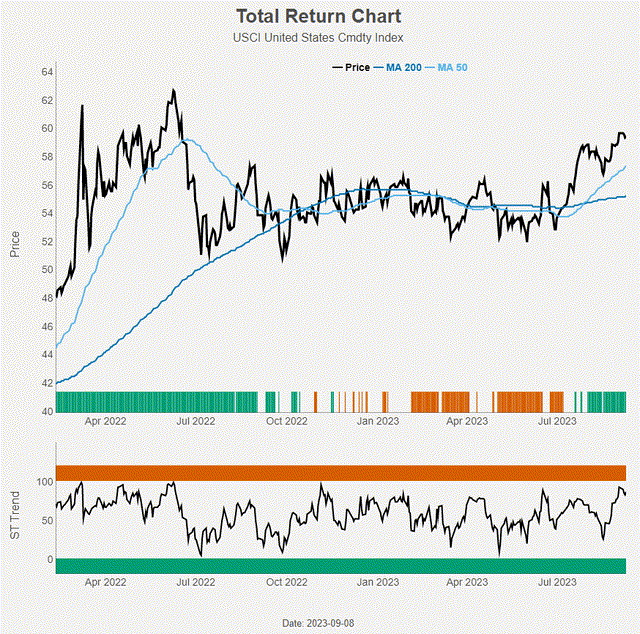
The net expense ratio is 1.07% and USCI pays no dividend.
USCI is the commodity ETF with the strongest long-term uptrend.
Figure 10: Trends (Radar Insights)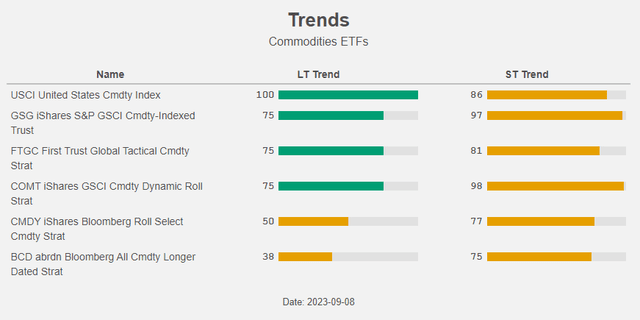
Conclusion
Due to their inflation hedging qualities and diversification benefits commodities should remain part of your portfolio.
Should you favour a traditional front-month rolling ETF like GSG or an optimized ETF like USCI? When the commodity markets would move in contango, this would be bad news for front-month rolling ETFs. But even with the markets in backwardation USCI is already outperforming.
GSG is also more a bet on energy, while USCI is more diversified. This offers more downside protection. At the same time, USCI is for the moment the best-performing commodity ETF. A nice combination.
For us, there is only one conclusion: USCI is our favourite commodity ETF.
Credit: Source link