
• bitcoinBitcoin(BTC)$77,740.000.60%
  • ethereumEthereum(ETH)$2,521.910.03%
  • tetherTether(USDT)$1.00-0.01%
  • binancecoinBNB(BNB)$725.33-0.04%
  • rippleXRP(XRP)$1.381.31%
  • usd-coinUSDC(USDC)$1.00-0.01%
  • solanaSolana(SOL)$101.67-0.04%
  • tronTRON(TRX)$0.3397270.04%
  • Figure HelocFigure Heloc(FIGR_HELOC)$1.000.00%
  • zcashZcash(ZEC)$1,136.34-0.62%
  • HyperliquidHyperliquid(HYPE)$79.910.82%
  • dogecoinDogecoin(DOGE)$0.084405-0.44%
  • RainRain(RAIN)$0.015135-4.04%
  • USDSUSDS(USDS)$1.00-0.01%
  • moneroMonero(XMR)$519.25-2.41%
  • whitebitWhiteBIT Coin(WBT)$80.580.36%
  • chainlinkChainlink(LINK)$11.44-0.73%
  • leo-tokenLEO Token(LEO)$9.00-0.65%
  • cardanoCardano(ADA)$0.2087080.26%
  • stellarStellar(XLM)$0.1836791.67%
  • Ethena USDeEthena USDe(USDE)$1.00-0.01%
  • daiDai(DAI)$1.000.03%
  • bitcoin-cashBitcoin Cash(BCH)$224.73-0.41%
  • USD1USD1(USD1)$1.000.00%
  • litecoinLitecoin(LTC)$54.210.09%
  • uniswapUniswap(UNI)$6.36-0.62%
  • CantonCanton(CC)$0.096523-1.85%
  • the-open-networkGram (prev. Toncoin)(GRAM)$1.35-0.78%
  • hedera-hashgraphHedera(HBAR)$0.0765551.32%
  • Global DollarGlobal Dollar(USDG)$1.000.01%
  • avalanche-2Avalanche(AVAX)$7.43-0.21%
  • nearNEAR Protocol(NEAR)$2.454.55%
  • shiba-inuShiba Inu(SHIB)$0.000005-0.01%
  • suiSui(SUI)$0.730.13%
  • crypto-com-chainCronos(CRO)$0.058059-3.15%
  • paypal-usdPayPal USD(PYUSD)$1.00-0.01%
  • BlackRock USD Institutional Digital Liquidity FundBlackRock USD Institutional Digital Liquidity Fund(BUIDL)$1.000.00%
  • tether-goldTether Gold(XAUT)$4,329.06-0.48%
  • MemeCoreMemeCore(M)$1.15-1.98%
  • Circle USYCCircle USYC(USYC)$1.140.00%
  • Ripple USDRipple USD(RLUSD)$1.00-0.01%
  • okbOKB(OKB)$114.14-0.06%
  • BittensorBittensor(TAO)$235.07-1.16%
  • Ondo US Dollar YieldOndo US Dollar Yield(USDY)$1.150.16%
  • BitwayBitway(BTW)$0.7637.44%
  • aaveAave(AAVE)$126.35-0.77%
  • AsterAster(ASTER)$0.700.55%
  • pax-goldPAX Gold(PAXG)$4,333.87-0.51%
  • mantleMantle(MNT)$0.561.58%
  • World Liberty FinancialWorld Liberty Financial(WLFI)$0.0579651.40%
TradePoint.io
  • Main
  • AI & Technology
  • Stock Charts
  • Market & News
  • Business
  • Finance Tips
  • Trade Tube
  • Blog
  • Shop
No Result
View All Result
TradePoint.io
No Result
View All Result

Uranium Miners Breaking Out (Technical Analysis)

January 11, 2024
in Market & News
Reading Time: 5 mins read
A A
Uranium Miners Breaking Out (Technical Analysis)
ShareShareShareShareShare

Liens

Uranium miners broke out higher as a sector yesterday (9 January). They have been consolidating for close to 3 months, and this breakout could see a return of momentum which made it one of the top-performing sectors in 2023.

Given how spot uranium prices have surged to their 2007 levels, and have far surpassed their 2011 highs, I believe there is still lots of upside in uranium miners, given that they are close to -80% below their 2011 highs.

Below, I will go through the technical charts which led me to my conclusion:

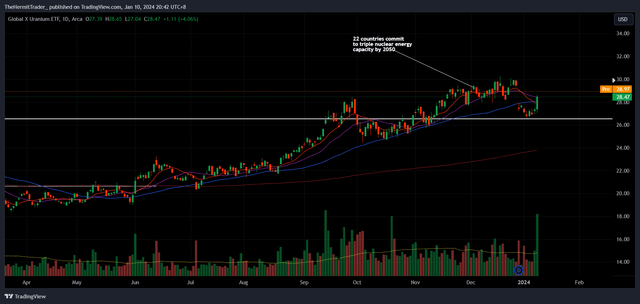
We may observe that the Global X Uranium ETF (URA) broke out strongly yesterday (9 January). Volume came in at almost 4x higher than an average day’s. This shows that there was some serious buying pressure that was coming in.

Daily Chart: URA
Tradingview

TradingView

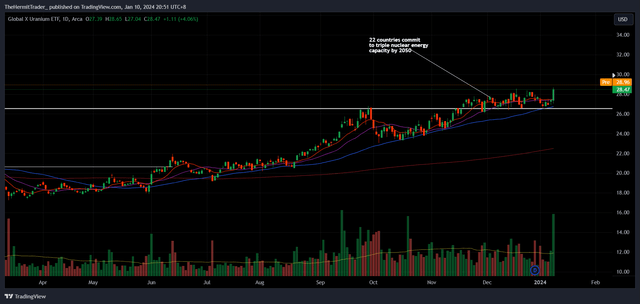
When we look at the chart of URA after it has been adjusted for dividends, we may better appreciate the breakout. The breakout took URA to fresh 52-week highs, out of a 3-month consolidative range. Consolidative ranges tend to resolve in the direction of the trend, which is firmly higher.

Daily Chart: URA (adjusted for dividends)
Tradingview

TradingView

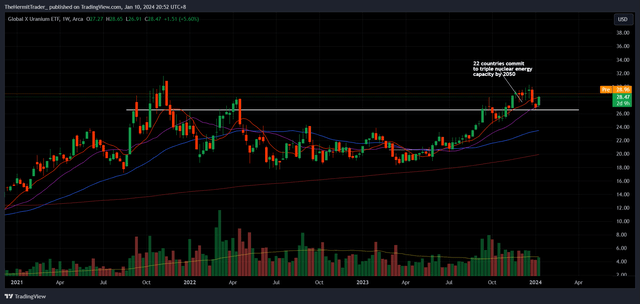
When we zoom out to the weekly time frame, we may observe that URA is on the verge of breaking out of an even bigger base, dating back to September 2021. This is a massive 28-month base, and breakouts from large bases have a high probability of being very explosive.

Weekly Chart: URA
Tradingview

TradingView

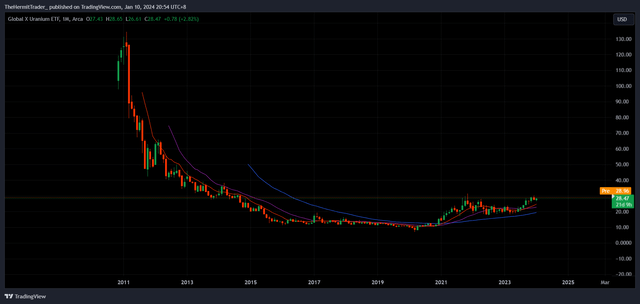
What I like about URA is that the sector is building big bases on almost every time frame. We have seen the daily and the weekly charts above. When we now look at the longer-term monthly chart, we may observe that URA had flattened out and based between 2015 and 2021. This creates a firm foundation for prices to build and trend higher.

Monthly Chart: URA
Tradingview

TradingView

As mentioned earlier, URA is still way below its 2011 highs. The high stands at 134.52, and the current price of 28.47 is close to -80% below those highs.

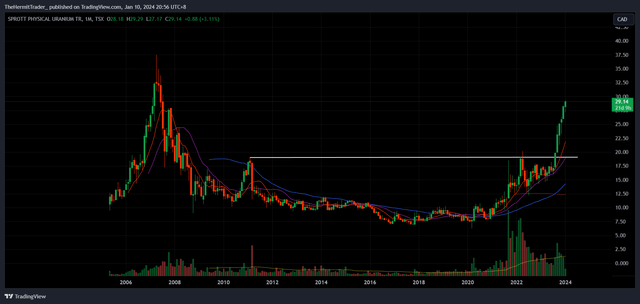
When we look at the Sprott Physical Uranium Trust – Unit (OTCPK:SRUUF), which aims to reflect the spot price of physical uranium, we may observe that prices have risen at a rapid pace in 2023.

They have even surpassed their highs back in 2011, which means there is a big divergence between spot uranium prices and the stock prices of uranium miners. The opportunity, hence, lies in the latter to catch up.

Monthly Chart: Sprott Physical Uranium Trust
Tradingview

TradingView

Taking out the 2011 highs is a big psychological feat, as that was when the Fukushima nuclear accident occurred. To take out those highs means that the negative sentiment surrounding that event is fading away.

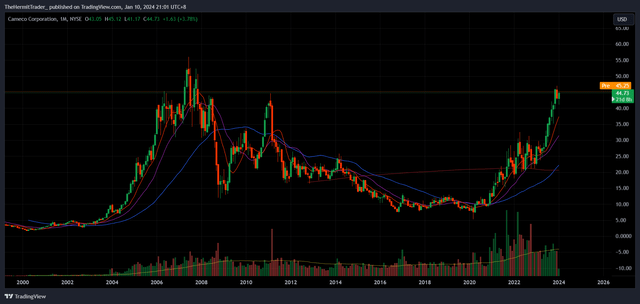
In fact, spot uranium prices are now at their 2007 levels. Although the prices of URA do not stretch back to 2007 as the ETF was incepted later, we may look at the price chart of Cameco Corp. (CCJ) for reference.

CCJ is one of the largest cap uranium miners, and it has recovered back to 2007 levels. This is very different from URA, which is still way below the 2011 levels. This means that the money is flowing into large-cap miners like CCJ, while the smaller-cap uranium mining universe is largely ignored so far.

Monthly Chart: CCJ
Tradingview

TradingView

If spot uranium prices and URA continue trending higher, there is a high probability that money will start flowing into the smaller-cap uranium mining stocks.

YOU MAY ALSO LIKE

Full Episode: TODAY Show – Sept. 10

LIVE: Trump delivers remarks at Medal of Honor Museum in Texas | NBC News

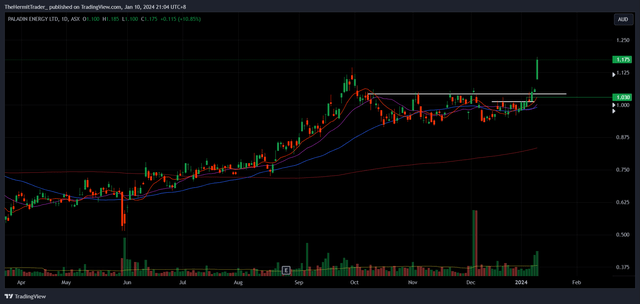
Personally, I went long Australia-listed Paladin Energy (OTCQX:PALAF) on 4 January, as I saw that many Australia-listed uranium mining stocks were building big bases. Paladin Energy, a AUD 2b market cap stock, broke out strongly, and I believe many smaller-cap uranium miners will follow suit.

Daily Chart: Paladin Energy
Tradingview

TradingView

For those interested to get exposure to the uranium mining space, the URA ETF is a decent vehicle of choice. There are not many listed uranium miners to choose from, and URA is the most liquid ETF out there.

Editor’s Note: This article discusses one or more securities that do not trade on a major U.S. exchange. Please be aware of the risks associated with these stocks.

Credit: Source link

ShareTweetSendSharePin

Related Posts

Full Episode: TODAY Show – Sept. 10
Market & News

Full Episode: TODAY Show – Sept. 10

September 14, 2026
LIVE: Trump delivers remarks at Medal of Honor Museum in Texas | NBC News
Market & News

LIVE: Trump delivers remarks at Medal of Honor Museum in Texas | NBC News

September 14, 2026
Sons of 9/11 firefighter grew up to carry on their father’s legacy
Market & News

Sons of 9/11 firefighter grew up to carry on their father’s legacy

September 14, 2026
James Talarico responds to Ken Paxton’s AI deepfake ad
Market & News

James Talarico responds to Ken Paxton’s AI deepfake ad

September 14, 2026
Next Post
Locally acquired malaria case reported in Maryland

Locally acquired malaria case reported in Maryland

Leave a Reply Cancel reply

Your email address will not be published. Required fields are marked *

Search

No Result
View All Result
Bari Weiss caught in ‘Cold War’ power struggle with CBS News president

Bari Weiss caught in ‘Cold War’ power struggle with CBS News president

September 13, 2026
Better Prepared, Yet More Heavily Targeted – Unite.AI

Better Prepared, Yet More Heavily Targeted – Unite.AI

September 11, 2026
Alexander brothers enlist ex-Trump lawyer Alan Dershowitz amid clemency push

Alexander brothers enlist ex-Trump lawyer Alan Dershowitz amid clemency push

September 10, 2026

About

Learn more

Our Services

Legal

Privacy Policy

Terms of Use

Bloggers

Learn more

Article Links

Contact

Advertise

Ask us anything

©2020- TradePoint.io - All rights reserved!

Tradepoint.io, being just a publishing and technology platform, is not a registered broker-dealer or investment adviser. So we do not provide investment advice. Rather, brokerage services are provided to clients of Tradepoint.io by independent SEC-registered broker-dealers and members of FINRA/SIPC. Every form of investing carries some risk and past performance is not a guarantee of future results. “Tradepoint.io“, “Instant Investing” and “My Trading Tools” are registered trademarks of Apperbuild, LLC.

This website is operated by Apperbuild, LLC. We have no link to any brokerage firm and we do not provide investment advice. Every information and resource we provide is solely for the education of our readers. © 2020 Apperbuild, LLC. All rights reserved.

No Result
View All Result
  • Main
  • AI & Technology
  • Stock Charts
  • Market & News
  • Business
  • Finance Tips
  • Trade Tube
  • Blog
  • Shop

© 2023 - TradePoint.io - All Rights Reserved!