

Peach_iStock
By Rich Mathieson and Christopher DiPrimio, CAIA
The post-COVID era has marked a shift from decades of stagnant economic growth to a regime of reflation characterized by positive nominal growth and structurally higher inflation (and interest rates).
The below series of charts illustrates the impact of this shift through the lens of corporate earnings. The first chart shows that in the ten years following the Global Financial Crisis (GFC), prior to the pandemic, depressed levels of nominal growth meant that only a small number of tech companies (known as the “Magnificent 7”) were able to significantly grow their earnings.
Excluding the Magnificent 7 in the second chart highlights that during that time, operating income for US companies – along with their peers in Europe and Japan – essentially flat-lined. By the time COVID hit, earnings were no higher than they had been in 2007, immediately prior to the GFC. This has begun to change as inflationary pressures have re-emerged in the post-COVID world, with average company earnings now breaking to the upside.
The final chart in the series reveals that a further important nuance of the new regime can be observed in notably higher cross-sectional dispersion in earnings.
Stagnant nominal growth in the ten years leading up to COVID-19 kept earnings growth limited to a small group of US tech companies (Magnificent 7)
Average operating income (rebased 1/1/2004)
Source: BlackRock, with data from Worldscope, as of February 2024. Measures of operating income are rebased at a value of 1 (starting 1/1/2004) for each group of companies to highlight relative differences over time from a common starting point.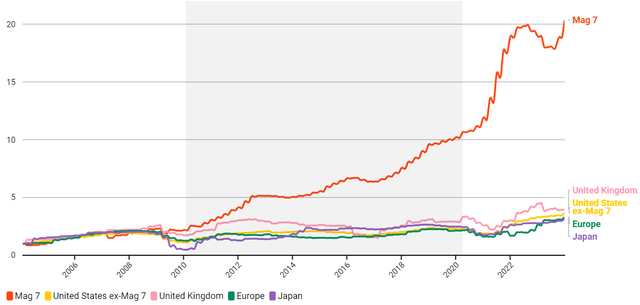
Excluding the Magnificent 7, we find that after years of mostly muted earnings growth across the broader cohort of companies, average earnings have increased in the post-COVID era
Average operating income (rebased 1/1/2004)
Source: BlackRock, with data from Worldscope, as of February 2024. Measures of operating income are rebased at a value of 1 (starting 1/1/2004) for each group of companies to highlight relative differences over time from a common starting point.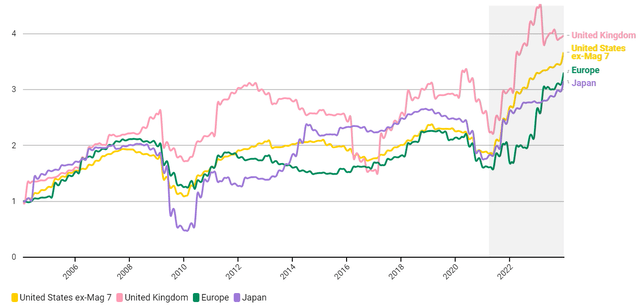
As average earnings have increased across regions, so has the level of cross-sectional dispersion in company earnings
Standard deviation of average operating income (rebased 1/1/2004)
Source: BlackRock, with data from Worldscope, as of February 2024. Measures of operating income are rebased at a value of 1 (starting 1/1/2004) for each group of companies to highlight relative differences over time from a common starting point.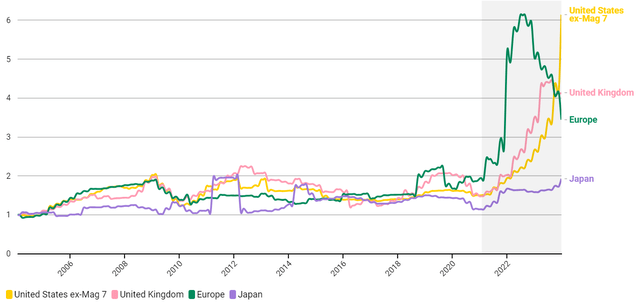
Why might this be the case? Reflation and the return of positive nominal growth can provide more runway for earnings expansion in fundamentally strong companies. The ability to pass on higher prices to customers varies across companies. Additionally, some companies are better than others at capturing nominal revenue growth in bottom line earnings. At the same time, this enhanced opportunity set comes with challenges like a higher cost of capital and muted policy support relative to recent decades that can expose vulnerabilities in companies with fundamental weaknesses. The result is a wider range of potential outcomes, and a significantly enhanced investment opportunity set relative to the one that stock pickers faced for much of the previous cycle.
Fundamental dispersion translates to return dispersion across stocks
In the pre-COVID period, dynamics like zero interest rate policy and quantitative easing both suppressed return dispersion and lifted broad equity market performance. This meant that static market index exposures and strategies tilted towards beta generated strong absolute and risk-adjusted returns.
Now, a higher rate regime sets the stage for more moderate equity beta performance and higher security dispersion as returns are more closely tied to individual company characteristics like earnings growth and profitability rather than broadly benefitting from the previous ‘rising tide lifts all boats’ macro environment.
Stock dispersion is elevated in the post-COVID era
Average annual total return difference between top half and bottom half of MSCI ACWI Index (%)
Source: BlackRock, with data from FactSet as of 12/31/2023. Annual stock dispersion is calculated by taking the average total return of the top half performers of the MSCI ACWI Index (above or equal to the median) and subtracting the average of the bottom half. The stock dispersion chart shows the average of the annual dispersion observations across each period.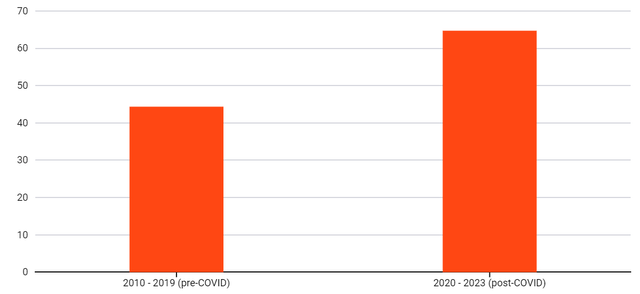
Dispersion creates an expansive opportunity set for long/short equity investors
But a more challenging backdrop for market beta doesn’t mean a lack of investment opportunity. In a world of higher dispersion, it means that the opportunity set is shifting towards a richer environment for generating alpha through security selection.
Beyond selecting the winners of the new regime, managers who invest both long and short can deploy security selection insights to harness dispersion as a return source. This can be done by positioning long/short portfolios to reflect expected return differences across the investment universe, taking long positions in expected relative winners and short positions in expected relative losers. This approach seeks to generate returns in the cross-section of markets, exploiting the spread in performance between long and short holdings in an environment where absolute market returns may be more muted.
Within BlackRock’s Global Equity Market Neutral Fund (BDMIX), we analyze over 7,000 global equities each day through a data-driven process that informs our long/short portfolio positioning. A relatively even split of long and short investments results in a net market exposure of close to zero, greatly reducing the influence of market direction on performance. Instead, returns are driven by our ability to forecast relative winners and losers as opportunities emerge – targeting an uncorrelated alpha return stream. In 2023, we saw this in practice as the strategy delivered a 14.58% return (versus 5.09% for the category benchmark) with just a 0.07 correlation to the S&P 500 Index.1
Evolving portfolios with uncorrelated alpha
Economic and market dynamics have shifted post-COVID. Dispersion in company fundamentals and stock returns is rising, and static beta exposures may face headwinds relative to recent decades. This environment introduces an expansive opportunity set for strategies like BDMIX that can take advantage of higher dispersion to generate uncorrelated alpha – helping to evolve investor portfolios for a new era.
This post originally appeared on the iShares Market Insights.
Credit: Source link