
ipopba/iStock via Getty Images
Finally, this may be the entry point investors have been waiting for in UnitedHealth Group (NYSE:UNH). The stock has been stagnant, essentially trading at a sideways channel between about $440 to $540 since 2022. The midpoint of that range is $490. At writing, the growth stock trades at about $478 per share.
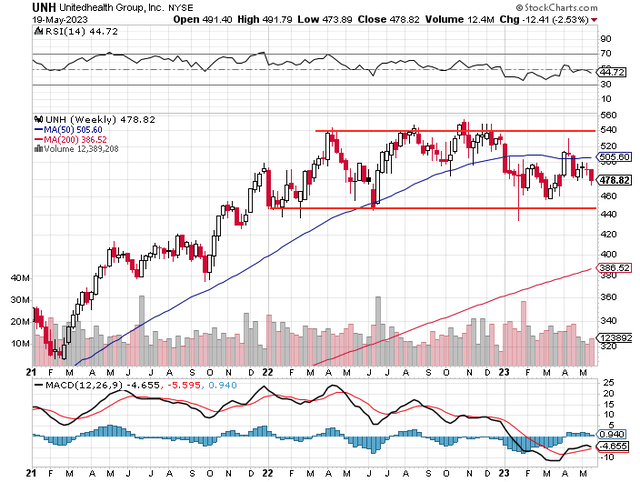
Stockcharts (with author-drawn lines)
Dividend Stock with Good Growth
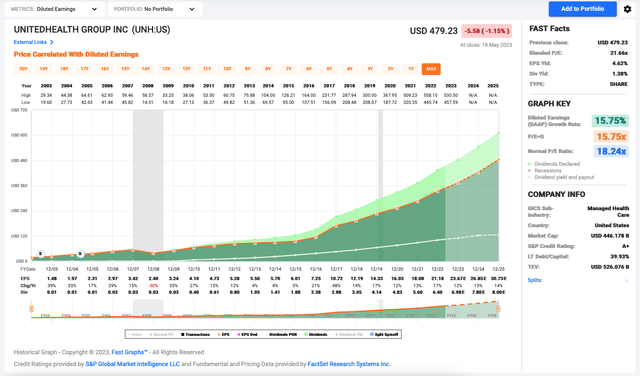
UnitedHealth is a dividend stock, but it’s more like a growth stock. Investors are better looking at it as a growth stock, as the large private health insurance company increased its adjusted earnings per share (“EPS”) by 15.4% per year in the past decade. The compound annual growth rate (“CAGR”) of its diluted EPS of 14.9% is close to that rate and impressive as well.
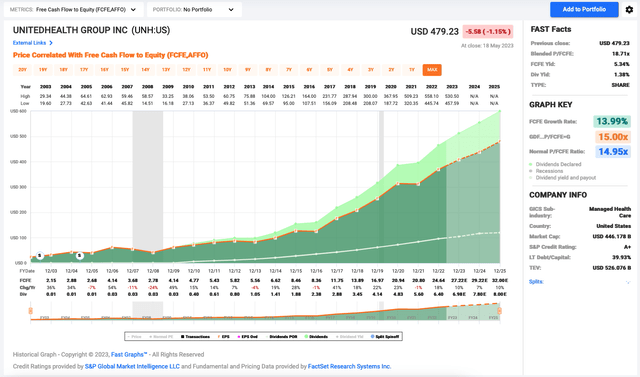
The earnings growth translated to magnificent dividend growth of approximately 24% in the period. Of course, over time, its payout ratio has edged higher as the dividend increased at a faster pace than earnings. However, UnitedHealth still has excellent coverage of its dividend. Its 2022 payout ratio was about 30% of diluted earnings, 23% of operating cash flow, and 26% of free cash flow (“FCF”) last year.
For reference, over the past 10 years, UnitedHealth increased its operating cash flow per share and FCF per share by 15% and 15.5%, respectively. These were solid growth rates of earnings and cash flow that led to healthy dividend growth.
Notably, UnitedHealth is a fairly low-capex business. In the past four years, it only used up 10.5% of its operating cash flow as capital investments, leaving ample free cash flow for other uses (such as dividend raises). Last year, it generated a record FCF of $23.4 billion (versus paying just under $6 billion in dividends.)
Past results can be indicative of future results.
Recent Results
UnitedHealth reported its first-quarter (“Q1”) results last month. Revenues climbed 15% to $91.9 billion versus Q1 2022, while operating earnings rose 16% to $8.1 billion, improving the operating margin slightly to 8.8% (versus 8.7%).
79% of the revenues came from Premiums. This core revenue saw growth of 13.6% year over year. 11% of revenues came from Products, which saw growth of 10%. Under 9% came from services, which jumped 27%.
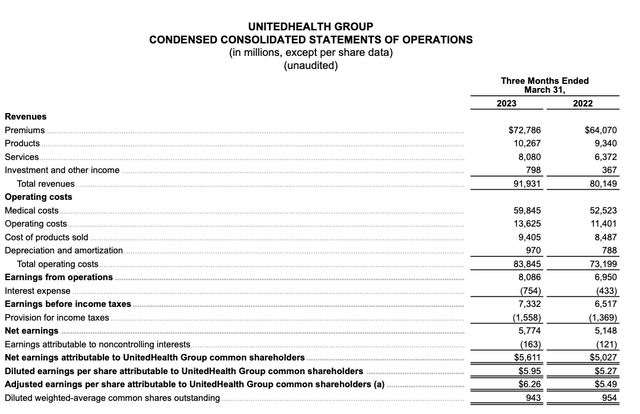
UnitedHealth Group
Investors should note that double-digit revenue growth occurred at both of its business segments — Optum and UnitedHealthcare.
Optum provides healthcare services to its customers. It serves payers, care providers, employers, governments, life sciences companies, and consumers. It has three operations: Optum Health, Optum Rx, and Optum Insight that cover medical and pharmaceutical benefits, outpatient care, and analytics. For the quarter, the Optum segment saw revenue and operating earnings rising 25% and 19%, respectively, year over year.
UnitedHealthcare offers a full range of health benefits, including UnitedHealthcare Employer & Individual (that serves employers ranging from sole proprietorships to large, multi-site and national employers, public sector employers, and individual consumers), UnitedHealthcare Medicare & Retirement (that delivers health and well-being benefits for Medicare beneficiaries and retirees), and UnitedHealthcare Community & State (that manages health care benefit programs on behalf of state Medicaid and community programs and their participants). For Q1, the UnitedHealthcare segment witnessed revenue and operating earnings rising 13% and 14%, respectively, year over year.
2023 Guidance and Valuation
Management increased its 2023 net earnings outlook to $23.25 to $23.75 per share and adjusted EPS to $24.50 to $25.00. Based on the midpoint of its adjusted EPS range of $24.75, which equates to a forward price-to-earnings ratio (P/E) of about 19.3 at roughly $478 per share at writing.
It’s estimated UnitedHealth Group could increase its EPS by about 13% per year over the next three to five years. UNH’s blended P/E is about 20.6, which leads to a reasonable PEG ratio of about 1.58.
Thomson Reuters
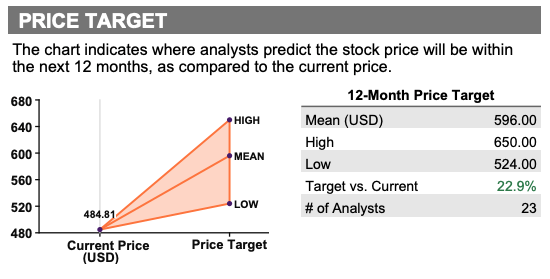
Analysts believe the stock trades at a discount of 20% from the consensus 12-month price target of $596 per share, which also suggests a near-term upside potential of close to 25%. Analysts generally think the stock is undervalued, but it could certainly take longer, perhaps a couple of years, to arrive at close to $600 per share.
Assuming a target P/E of 19 and an adjusted EPS growth rate of 13%, the stock can deliver annualized returns of close to 13% over the next five years.
Investor Takeaway
UnitedHealth Group makes quality earnings and is a free cash flow machine. In a higher interest rate environment, it’s not surprising that the company is more leveraged than it was in Q1 2022, but it’s still awarded an S&P credit rating of A+. (Its debt-to-equity ratio was 2.25x at the end of Q1 2023 versus 1.89x a year ago, while its debt-to-asset ratio was 68% versus 65% a year ago.)
F.A.S.T. Graphs – P/E
F.A.S.T. Graphs – Price to Free Cash Flow
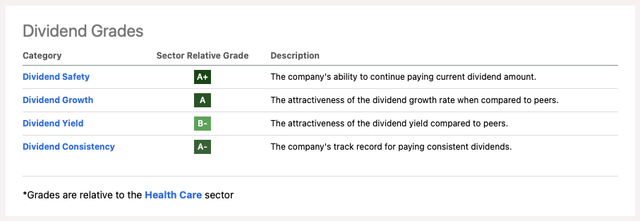
Seeking Alpha gives quality ratings for UNH’s dividend, which we believe is set to increase by about 13% next month.
Seeking Alpha
Because UNH only yields about 1.4% (a forward yield of ~1.6%), investors should focus on total returns in the stock.
Seeking Alpha
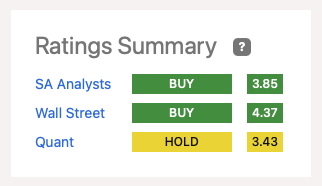
UNH stock could potentially deliver total returns of roughly 13% per year over the next five years. So, we rate it as a “buy”. This recommendation matches with other analysts on Seeking Alpha and Wall Street.
References
- Q1 2023 results
- Form 10-K
Credit: Source link