

Solskin
Our monthly workforce analysis has been updated to include the latest employment report for July. The unemployment rate rose to 4.3%, its highest level since October 2021. Additionally, the number of new non-farm jobs (a relatively volatile number subject to extensive revisions) came in at 114K.
The Unemployment Rate
The closely watched headline unemployment rate is a calculation of the percentage of the civilian labor force, age 16 and older, that is currently unemployed. In the latest report, this indicator rose to 4.3%, which was higher than the forecasted 4.1% rate. This marks the third straight month the unemployment rate has been 4.0% or higher, after 27 consecutive months below 4.0% (the longest streak since the late 60s).
Let’s put this metric into its historical context. The first chart below illustrates this monthly data point since 1990.
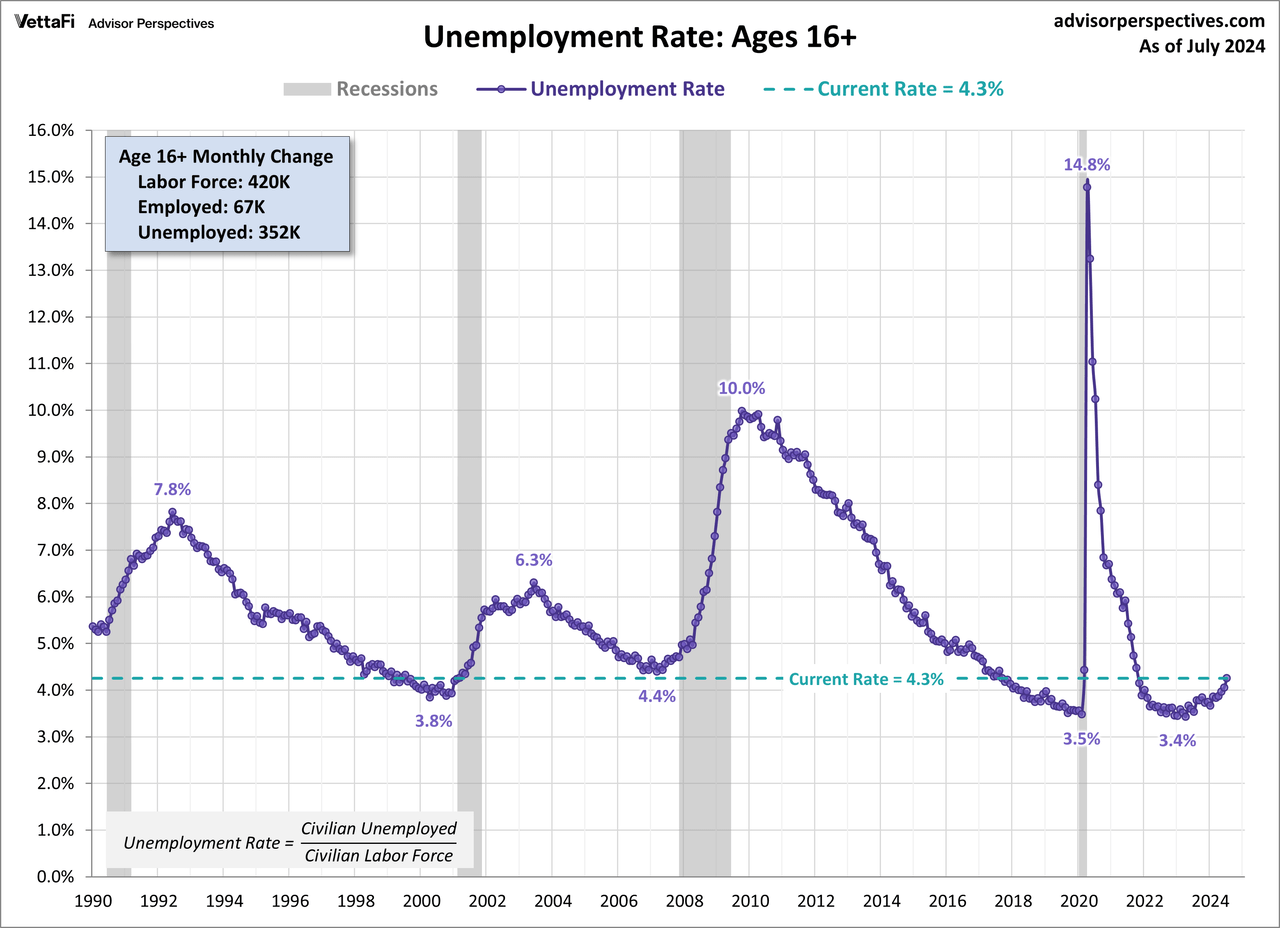
The age 16+ population increased by 206,000 and the labor force increased by 420,000. The breakdown of the growth is an increase of 67,000 employed and a 352,000 increase in the unemployed.
Unemployment in the Prime Age Group (25-54)
Let’s look at the same statistic for the core workforce, ages 25-54. This cohort leaves out the employment volatility of the high-school and college years, the lower employment of the retirement years and also the age 55-64 decade when many in the workforce begin transitioning to retirement… for example, two-income households that downsize into one-income households. In the latest report, this indicator is even lower than the headline figure (4.3%), currently sitting at 3.6%, up from 3.5% the previous month and the highest level since November 2021. The unemployment rate for this cohort has now been below 4.0% for 33 consecutive months, a similar representation to the runup of the 2020 COVID recession (37 months).
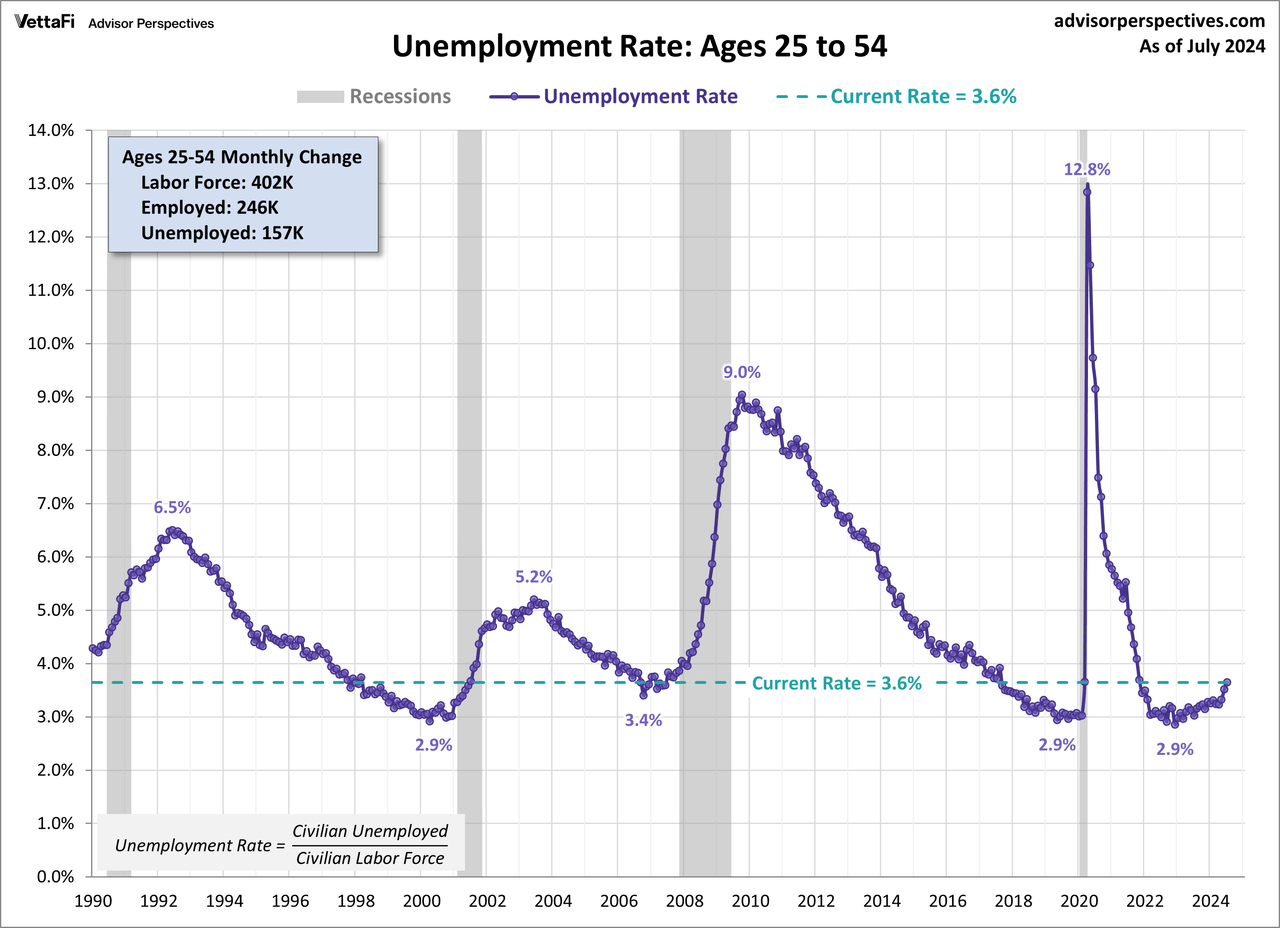
The cohort population increased by 50,000 and the labor force increased by 402,000. The breakdown of the growth is a decrease of 246,000 employed and an increase of 157,000 in the unemployed.
A More Sobering Measure: Labor Force Participation Rate
A wildcard in the two snapshots above is the volatility of the civilian labor force – most notably the subset of people who move in and out of the workforce for various reasons, not least of which is discouragement during business cycle downturns. The chart below continues to focus on our 25-54 core cohort with a broader measure: The Labor Force Participation Rate (LFPR). The LFPR is calculated as the civilian labor force divided by the civilian non-institutional population (i.e., not in the military or institutionalized). Because of the extreme volatility of the metric, our focus is the 12-month moving average.
The latest 12-month moving average is the highest it has been since March 2001 and is continuing to trend upward. Based on the moving average, today’s age 25-54 cohort would require 900,000 labor force participants to match the peak rate around the turn of the century.
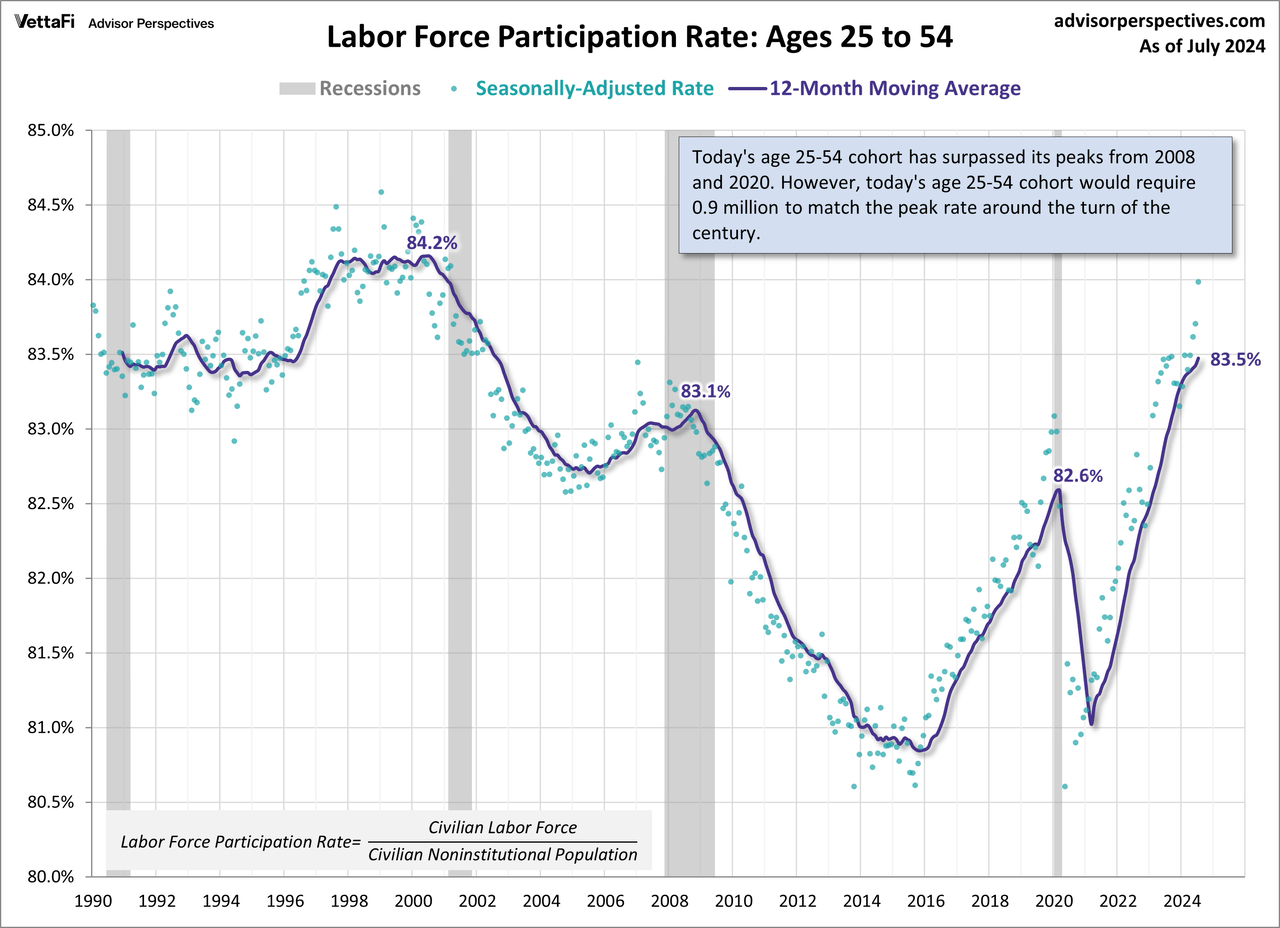
Why are so many labor force participants needed for a complete LFPR recovery? When the economy is moving at full speed, as in the late 1990s, jobs are abundant, which encourages the population on the workforce sidelines to join the ranks of the employed.
Yet Another Measure: Employment-to-Population Ratio
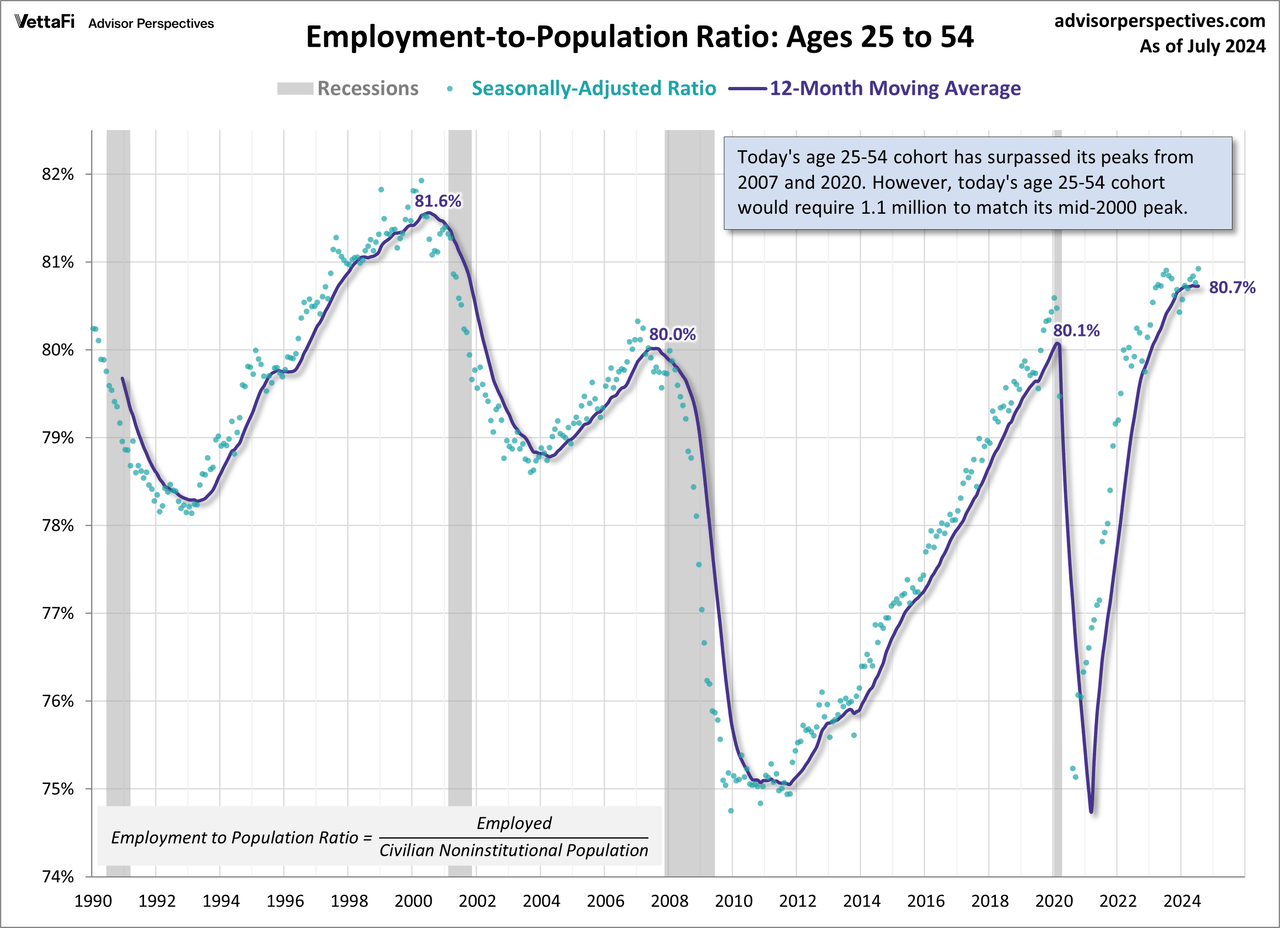
The next chart below shows the Employment-to-Population Ratio (EPR) is calculated as the civilian employed divided by the civilian non-institutional population. Again, our focus is on the 24-54 core cohort and the 12-month moving average. A significant feature of the EPR is that it isn’t affected by the volatility of labor force participants who, for various reasons, are unemployed.
This metric began to rebound from its post-recession trough in late 2012 and surpassed its moving average ratio peak from 2007 in early 2020. However, as a result of the COVID pandemic, the metric sharply declined for just over a year before quickly rising to and just barely surpassing its moving average ratio peak from 2007. The current age 25-54 cohort would require a 1.1 million participant increase to match its mid-2000 peak.
A Structural Change in the Economy
The charts above offer strong evidence that our economy is in the midst of a massive structural change. Unemployment has essentially reached its “natural” rate. Additionally, the labor force participation rate and employment to population ratio for the 25-54 age group cohort have climbed back up to levels last seen pre-Great Recession.
In order to discount the general belief that the aging of the baby boom generation is a major factor in weak employment, we’ve focused on the 25-54 age group. Also, by excluding the age 55-64 decade associated with early or pre-retirement, we’ve eliminated a cohort that might include a major source of discouraged or less-determined workers.
The Growth of the Elderly Workforce
Let’s close this analysis with a chart that essentially demolishes the prevailing view of our aging population as a demographic drag on labor supply. Here is the ratio of the 65-and-over cohort as a percent of the employed civilian population all the way back to 1948, the earliest year of government employment data. Mind you… these people are not only in the workforce but also actually employed.
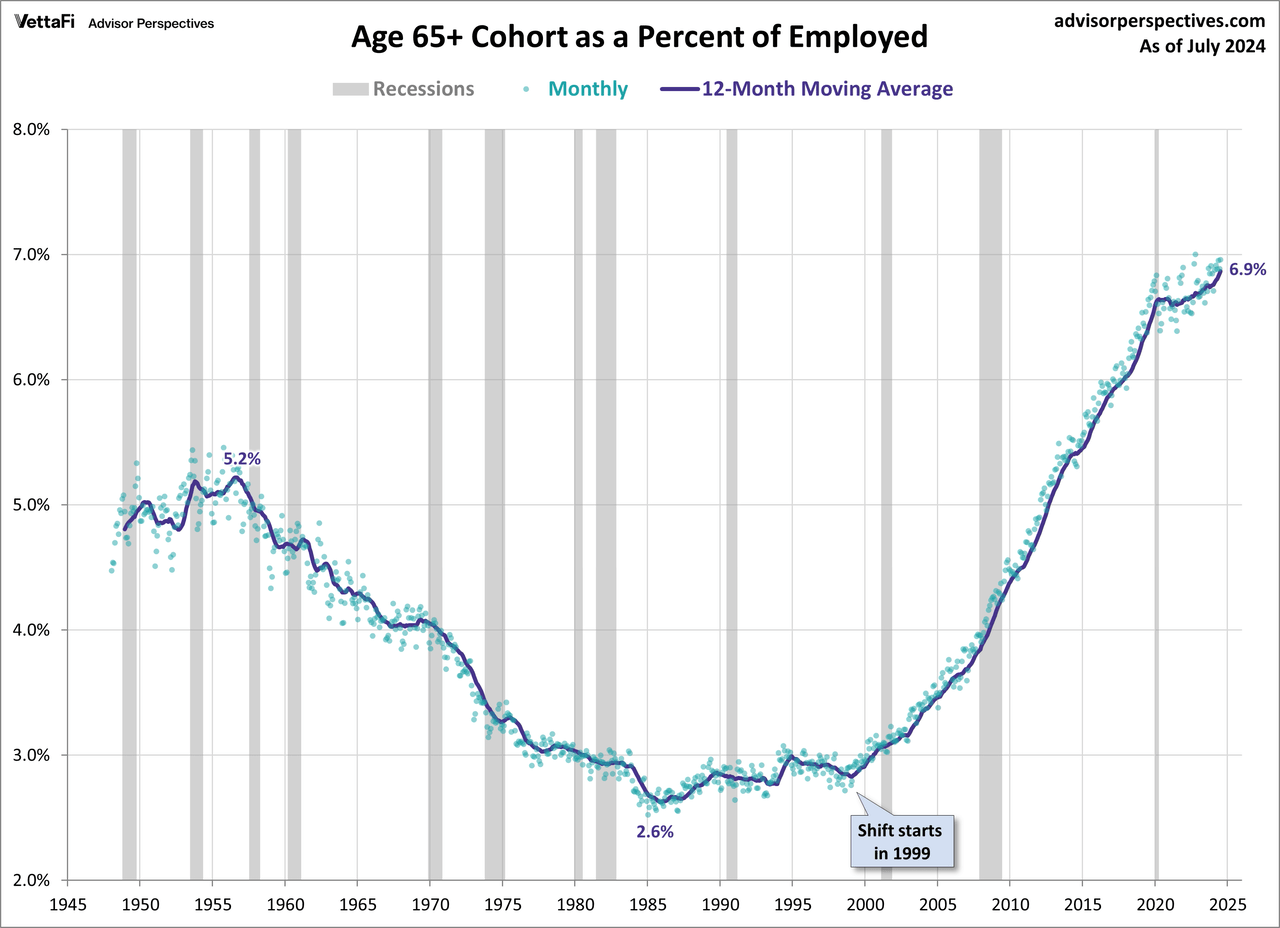
The 12-month moving average of elderly employment is current at its historic high of 6.9% and now over double its low in the mid-1980s. This is a trend with multiple root causes, most notably longer lifespans, the decline in private sector pensions and frequent cases of insufficient financial planning. Another major factor is the often surprising discovery by many of the elderly that, financial consideration aside, the “golden years of retirement” are less personally satisfying than productive employment. Note that the growth acceleration began in the late 1990s, prior to the last three business cycle downturns (aka “recessions”).
In Conclusion…
This structural change in employment continues to have a major impact on the overall economy, and this change has been exacerbated by the great recession and the COVID recession. Another could have an even greater impact.
Original Post
Editor’s Note: The summary bullets for this article were chosen by Seeking Alpha editors.
Credit: Source link