









































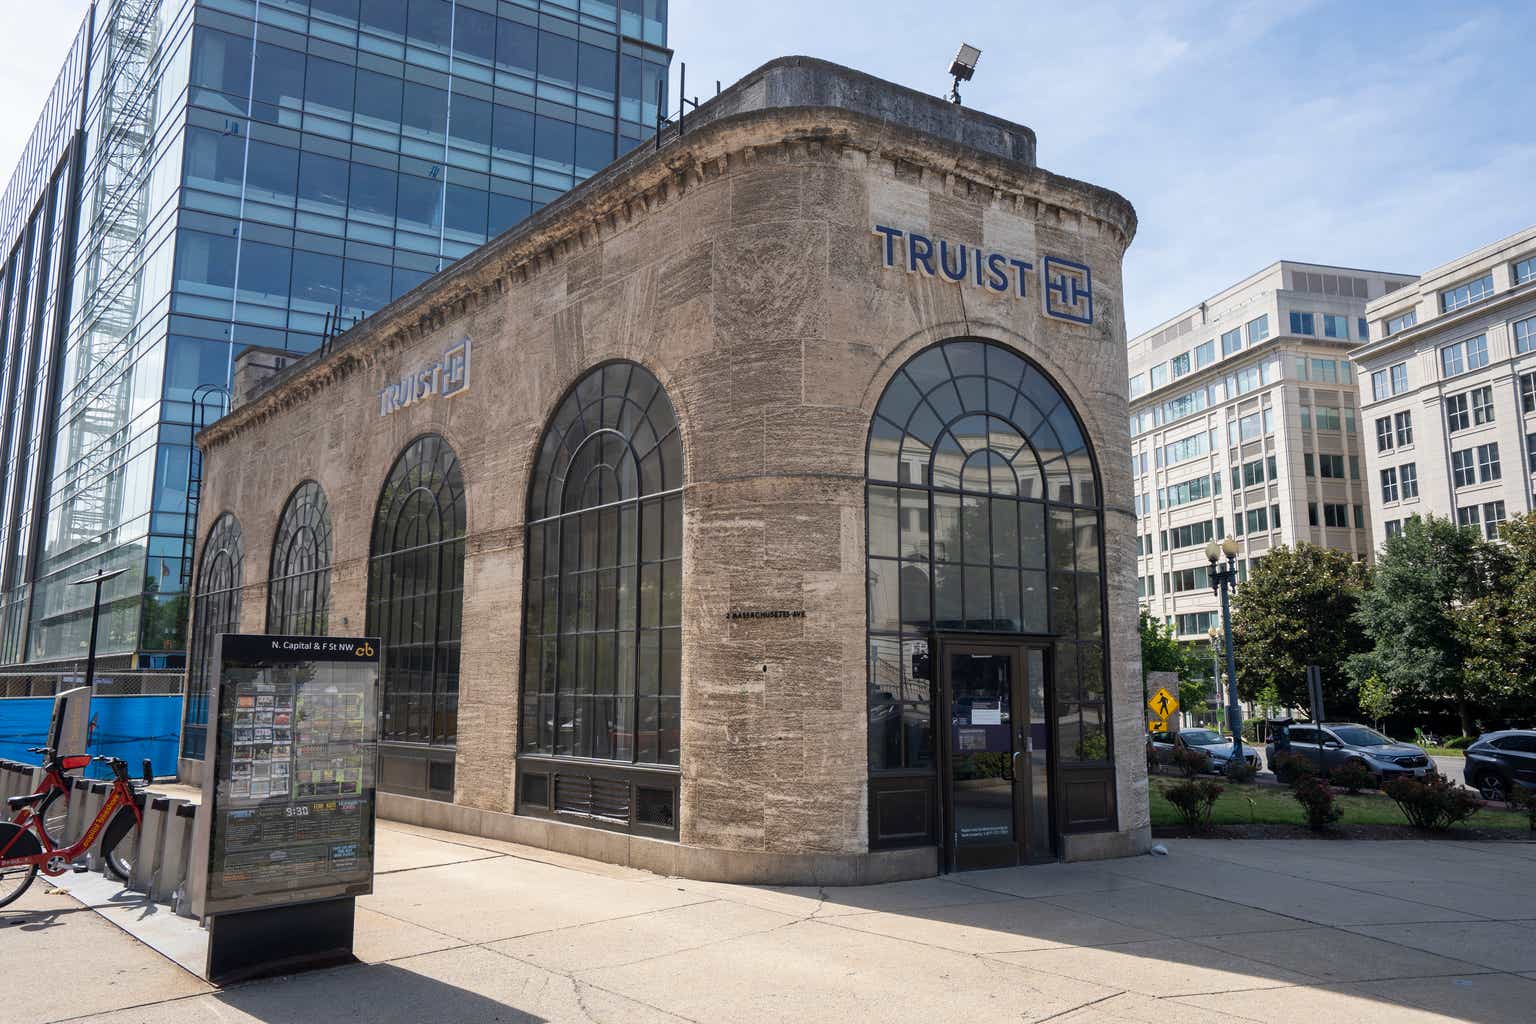

hapabapa
Regional banks are finally coming to life. The SPDR S&P Regional Banking ETF (KRE) is among the best-performing industry ETFs in the last month, sharply outperforming the S&P 500 after major struggles from March through early May of this year. The current round of earnings reports has been mixed, but KRE remains near its best levels since mid-March.
Following an earnings miss earlier this week, I have a hold rating on Truist Financial Corporation (NYSE:TFC). I see the stock near fair value with a solid yield, but the chart is stuck in a holding pattern.
1-Month ETF Performance Heat Map: KRE a Winner
Finviz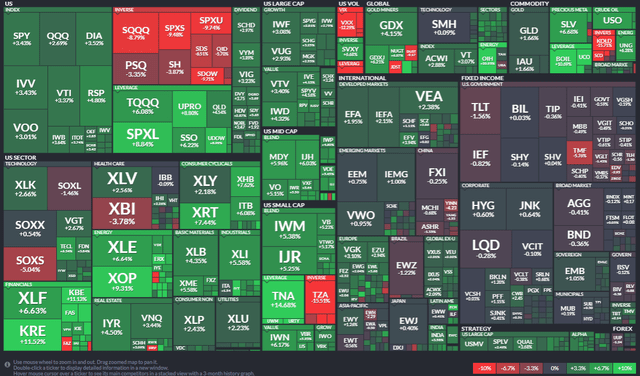
According to Bank of America Global Research, TFC is a Charlotte, North Carolina-based financial services company with more than $500 billion in assets. With a history dating back to the Civil War, and currently the 6th-largest bank in the US by deposits, TFC offers a wide variety of different financial products ranging from consumer and commercial banking to securities brokerage and asset management.
The $47 billion market cap regional banks industry company within the Financials sector trades at a low 7.9 trailing 12-month GAAP price-to-earnings ratio and has a high 5.9% dividend yield and moderate implied volatility of 36% post-earnings. Short interest is modest at 2.8% as of July 20, 2023.
Back on Thursday, TFC reported a bottom-line miss as its net interest income and margin figures disappointed analysts’ expectations. Maybe more troubling was that the management team slashed guidance. The bank had expected full-year adjusted revenue on a tax-equivalent basis to increase 5% to 7%, but it now sees a 1% to 2% range. With Q2 EPS verifying at $0.92, $0.11 under the consensus estimate, and lower per share profits from a year ago, the stock plunged more than 7% in response, underperforming its peers by about 8 percentage points.
The soft profit report came after TFC revised downward its outlook just a month ago. Ongoing challenges with the SunTrust/BB&T integration appear and its exit from the insurance business is still a question mark. Some good news was that its CET1 capital ratio jumped 50 basis points to 9.6% at quarter-end, and the firm expects that figure to be near 10% by late 2023. Overall, the report was disappointing, and the soft outlook is concerning.
Net Interest Income Falling On Funding Cost Pressures
Truist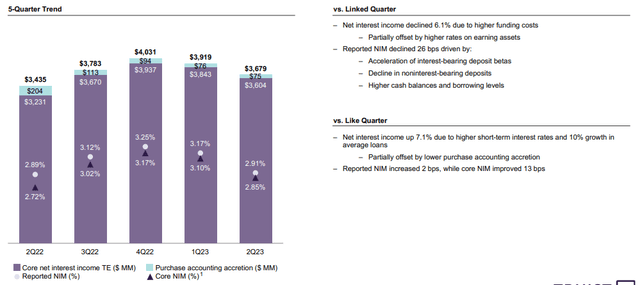
A Weak Q3 Outlook
Truist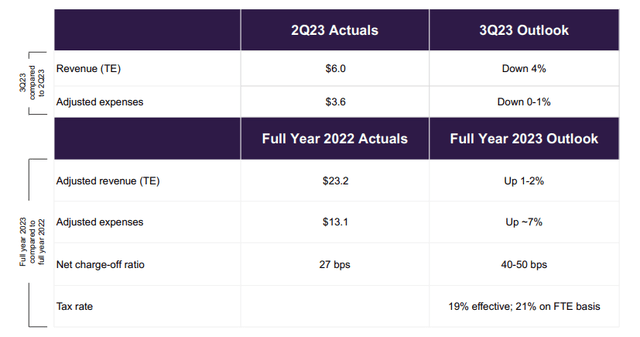
On valuation, analysts at BofA see earnings falling sharply this year before stabilizing in 2024 with a rebound seen in 2025. The Bloomberg consensus forecast is more optimistic about the growth trajectory through the next two years, though. Dividends, meanwhile, are expected to hold just above $2 in the coming quarters, but then return to an upwards path by ’25.
With single-digit operating and GAAP earnings multiples, the stock appears cheaply priced, but so too is much of the Financials sector (particularly the embattled regional banks). With a high yield this year – the highest since the Great Financial Crisis – investors are paid to wait for the dust to settle in TFC.
TFC: Earnings, Valuation, Dividend Yield Forecasts
BofA Global Research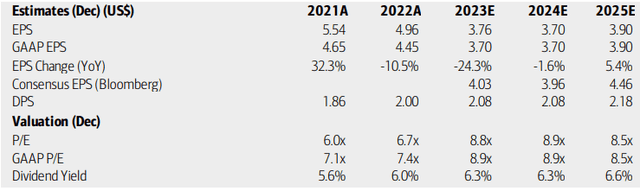
TFC: Historically High Dividend Yield
YCharts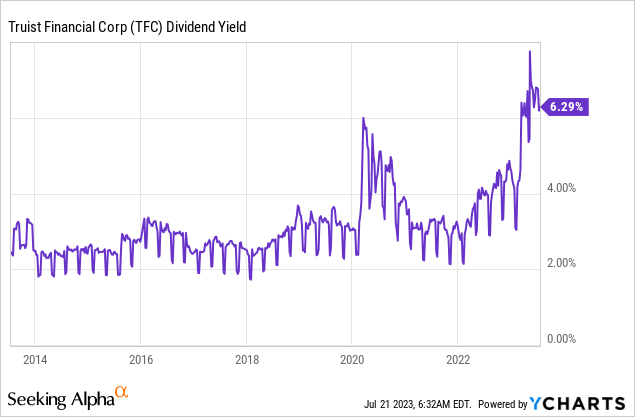
If we assume $3.80 of normalized earnings per share in 2025, then we must heavily discount the multiple used due to the negative EPS growth over the coming quarters. The market has done that for us as evidenced by TFC’s 5-year average P/E of 12.2 and its current 9.0 forward operating earnings multiple. So, the valuation comes to $34.20 using these figures. The price-to-book ratio is likewise discounted. The good news here is that the dividend should remain stable so long as no further shoes drop.
TFC: Strongly Profitable, Soft Growth Warrants A Discounted Valuation
Seeking Alpha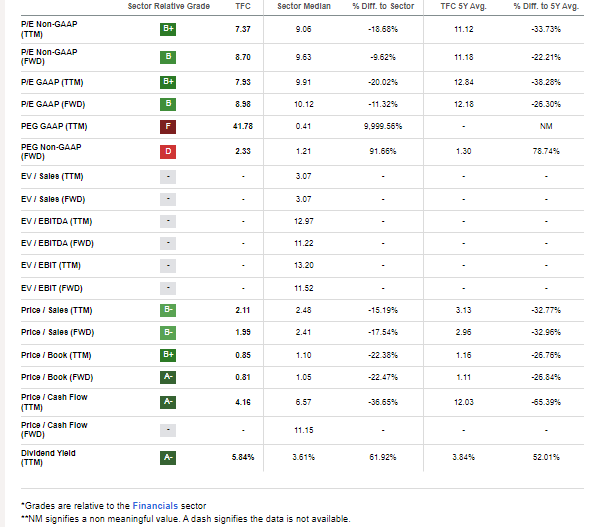
Looking ahead, corporate event data provided by Wall Street Horizon show a confirmed Q2 2023 earnings date of Thursday, October 19 BMO with a conference call immediately after the numbers hit the tape. You can listen live here.
Corporate Event Risk Calendar
Wall Street Horizon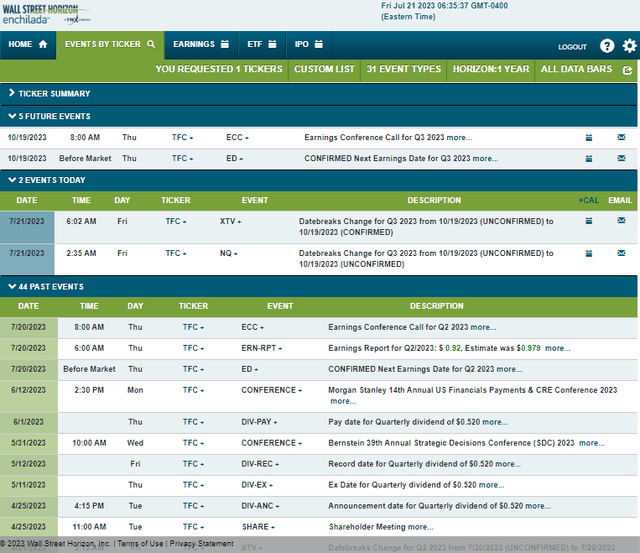
The Technical Take
More than three months removed from the domestic regional banking crisis, price action in TFC is constructive, but we are not yet seeing a definitive breakout. Notice in the chart below that shares were rejected at resistance post-earnings this week. The $35 to $36 area continues to give the bulls fits. If there is an upside breakout, then I see the next resistance in the $39 to $40.50 zone – that is where the falling 200-day moving average and the Q4 2023 range lows come into play.
I also spot high volume by price both in the low $30s and in the mid to upper $40s. That means pullbacks from here should have some support while investors might look to trim profits if the stock breaks out to a bullish price objective I’ll highlight. What is encouraging is that the RSI momentum indicator at the top of the chart is in a solid uptrend – that could portend an eventual climb above noted resistance levels. If we see a jump above $36, then a measured move price target based on the bottoming pattern would be about $46 – putting TFC right back in that mid-$40s congestion range.
Overall, it is a neutral chart right now as the stock keeps consolidating.
TFC: Struggles At Resistance
StockCharts.com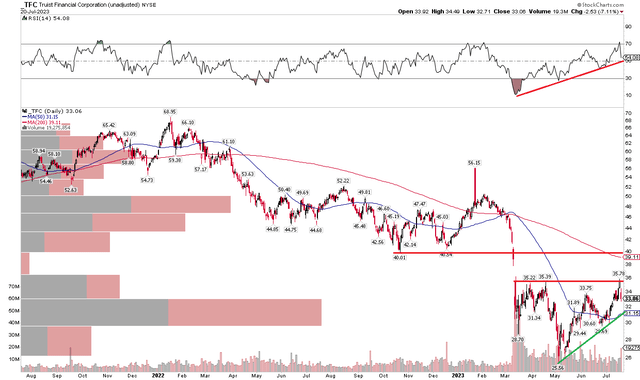
The Bottom Line
I have a hold rating on TFC. The valuation appears fair today while the technicals are not as sanguine compared to the rest of the industry. What I like is that stability in the space should help keep TFC’s yield historically high.
Credit: Source link









