

jittawit.21/iStock via Getty Images
The long-run performance for the Global Market Index (GMI) rose to a 6.3% annualized pace in June, moderately above the previous month’s estimate. The shift marks the second month of firmer estimates.
The forecast is based on the average estimate for three models (defined below) and remains near the lower range for realized performance in recent history, based on a rolling 10-year return.
GMI is an unmanaged, market-value-weighted portfolio that holds all the major asset classes (except cash). The underlying components of GMI continue to post high forecasts vs. their current trailing 10-year returns – a condition that implies tilting allocations toward the higher ex ante estimates.
The US stock market continues to be the exception in the extreme. American shares are projected to earn a substantially lower return vs. the performance over the past decade.
Meanwhile, GMI’s current 6.3% forecast is fractionally above its 10-year advance, which suggests trimming holdings for US equities, especially if the weight is above its target for a given portfolio.
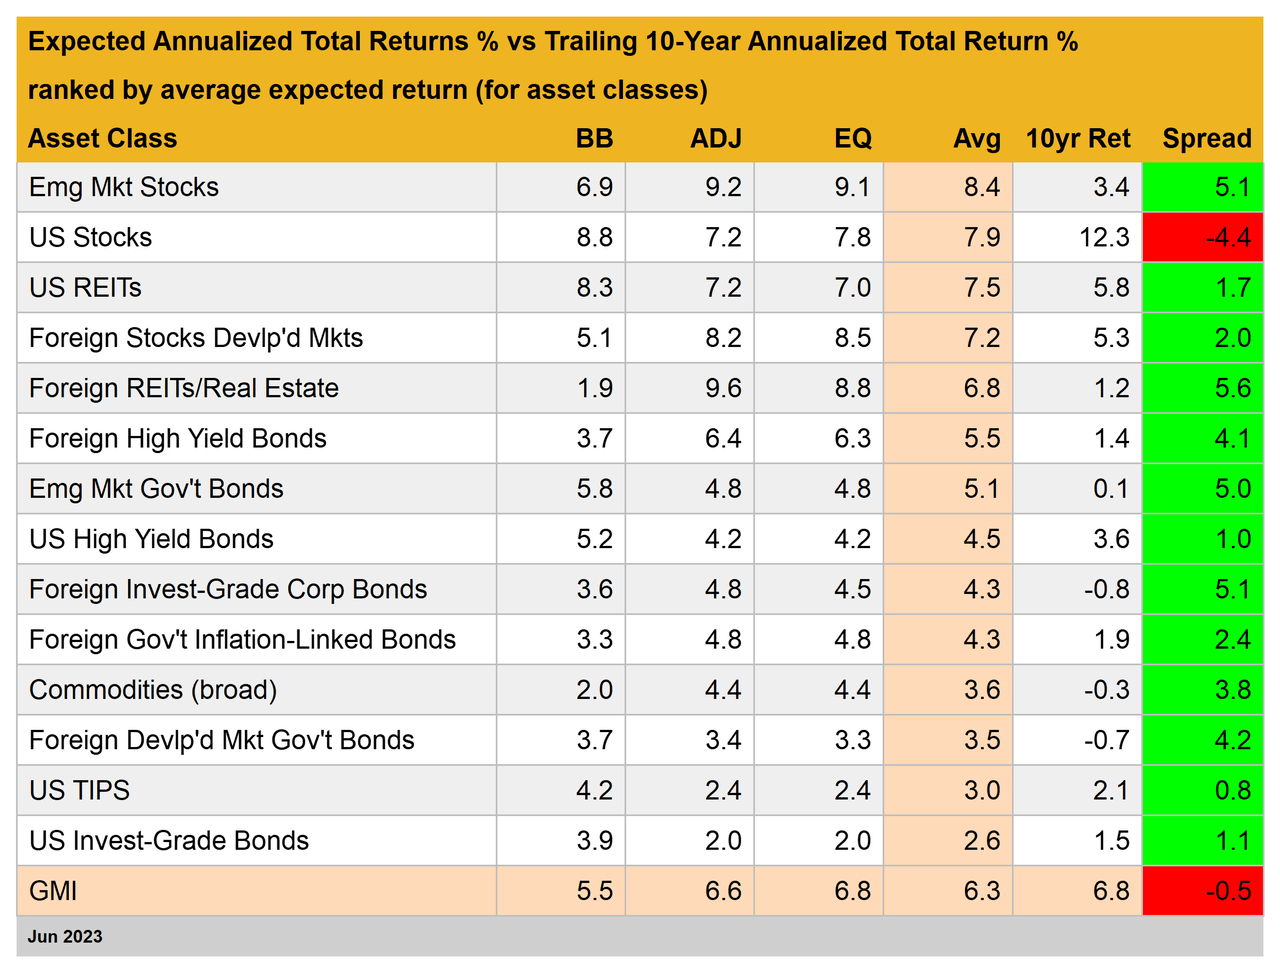
Note, too, that GMI’s ex ante performance is modestly below its trailing 10-year return. That’s a hint for managing expectations down in terms for what a globally diversified multi-asset-class portfolio will deliver in the years ahead vs. the past decade.
GMI represents a theoretical benchmark of the optimal portfolio for the average investor with an infinite time horizon. On that basis, GMI is useful as a starting point for research on asset allocation and portfolio design.
GMI’s history suggests that this passive benchmark’s performance is competitive with most active asset-allocation strategies, especially after adjusting for risk, trading costs and taxes.
Keep in mind that some, most or possibly all of the forecasts above will likely be wide of the mark in some degree. GMI’s projections, however, are expected to be somewhat more reliable vs. the estimates for the individual asset classes.
Predictions for the specific market components (US stocks, commodities, etc.) are subject to greater volatility and tracking error compared with aggregating forecasts into the GMI estimate, a process that may reduce some of the errors through time.
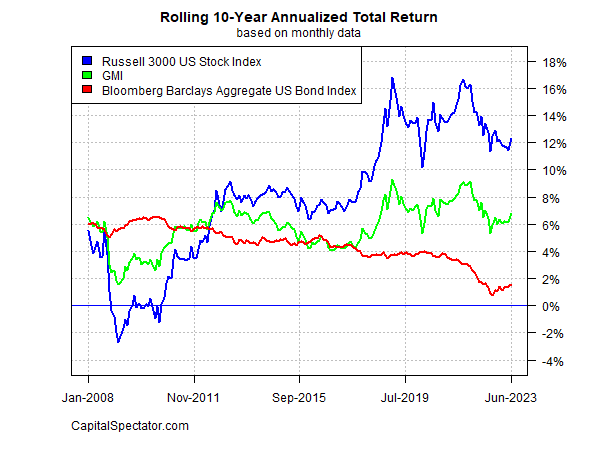
For context on how GMI’s realized total return has evolved through time, consider the benchmark’s track record on a rolling 10-year annualized basis. The chart below compares GMI’s performance vs. the equivalent for US stocks and US bonds through last month. GMI’s current 10-year return is 6.8%. That’s up from recent levels over the past year or so but well below the highs for the trailing five-year window.
Here’s a brief summary of how the forecasts are generated and definitions of the other metrics in the table above:
BB: The Building Block model uses historical returns as a proxy for estimating the future. The sample period used starts in January 1998 (the earliest available date for all the asset classes listed above). The procedure is to calculate the risk premium for each asset class, compute the annualized return and then add an expected risk-free rate to generate a total return forecast.
For the expected risk-free rate, we’re using the latest yield on the 10-year Treasury Inflation Protected Security (TIPS). This yield is considered a market estimate of a risk-free, real (inflation-adjusted) return for a “safe” asset — this “risk-free” rate is also used for all the models outlined below. Note that the BB model used here is (loosely) based on a methodology originally outlined by Ibbotson Associates (a division of Morningstar).
EQ: The Equilibrium model reverse engineers expected return by way of risk. Rather than trying to predict return directly, this model relies on the somewhat more reliable framework of using risk metrics to estimate future performance. The process is relatively robust in the sense that forecasting risk is slightly easier than projecting return. The three inputs:
* An estimate of the overall portfolio’s expected market price of risk, defined as the Sharpe ratio, which is the ratio of risk premia to volatility (standard deviation). Note: the “portfolio” here and throughout is defined as GMI
* The expected volatility (standard deviation) of each asset (GMI’s market components)
* The expected correlation for each asset relative to the portfolio (GMI)
This model for estimating equilibrium returns was initially outlined in a 1974 paper by Professor Bill Sharpe. For a summary, see Gary Brinson’s explanation in Chapter 3 of The Portable MBA in Investment. I also review the model in my book Dynamic Asset Allocation.
Note that this methodology initially estimates a risk premium and then adds an expected risk-free rate to arrive at total return forecasts. The expected risk-free rate is outlined in BB above.
ADJ: This methodology is identical to the Equilibrium model (EQ) outlined above with one exception: the forecasts are adjusted based on short-term momentum and longer-term mean reversion factors. Momentum is defined as the current price relative to the trailing 12-month moving average.
The mean reversion factor is estimated as the current price relative to the trailing 60-month (5-year) moving average. The equilibrium forecasts are adjusted based on current prices relative to the 12-month and 60-month moving averages.
If current prices are above (below) the moving averages, the unadjusted risk premia estimates are decreased (increased). The formula for adjustment is simply taking the inverse of the average of the current price to the two moving averages.
For example: if an asset class’s current price is 10% above its 12-month moving average and 20% over its 60-month moving average, the unadjusted forecast is reduced by 15% (the average of 10% and 20%).
The logic here is that when prices are relatively high vs. recent history, the equilibrium forecasts are reduced. On the flip side, when prices are relatively low vs. recent history, the equilibrium forecasts are increased.
Avg: This column is a simple average of the three forecasts for each row (asset class)
10yr Ret: For perspective on actual returns, this column shows the trailing 10-year annualized total return for the asset classes through the current target month.
Spread: Average-model forecast less trailing 10-year return.
Original Post
Editor’s Note: The summary bullets for this article were chosen by Seeking Alpha editors.
Credit: Source link