

HendrikDB
Investment Thesis
Treasuries have outperformed equities over the past two weeks as signs of an economic slowdown have finally started to emerge. Particularly, while the treasury yield curve has steepened—with the front end dropping more sharply than the long end—the iShares 20+ Year Treasury Bond ETF (NASDAQ:NASDAQ:TLT) has delivered a strong total return due to its long duration. In my previous coverage in June, I remained bullish on long-duration Treasuries like TLT, given the attractive risk-reward profile amidst economic deterioration. Since then, TLT has achieved a total return of 4.2%, outperforming the S&P 500 index by 4.8%, even as broad-based indexes experienced a strong rebound.
I believe the market consensus on the macro backdrop has shifted toward a narrative where the CPI YoY continues to decline while job data worsens. While I admit that long-term supply and demand under fiscal deficit conditions may limit the significant upside potential of long-duration Treasuries, the persistent trend of lower inflation and higher unemployment rate will create strong upside potential for TLT. Therefore, I upgraded to a “strong buy” on TLT and recommend that investors extend the duration of their bond holdings during any pullbacks. However, I still think TLT can face significant near-term volatility.
CPI YoY Dropped Below 3%
Investing.com
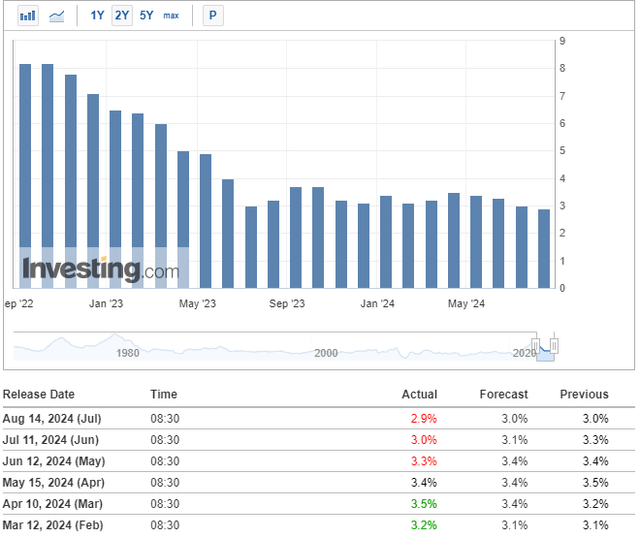
We clearly see that inflation has been consistently cooling, with the CPI YoY not only trending downward over the past three months, but also coming in lower than market expectations. Recently, the CPI YoY even dropped below the 3% mark for the first time since 2021, reinforcing the narrative of urgent rate cuts. When the CPI YoY surged to over 9% in 2022, the Fed slowly responded by raising rates to the 5.25%-5.50% range. Now, with inflation down to 2.9% YoY, the fed fund rate still remains unchanged, indicating a highly restrictive level. In my view, the Fed needs to reduce rates as soon as possible. Otherwise, the market may begin to price in a hard landing, especially after a series of negative economic data.
CME FedWatch Tool
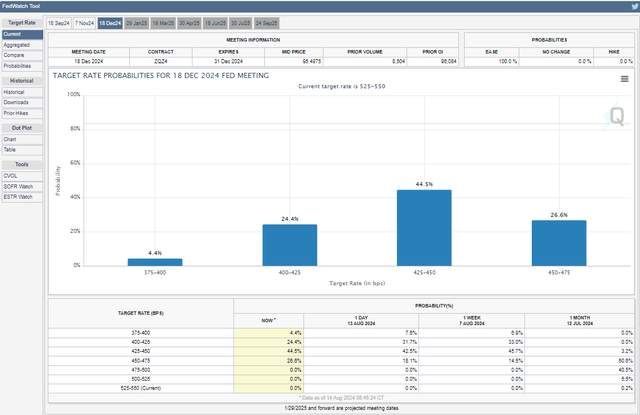
Nevertheless, the Fed funds futures has already priced in four 25 bps cuts by the end of 2024, beginning with a 25 bps cut at the September Fed meeting. Just a week ago, the bond market was anticipating a potential emergency rate cut before the next Fed meeting and a 50bps cut in September. Meanwhile, most banks, including JP Morgan and Goldman Sachs, have recently increased the probability of a recession.
BLS
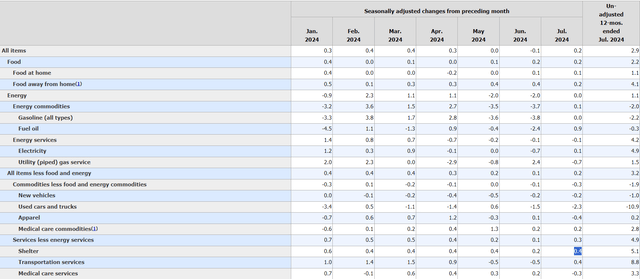
However, there is a catch. The recent CPI data shows that housing costs were the primary driver of July’s inflation, indicating persistent inflation in the housing sector. While overall inflation may not rebound and trend higher, this entrenched housing inflation could prevent the CPI YoY from easing to the Fed’s 2% target. This creates potential volatility for TLT, especially if we do not see a near-term recession.
4.3% Unemployment Rate and SAHM Rule
Investing.com
Normally, long-duration Treasuries are perceived as a “safe haven” asset and have a negative correlation with equities. An anticipated deterioration in economic data will provide a stronger tailwind for TLT’s upside potential than a soft-landing scenario with lower inflation and a resilient economic backdrop. In the case of a soft landing, front-end treasuries will offer a better risk-reward profile. This is because the yield curve would likely experience bear steepening, where long-term yields may even rise due to the headwinds of a fiscal deficit, increasing the term premium for long-duration treasuries, which could lead to TLT underperforming.
FRED
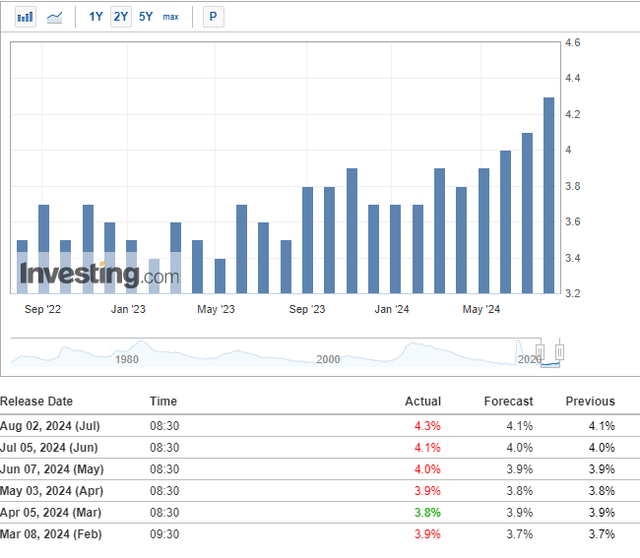
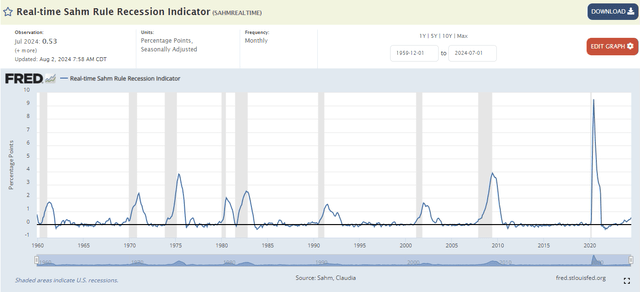
However, I’m shifting away from a soft-landing scenario due to recent weakening job and PMI data. The unemployment rate has been steadily rising over the past four months, increasing from 3.8% in March to 4.3% in July. According to JP Morgan, the Sahm Rule was triggered after the latest jobs report. The Sahm Rule indicates that when the unemployment rate’s three-month average is 0.5% higher than its 12-month low, the economy is in recession. Since 1970, this rule has never failed to predict a recession. As shown in the chart, the current percentage increase has reached 0.53% since being triggered on August 2nd. Historically, previous recessions have followed shortly after this signal was triggered, with the percentage points trending significantly higher, indicating a rapid rise in the unemployment rate. While historical indicators can’t always predict the future, other signals pointing toward a hard landing make me bullish on TLT as a hedge against recession risk.
Yield Curve Steeping but Still Inverted
CNBC
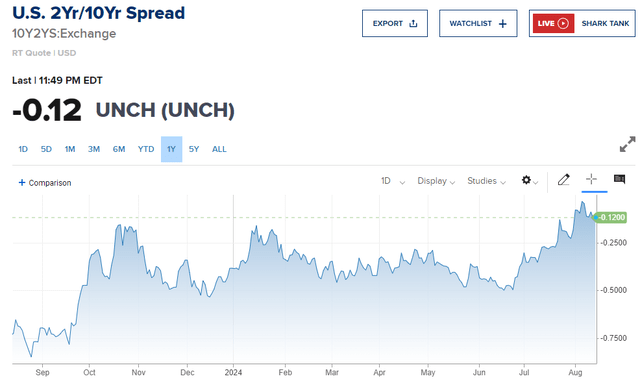
Typically, the average lag between the first yield curve inversion and an economic downturn is 6 to 24 months. Although the recent market pullback led to a steepening of the yield curve due to faster rate cut expectations, the 2–10-year spread (2-year yield minus 10-year yield) remains inverted at -12 bps, as shown in the chart, down from -112 bps since my last coverage. We are now 23 months into this period, and the Sahm indicator has triggered a recession signal this month.
We Might Be in A Recession in A “Normal” Business Cycle
I want to specifically highlight that earnings consensus in the U.S. equity market has been largely driven by a few mega-cap companies benefiting from the GenAI growth tailwind. As mentioned in my last article, without this GenAI narrative, earnings in the S&P 500 composite could experience a year-over-year decline in the last and the current quarter, supporting my view that we are already in a recession within a “normal” business cycle. However, investors should keep in mind that companies like “the Magnificent 7” (excluding Tesla) with strong year-over-year earnings growth will face very high comparable in the next fiscal year. Therefore, even if we do not see a significant deterioration in corporate earnings at the index level, the recession could be delayed—not only due to excess savings and pandemic stimulus but also because it may be pushed into next year.
TLT Is Flashing Technical Bullish Signals
MarketWatch
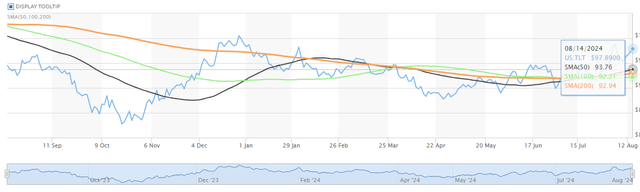
Before the recent “growth scare” that sent TLT to an overbought level last week, it’s important to note that TLT had already flashed a strong bullish signal in July. As shown on the chart, TLT is trading above all its major moving averages, including the 50, 100, and 200 MAs. On July 16th, the 50 MA crossed above the 200 MA, signaling a “golden cross,” a bullish indicator not seen since February this year. We also observe that TLT has continued to bounce back after a near-term consolidation last week. I believe that if job data continues to deteriorate in upcoming releases, TLT is likely to break its December 2023 high and trend higher. However, if economic data improves or inflation shows signs of a rebound, TLT’s upside momentum could be reversed, immediately.
Conclusion
Based on recent economic data, including a steadily rising unemployment rate, cooling inflation, and a Manufacturing PMI below 50, it appears increasingly likely that the U.S. economy is moving from a slowdown into a recession, especially given the yield curve’s inversion for nearly two years. While GenAI-driven earnings boosts in mega-cap companies have made corporate earnings resilient at the index level, the consistent decline in CPI YoY and weakening job data support the case for continued Fed rate cuts, making long-duration treasuries like TLT more attractive. However, the potential for a soft landing with resilient economic data could limit TLT’s upside. Given the current macro backdrop and the technical bullish signals in TLT, extending the duration of bond holdings during any pullbacks is warranted. Therefore, I am upgrading the rating to “strong buy.”
Credit: Source link