


DNY59
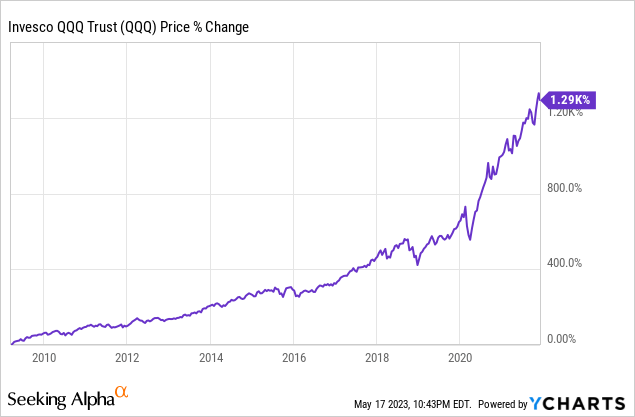
From 2009 to 2021, we experienced one of the most powerful bull markets in modern history. This is especially true for Nasdaq (NASDAQ:QQQ) since it increased its value by 1290% (almost 13 bagger) during this period until it topped in November of 2021 as you can see below.
The funny thing is during this period Nasdaq has never been as expensive as it is today despite rallying relentlessly for 12 years. Below you will see QQQ’s P/E history since 2009 and notice that it’s P/E value had been expanding from 10 to 35 from 2009 to 2021 which means we saw a 250% multiple expansion during this period but still QQQ was never as expensive as it is today. In the graph below you will notice that there was a time at the peak of 2021 where QQQ traded for a P/E of 35 and that it is currently trading for a P/E of 30 so you might be inclined to think that it is cheaper today than it was in 2021 but this isn’t so. You might wonder how come a P/E of 30 is more expensive than a P/E of 35 and I will try to explain this in the remainder of this article.
Created on Excel by Author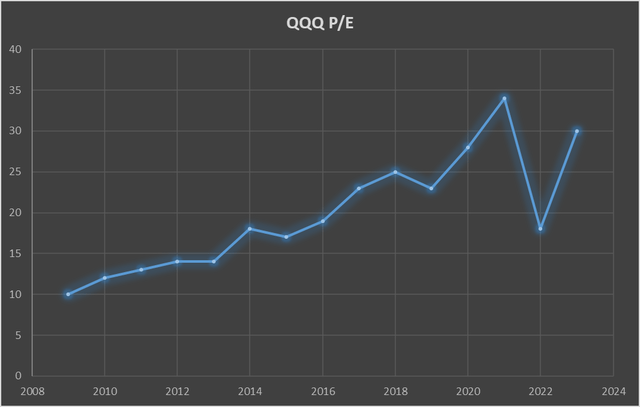
First of all, there is no perfect way to value stocks. Neither is there a method on which all investors agree. If this was the case markets wouldn’t be so volatile day to day. There are many different models and theories as to how to calculate a stock’s perfect value. One of the most common and most accepted methods is Discounted Cash Flow method which also happens to be used by legendary investors like Warren Buffett, Benjamin Graham and Peter Lynch. Again, even within this methodology there are different schools of thought and different nuances but the general idea is the same. You take a company’s current earnings, its growth rate, cost of cash (bond yields) and try to calculate its fair multiple value in order to see its fair value.
No matter which model you use, two things are very important for calculations. First is the discount rate which is basically the prevalent bond yield. The fair P/E value for stocks will be significantly different when interest rates are at 0%, 5%, 10% and so on. This is why markets crashed hard in 1980s when Fed was aggressively hiking rates because fair P/E values dropped like a rock. In 2021, Nasdaq’s when P/E ratio was 35, Fed’s funds rate was 0.25%. Today when Nasdaq’s P/E ratio is 30, Fed’s funds rate is at 5.25%. When Fed’s funds rate jumps from 0.25% to 5.25%, fair value of P/E multiples drop from 10% to 50% depending on which model you use to run your calculations. Let’s take mid-point and apply a 30% discount rate which means today’s P/E ratio of 30 is equivalent of 2021’s P/E ratio of 39 (30% higher). Now our graph below looks a bit different (notice that it also looks slightly different for 2018 and 2019 when Fed was hiking rates briefly).
Created on Excel by Author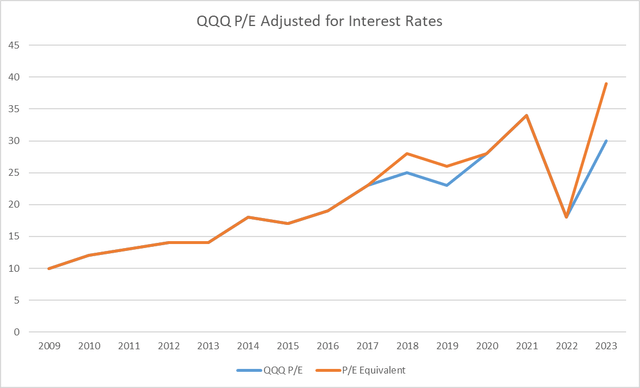
There is more though. Another important factor for calculating a fair multiple of stocks is their growth rate. After all there is a reason why some stocks trade for a P/E of 10 while others trade for a P/E of 100 because investors are trying to guess a company’s future earnings and price it in accordingly. Again, there is no agreed-upon way of calculating what fair P/E multiple is based on growth rates but everyone agrees that higher growth rates justify higher multiples. Between 2009 and 2016, Nasdaq companies grew their earnings by about 15% on average. From 2016 to 2021, the average growth rate accelerated to 22% partly thanks to the boost during COVID period where people spent their time and money at home on technological devices, apps and services. When tech companies were growing their earnings at 15-20% rate, a P/E of 25-30 might be justified but how about when their growth has completely stalled and in many cases actually reversed? Currently Nasdaq companies are expected to see their earnings actually shrink by 5-10% and this is the first time since 2008 that this is happening.
Today Nasdaq’s P/E of 30 while its components are seeing their earnings shrink looks more expensive than when Nasdaq’s P/E was 35 but tech companies were growing 20% year over year. The last time Nasdaq companies saw their earnings shrink, the index had a P/E in low 10s not 30.
There is a less-known metric that is sometimes used in lieu of P/E ratio which is PEG. This metric takes a company’s P/E ratio and divides it by the company’s growth rate in order to calculate its fair value based on its growth. PEG ratios below 1.0 are considered cheap, PEGs around 1.0 to 1.5 are considered fairly valued and PEGs above 1.5 are considered expensive. Below are the top 8 companies in QQQ which account for 54% of the total weight of the index. Notice that companies like Microsoft (MSFT), Apple (AAPL) and Nvidia (NVDA) are seeing their PEG values at sky high levels. There are only 2 companies with PEG values below 1.0 but they are not much below with one being at 0.948 and the other being 0.923.
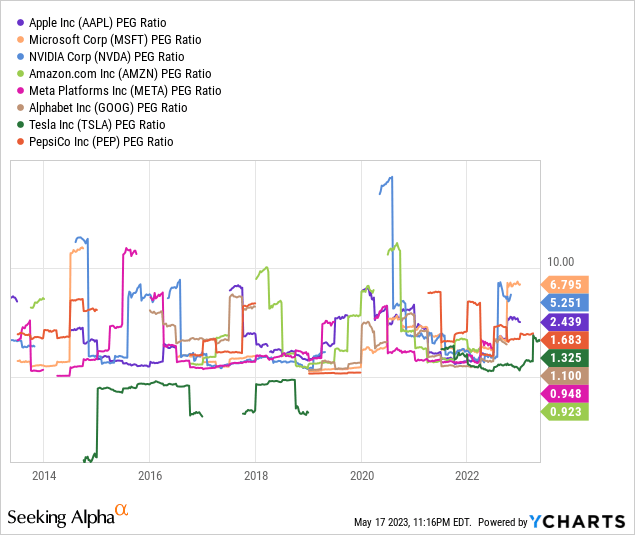
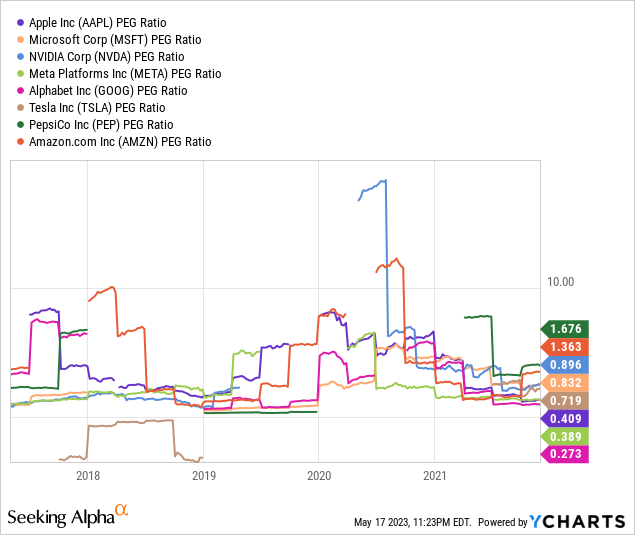
Below you will see PEG values enjoyed by the same companies a couple years ago when Nasdaq’s P/E was as high as 35. You’ll notice that back in November of 2021, PEG ratios of the same companies ranged from 0.27 to 1.67. For example Microsoft had a PEG ratio of 0.83 versus today’s 6.7 so even though Microsoft now has the same P/E as it did in 2021, it’s about 8 times more expensive today than it was in 2021. Another example is Apple whose PEG jumped from 0.40 to 2.43 since QQQ’s last top in 2021. Back in 2021, even Nvidia had a PEG ratio below 0.9. Today the same company’s PEG is at 5.2. You will also notice that Tesla (TSLA) had a PEG of 0.71 versus today’s 1.32.
Back then Nasdaq’s P/E of 35 was well justified considering 0% rate environment and 20-25% growth rate. Today’s P/E of 30 is not justified given 5.25% interest rates and total lack of growth. In order for Nasdaq to become cheaper than it is right now, either corporate earnings have to jump significantly or prices have to fall. Currently many indicators show that the economy is slowing down and although most tech companies beat analyst estimates, their forward guidance calls for further drops in their profits. It could be 2-3 years before corporate profits return to where they were at the peak of 2021.
I didn’t even mention other factors such as declining liquidity levels, ongoing quantitative tightening, rising costs, dropping margins, possible credit crunch, possibility of a recession and many other factors that could result in even lower fair multiples for valuations.
Since the beginning of the year, QQQ is up 25% without any pullbacks, corrections or meaningful dips. There hasn’t even been any profit-taking yet. It’s been going up in a straight line and we aren’t even done with half of the year yet. As much as Nasdaq is concerned markets are all greed and no fear right now.
All in all, when you consider interest rates and declining growth rates, QQQ is now more expensive than it was at any period since 2009. Today Nasdaq still trades as if Fed’s interest rate is at 0% and tech profits are growing 15-20% per year but neither is the case. We can keep playing this “pretend” game and keep rallying on multiple expansion alone while corporate profits continue to fall and interest rates remain high but no one knows how sustainable that would be in the long run.
Credit: Source link


