

Oppenheim Bernhard/DigitalVision via Getty Images
The claim that small-cap stocks outperform large-cap stocks has too often been accepted as a factual statement by the investment community. This well-established characteristic of stock returns has even earned itself an enduring place in academic literature, also widely referred to as the “size” factor. The most cited academic literature on the size factor is a 1992 paper by Kenneth French and Eugene Fama. The authors posited that an overwhelming 90% of a stock’s returns can be attributed to the size of a company, exposure to the overall market, and value.
However, our own observation indicates that company size may not be a reliable factor for generating superior returns, even over long investment horizons. Moreover, we suspect that the size factor may even be detrimental to portfolios if modern markets continue to develop in a manner that disproportionately favours larger enterprises.
In this article, we shall present and compare the performance of small-cap stocks versus large-cap stocks over several different time frames. We shall then explore structural reasons that may potentially undermine the future performance of small-cap stocks.
Historical Performance Of The Russell 2000, The Russell 1000, And The S&P 500
To provide a broad and fair comparison of the performance of small-cap versus large-cap stocks, we can start by comparing the respective exchange-traded funds (ETFs) that replicate the performance of the Russell 2000 Index and the Russell 1000 Index. The Russell 2000 Index tracks the stock performance of 2000 of the smallest stocks listed in the U.S. by market capitalization, while the Russell 1000 Index tracks the largest 1000 stocks.
Below is a chart comparing the total returns of the iShares Russell 2000 ETF (IWM) and the iShares Russell 1000 ETF (IWB) since 2000. Total returns assume all dividends are reinvested over the period. For good measure, we have also added the more popular SPDR S&P 500 ETF Trust (SPY), which tracks the stock performance of 500 of the largest stocks listed in the U.S. by market capitalization.
Investment Horizon of ~23 years
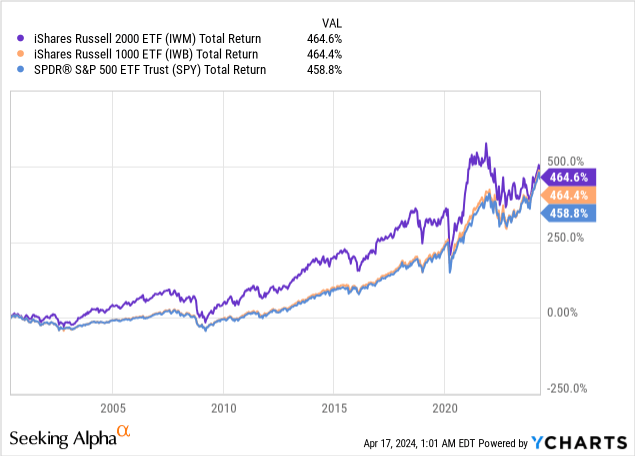
From a long-term perspective (~23 years), small-caps represented by IWM have indeed outperformed large-caps represented by IWB and SPY. However, this outperformance in small-caps seems inconclusive due to the tiny margin.
Even over a long investment horizon of ~23 years, small-cap stocks only outperformed IWB by a negligible 0.2%, and the SPY by 5.8%.
If the size factor had been stable and truly provided a statistical edge that could be harvested for factor investing, we would expect this edge to accumulate steadily over time. Instead, there appears to be no conclusive evidence that small caps generate excess returns compared to large caps. Furthermore, the visibly larger drawdowns exhibited by small-caps during bear markets indicate that small-caps also do not provide superior risk-adjusted returns to large-caps.
Perhaps we should examine the performance over different time frames. Below is a chart comparing the total returns of the same ETFs over a shorter investment horizon of 10 years.
Investment Horizon of 10 Years
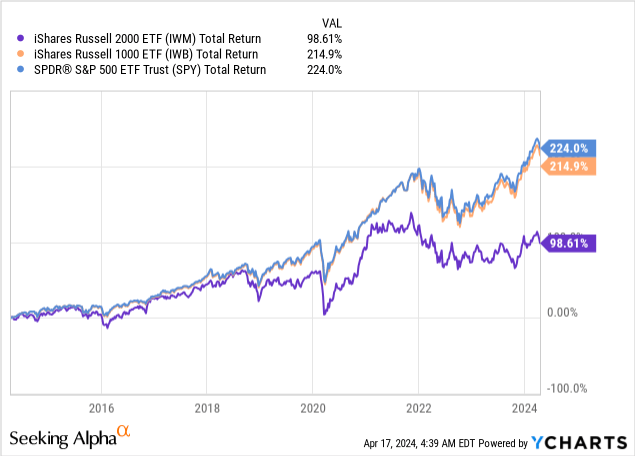
Looking at a shortened time frame, the performance of small-cap stocks dramatically deteriorated. The IWM underperformed the IWB and SPY by staggering margins of -116% and -125%, respectively.
Investment Horizon of 5 Years
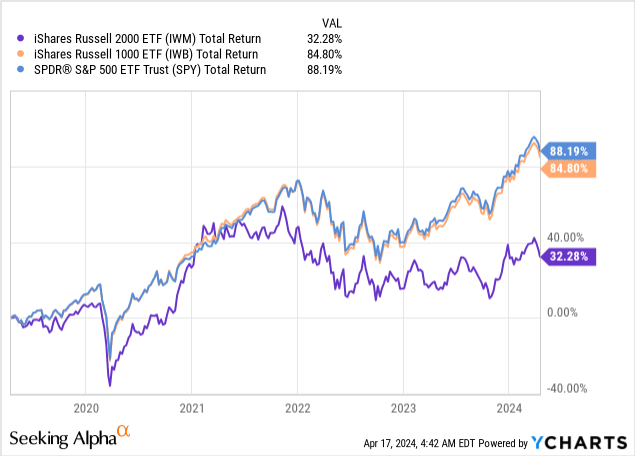
Within a 5-year time frame, the IWM again, underperformed the IWB and SPY by margins of -53% and -56%, respectively.
Yet Another Futile Search For The Holy Grail?
Some sharp-eyed readers may have noticed a recurring pattern at this point: small caps seem to underperform during bear markets (2008, 2020, and 2022) and outperform during bull markets.
We believe this could very well be one of the reasons why some analysts believe that small-caps may start to outperform again. Especially given that the SPY is looking increasingly more expensive and narrowly driven by big technology companies, the thesis to rotate into small-caps may be too tempting for investors to pass.
Such behaviour, however, is not much different from speculative market timing. Not only do investors need to catch small-caps near market troughs, but they will also need to sell near the peaks. The thing is, if one genuinely has the ability to catch market peaks and troughs consistently, extracting returns from the size factor would not matter anymore. One would have already found the holy grail.
Arguments In Favour Of Investing In Small-Caps
One major argument in favour of investing in small-cap stocks is that smaller companies hold much greater growth potential. This is true given that small companies tend to be more scalable and have more room to develop and expand into new growth markets, while larger companies may experience diminishing returns to scale at some point.
Another argument that attracts more debate is the claim that smaller companies tend to be valued at a discount to larger companies, thereby providing prospects for higher returns over time. However, the validity of this valuation argument needs to be verified.
First of all, fair valuation is a rather loose concept that is dependent on how one defines and quantifies value. On one hand, it is quite common to see small caps trading at much higher multiples versus the average large-cap stock, simply based on the argument that small caps offer the prospect of higher earnings growth. On the other hand, large caps may trade at higher multiples versus the average small-cap stock because investors are risk-averse and may be willing to pay for a liquidity premium and a quality premium. Thus, one would first need to determine whether a sample of stocks is fairly valued and controlled for quality and liquidity differences before any meaningful comparisons can be made. This represents a practical challenge and hurdle for most non-institutional investors.
Secondly, even if we assume that this valuation discount on small caps does exist, the discount may simply be a reflection of the higher risks inherent in investing in small caps.
Survivorship Bias & Structural Factors Undermining Small-Cap Growth
Investors should also be aware of survivorship bias, which is much more acute when tracking small companies compared to larger ones because small companies tend to be financially weaker and have less control over their markets. Thus, many small companies may stagnate or fail before they even come close to becoming multi-billion dollar companies.
This bias is inherent in small-cap stock indices, which do not reflect the performance of companies that are regularly dropped from the indices due to outright failures, mergers and acquisitions, and delistings.
At a more fundamental level, there are also structural factors that we think may disproportionately undermine small-caps as the modern capitalist system and economy continue to evolve.
Today, large corporations not only have better access to low-cost capital and talent due to their financial strength and economies of scale, but they are also much more capable of influencing regulatory changes and managing other industry-level risks. Having the ability to fill and renew boardrooms with members who have decades of experience and powerful networks is a huge advantage that will be difficult for smaller companies to match.
Specifically in terms of risks, larger companies can better hedge against commodity price risks, possess more bargaining power when negotiating with suppliers, and have more flexibility in diversifying revenues or investing in new businesses.
Garyfox.co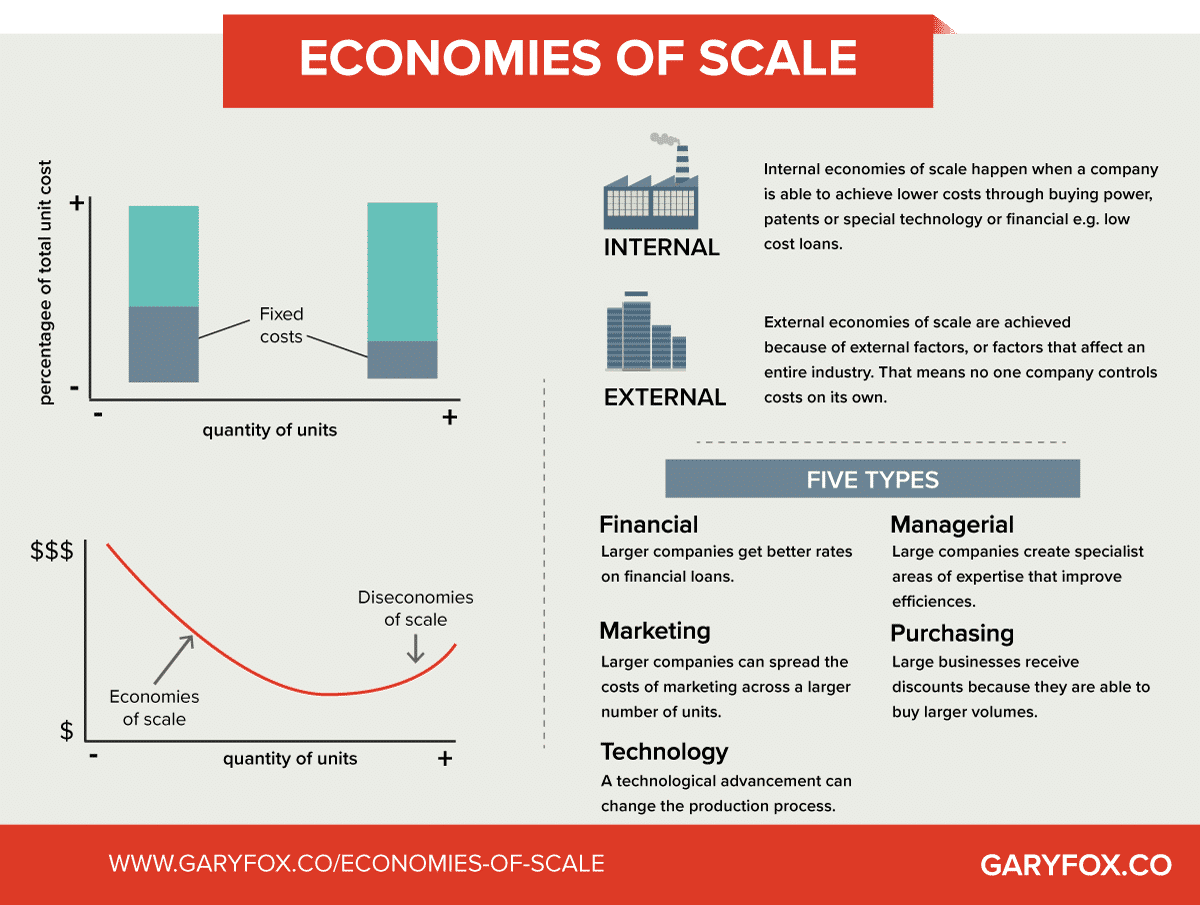
Without having to dive into a long list of advantages that work in favour of larger companies, we hope our readers have at least developed an appreciation for the complexity associated with small-cap investing. That small-cap investing is probably not as simple as buying a broad basket of small companies and hoping that will help boost portfolio returns.
The good news is that the complexity of analyzing small-cap stocks presents the opportunity for diligent investors to generate alpha. Investors who can distinguish between the winners and the lemons are not only in a better position to manage downside risks but should also generate better returns over time.
Credit: Source link