
marekuliasz
Based on the behavior of various proven leading economic indicators, we have been warning about a major US recession coming, as we did here.
Three of the best leading economic indicators — all of which are being ignored by the Fed and most investors — are the money supply, the yield curve and The Conference Board’s Leading Economic Index.
Leading Economic Indicators Have Been Declining
Money is the lifeblood of the economy. The Fed’s manipulation of the money supply is the key driver of the boom and bust business cycle, as we discussed in 4 Reasons A Long Recession Is Likely To Start Soon.
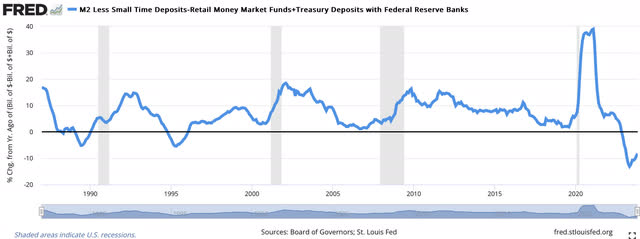
The money supply has been declining for a year and reached double-digit declines in mid-2023, as shown in the chart below. That is the deepest money supply decline since the Great Depression of the 1930s, which is not a bullish precedent.
FRED
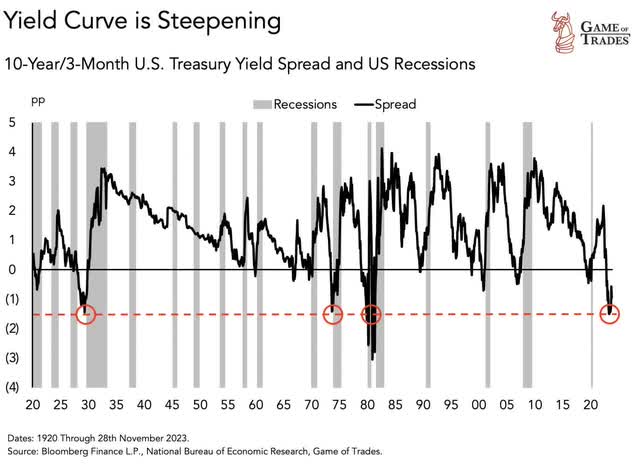
The decline in the money supply has led to a significant increase in short-term interest rates. As a result of the increase in short-term rates, the yield curve “inverted” in 2022. An “inverted” yield curve — which occurs when the 10-Year Treasury yield falls below the 3-Month Treasury yield — has preceded each of the last eight recessions since the late 1960s.
As shown below, the depth of the yield curve inversion we have seen over the past year has only been rivaled by the yield curve inversions that preceded the Great Depression of the early 1930s, as well as the major recessions of the mid-1970s and early 1980s. Given its perfect track record over the past 50+ years, it would be something of a miracle to not have a recession this time.
Game of Trades
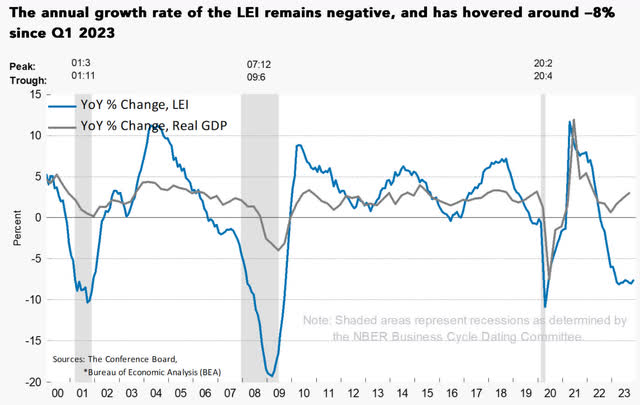
The Conference Board’s Leading Economic Index (“LEI”) has fallen to levels only seen during recessions. This is not a bullish sign.
The Conference Board
Justyna Zabinska-La Monica, Senior Manager of Business Cycle Indicators at The Conference Board, summarized their latest LEI report as follows:
The US LEI continued declining in November, with stock prices making virtually the only positive contribution to the index in the month. Housing and labor market indicators weakened in November, reflecting warning areas for the economy. The Leading Credit Index and manufacturing new orders were essentially unchanged, pointing to a lack of economic growth momentum in the near term. Despite the economy’s ongoing resilience—as revealed by the US CEI—and December’s improvement in consumer confidence, the US LEI suggests a downshift of economic activity ahead. As a result, The Conference Board forecasts a short and shallow recession in the first half of 2024.”
While I agree with The Conference Board that there will be a recession in 2024, I think their “short and shallow” expectation sounds like wishful thinking. Their LEI has declined for 20 straight months, which is the longest period of decline other than the Great Recession of 2008-2009 and the major “stagflationary” recession of the mid-1970s.
Given the behavior of these three leading indicators, I think the odds favor a long and deep recession.
Regardless of the severity of the recession, it may not matter for stocks. Recall that the early 2000s recession was relatively short and shallow, but the NASDAQ still fell over 80% then due to high valuations. Unfortunately, stock market valuations are even higher now, as I detailed here.
Coincident Economic Indicators Have Already Started Declining
Unfortunately, these leading economic indicators are notorious for having long and variable lead times before the start of a recession, usually ranging from six to 24 months.
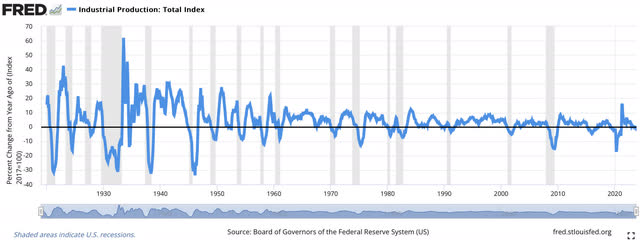
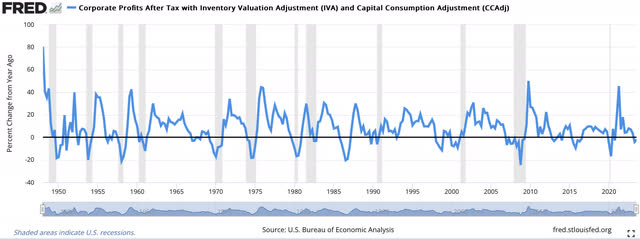
But when coincident indicators like industrial production and corporate profits start declining, that is typically a good indication that a recession is starting. That has already been happening.
Industrial production has been declining since June and was down 0.4% in December. This key gauge of US output always falls in a recession, as shown below.
FRED
Corporate profits are the lifeblood of the stock market. As this chart shows, they have been declining the past two quarters and were down 2.1% in 3Q23. As with industrial production, profits always fall in a recession.
FRED
Leading Employment Indicators Have Been Declining
Employment is a lagging economic indicator and is usually the last one to fall in a recession. It is also the one that gets the most investor attention.
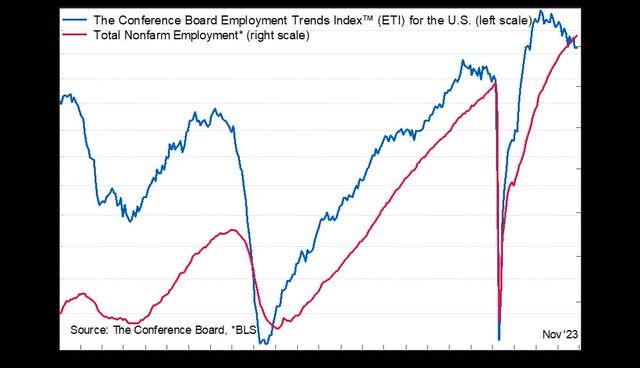
The Conference Board publishes a leading Employment Trends Index (“ETI”). As shown here, their ETI has been declining since Spring 2022. Based on the successful track record of this index, payrolls will likely start declining in the coming months.
The Conference Board
As Seljuk Eren, Senior Economist at The Conference Board, explained here:
The ETI continued to trend downward after peaking in March 2022. While the index is still elevated compared to its pre-pandemic level—and job gains are expected to continue in December and early 2024—the labor market shows clear signs of cooling with fewer opportunities available for jobseekers. With the labor market supply and demand coming into balance and consumer price inflation slowing, we believe the Federal Reserve will no longer increase interest rates.
Over the last six months, payroll employment growth was almost entirely driven by healthcare and social assistance, leisure and hospitality, and government. Employment growth in these industries is less likely to be impacted by a recession, given acute labor shortages. Job growth in other industries has been flat or negative. Elsewhere, we see clear signs of cooling with several component indicators of the ETI pointing to loosening labor demand. The number of employees working in temporary help services—an important early indicator for hiring in other industries—resumed its decline in November from its peak in March 2022. Initial claims for unemployment insurance increased for a second consecutive month in November, though they remain low historically. From The Conference Board Consumer Confidence Survey, the share of respondents that reported jobs were hard to get reached its highest level since March 2021, while a smaller share of small firms reported difficulties hiring. Looking ahead, we project that job growth will continue slowing and forecast job losses will start in the second quarter of 2024, with the unemployment rate rising to 4.3 percent by the second half of 2024.”
If the unemployment rate increases to 4.3%, as The Conference Board predicts, that would be a 0.9% increase from the 3.4% low in 2023. Every time the unemployment rate has increased by 0.5% or more, there has been a recession. Every time there has been a recession, the stock market has fallen to new lows.
Will It Be Different This Time?
This chart from Bank of America shows the average S&P 500 returns around recessions over the past 150+ years. With the inverted yield curve beginning to steepen now, we are likely at the point on the left of the chart. Typically, credit conditions start to tighten next. Then the Fed sees that a recession is coming, so they start cutting the Federal Funds rate. I think that’s why they have already indicated to the market that they plan to cut rates in 2024. Then stocks fall significantly over the next 12 months or so.
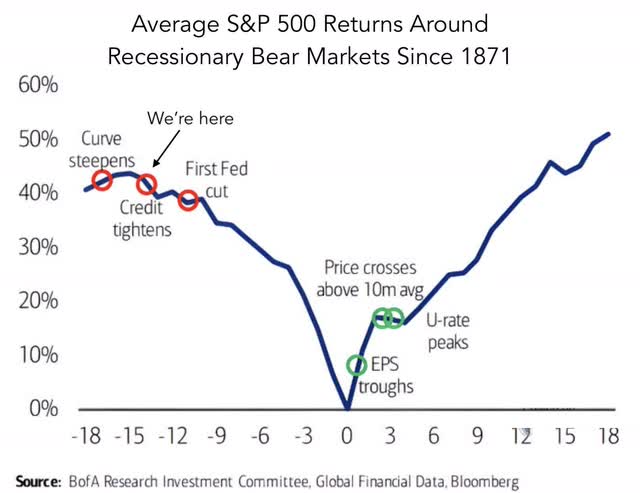
Bank of America
Unless it is somehow “different this time”, I believe investors should prepare for a much more challenging year in 2024.
Credit: Source link