

courtneyk
“Quality” Closed-End Fund Report
Quantitative screens help to rapidly narrow down attractive candidates from the database of 500-plus closed-end funds (“CEFs”) for further due diligence and investigation.
Author
Based on feedback from members, it seems that a very many number of investors, understandably, place a great emphasis on distribution coverage and return of capital. While I’m not going to rehash the entire ROC argument here (it is suffice to say that the issue is much more complicated than “ROC = bad”), some investors may consider a fund with over 100% coverage to be attractive simply because they know that the distributions are being covered by earnings. Such a fund may be at lower risk of a distribution cut, which can cause devastating impacts to a fund’s market price. Hence, the “Quality” report focuses only on funds with >100% coverage.
How is coverage calculated?
For some of the major fund houses (PIMCO, BlackRock, etc.), the latest trailing coverage numbers from the fund’s latest unaudited monthly estimates are used. For the remaining funds, the coverage ratios are calculated using earnings data from their most recent annual/semi-annual reports. As these reports are released only twice a year, the coverage ratios will show more of a lag (of up to 6 months) compared to those fund families that release monthly earnings estimates.
I hope that these rankings of “Quality” CEFs will provide fertile grounds for further exploration and due diligence. As a reminder, these top lists are meant to be preliminary shortlists for further research, not meant to be the final analysis for a buy or sell decision.
Key to table headings:
P/D = premium/discount
Z = 1-year z-score
Lev = leverage
BE = baseline expense
Cov = coverage
Data were taken from the close of August 18th, 2023.
1. Top 10 widest quality discounts
The following data show the 10 CEFs with the highest discounts and coverage >100%. Yields, z-scores and leverage are shown for comparison.
| CEF | Category | P/D | Yield | Z | Lev | BE | Cov |
| (HFRO) | Senior Loans | -37.43% | 10.89% | -1.5 | 13% | 1.28% | 102% |
| (BANX) | Sector Equity | -21.98% | 9.40% | -1.1 | 27% | 3.92% | 127% |
| (NXJ) | Single-state Munis | -15.14% | 3.20% | -0.5 | 40% | 1.03% | 103% |
| (VPV) | Single-state Munis | -14.64% | 3.73% | -0.4 | 39% | 1.51% | 111% |
| (HYB) | High Yield | -14.47% | 7.08% | -0.6 | 31% | 1.34% | 109% |
| (DMF) | National Munis | -14.46% | 2.85% | -0.5 | 33% | 0.83% | 129% |
| (MUC) | California Munis | -14.43% | 3.75% | -0.7 | 38% | 0.98% | 103% |
| (MAV) | National Munis | -14.10% | 4.52% | -0.8 | 38% | 1.32% | 108% |
| (FMN) | National Munis | -13.89% | 3.97% | -0.3 | 38% | 0.99% | 112% |
| (HNW) | High Yield | -13.81% | 10.51% | -0.8 | 30% | 1.59% | 101% |
Income Lab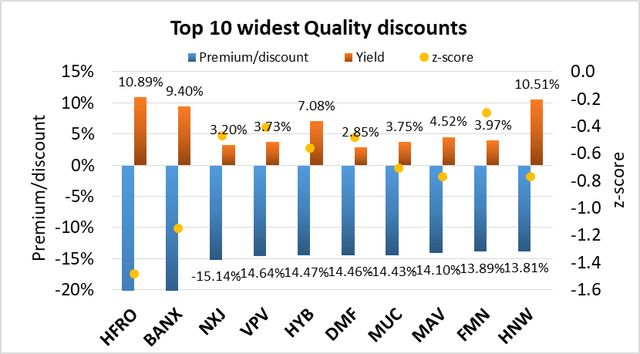
2. Top 10 best quality z-scores
CEFs with the best (most negative) z-scores are potential buy candidates. The following data show the 10 CEFs with the lowest z-scores. Premium/discount, yields and leverage are shown for comparison. Only funds with coverage >100% are considered.
| CEF | Category | Z | P/D | Yield | Lev | BE | Cov |
| (FFC) | Preferreds | -1.7 | -10.29% | 7.60% | 40% | 0.90% | 128% |
| (FLC) | Preferreds | -1.6 | -12.06% | 7.38% | 41% | 1.31% | 128% |
| (PFO) | Preferreds | -1.6 | -11.41% | 7.08% | 41% | 1.37% | 128% |
| (PFD) | Preferreds | -1.5 | -8.67% | 6.85% | 39% | 1.28% | 124% |
| (HFRO) | Senior Loans | -1.5 | -37.43% | 10.89% | 13% | 1.28% | 102% |
| (IHTA) | High Yield | -1.3 | -9.94% | 5.62% | 28% | 1.28% | 116% |
| (JPT) | Preferreds | -1.3 | -12.79% | 6.84% | 34% | 1.31% | 107% |
| (BANX) | Sector Equity | -1.1 | -21.98% | 9.40% | 27% | 3.92% | 127% |
| (IHIT) | High Yield | -1.0 | -5.82% | 5.67% | 30% | 1.11% | 120% |
| (JPC) | Preferreds | -1.0 | -11.41% | 8.03% | 37% | 1.34% | 105% |
Income Lab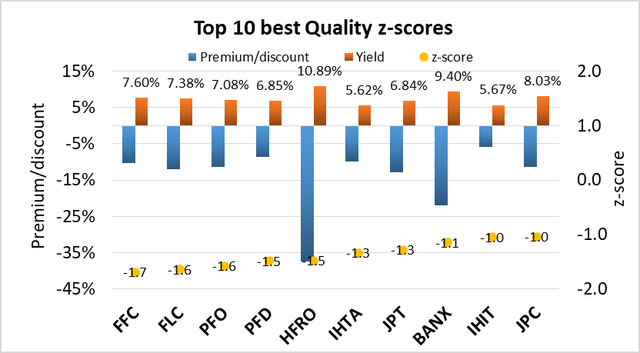
3. Top 20 highest quality yields
Some readers are mostly interested in obtaining income from their CEFs, so the following data presents the top 20 highest yielding CEFs. I’ve also included the premium/discount and z-score data for reference. Before going out and buying all 10 funds from the list, some words of caution: [i] higher yields generally indicate higher risk, and [ii] some of these funds trade at a premium, meaning you will be buying them at a price higher than the intrinsic value of the assets (which is why I’ve included the premium/discount and z-score data for consideration). Only funds with coverage >100% are considered. To make the charts more manageable, I’ve split the funds into two groups of 10.
| CEF | Category | Yield | P/D | Z | Lev | BE | Cov |
| (WDI) | Multisector Income | 11.76% | -9.92% | 0.8 | 32% | 1.75% | 101% |
| (HFRO) | Senior Loans | 10.89% | -37.43% | -1.5 | 13% | 1.28% | 102% |
| (HNW) | High Yield | 10.51% | -13.81% | -0.8 | 30% | 1.59% | 101% |
| (PHT) | High Yield | 9.68% | -12.10% | -0.5 | 32% | 1.13% | 101% |
| (BGH) | High Yield | 9.49% | -10.38% | 0.1 | 27% | 1.79% | 111% |
| (BANX) | Sector Equity | 9.40% | -21.98% | -1.1 | 27% | 3.92% | 127% |
| (MPV) | High Yield | 8.43% | -12.20% | 0.9 | 13% | 0.95% | 104% |
| (JPC) | Preferreds | 8.03% | -11.41% | -1.0 | 37% | 1.34% | 105% |
| (DHF) | High Yield | 7.91% | -11.28% | 0.5 | 30% | 1.28% | 110% |
| (FFC) | Preferreds | 7.60% | -10.29% | -1.7 | 40% | 0.90% | 128% |
| (FLC) | Preferreds | 7.38% | -12.06% | -1.6 | 41% | 1.31% | 128% |
| (DFP) | Preferreds | 7.26% | -8.29% | -0.7 | 40% | 1.10% | 125% |
| (WEA) | Investment Grade | 7.14% | -1.59% | 2.4 | 34% | 1.07% | 101% |
| (HYB) | High Yield | 7.08% | -14.47% | -0.6 | 31% | 1.34% | 109% |
| (PFO) | Preferreds | 7.08% | -11.41% | -1.6 | 41% | 1.37% | 128% |
| (JPS) | Preferreds | 6.98% | -12.30% | -0.8 | 35% | 1.33% | 106% |
| (PFD) | Preferreds | 6.85% | -8.67% | -1.5 | 39% | 1.28% | 124% |
| (JPT) | Preferreds | 6.84% | -12.79% | -1.3 | 34% | 1.31% | 107% |
| (JPI) | Preferreds | 6.70% | -4.39% | -0.1 | 37% | 1.37% | 107% |
| (NPFD) | Preferreds | 6.35% | -12.68% | -0.5 | 36% | 0.00% | 107% |
Income Lab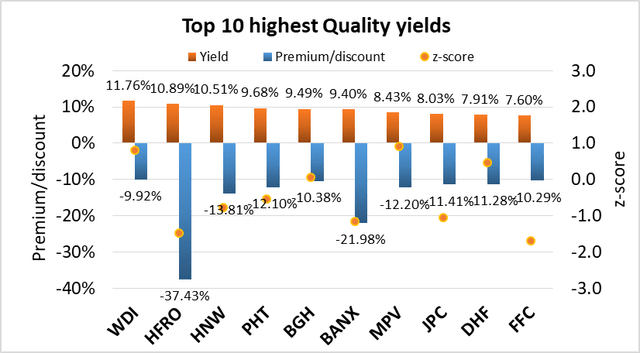
4. Top 10 best combination of quality yield and discount
Buying a CEF with both a high yield and discount not only gives you the opportunity to capitalize from discount contraction, but you also get “free” alpha every time the distribution is paid out. This is because paying out a distribution is effectively the same as liquidating the fund at NAV and returning the capital to the unitholders. The “DxY” metric multiples yield and discount together; the more negative the “DxY” metric, the better. Only funds with >100% coverage are considered. The DxY score is scaled by 100.
| CEF | Category | P/D | Yield | Z | DxY | Lev | BE | Cov |
| (HFRO) | Senior Loans | -37.43% | 10.89% | -1.5 | -4.1 | 13% | 1.28% | 102% |
| (BANX) | Sector Equity | -21.98% | 9.40% | -1.1 | -2.1 | 27% | 3.92% | 127% |
| (HNW) | High Yield | -13.81% | 10.51% | -0.8 | -1.5 | 30% | 1.59% | 101% |
| (PHT) | High Yield | -12.10% | 9.68% | -0.5 | -1.2 | 32% | 1.13% | 101% |
| (WDI) | Multisector Income | -9.92% | 11.76% | 0.8 | -1.2 | 32% | 1.75% | 101% |
| (MPV) | High Yield | -12.20% | 8.43% | 0.9 | -1.0 | 13% | 0.95% | 104% |
| (HYB) | High Yield | -14.47% | 7.08% | -0.6 | -1.0 | 31% | 1.34% | 109% |
| (BGH) | High Yield | -10.38% | 9.49% | 0.1 | -1.0 | 27% | 1.79% | 111% |
| (JPC) | Preferreds | -11.41% | 8.03% | -1.0 | -0.9 | 37% | 1.34% | 105% |
| (DHF) | High Yield | -11.28% | 7.91% | 0.5 | -0.9 | 30% | 1.28% | 110% |
Income Lab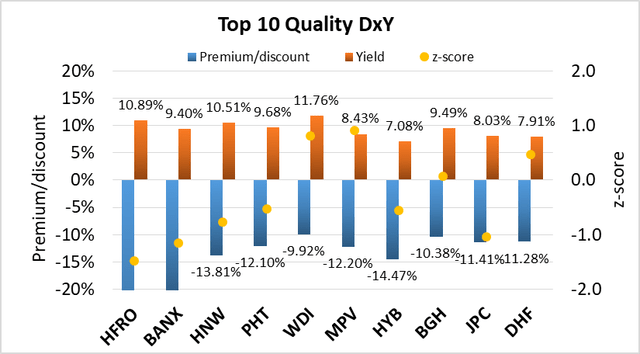
5. Top 10 best combination of quality yield, discount and z-score
This metric because it takes into account all three factors of yield, discount and z-score. The composite metric simply multiplies the three quantities together. A screen is applied to only include CEFs with a negative one-year z-score. As both discount and z-score are negative while yield is positive, the more positive the “DxYxZ” metric, the better. Only funds with >100% coverage are considered. The DxYxZ score is scaled by 100.
| CEF | Category | P/D | Yield | Z | DxYxZ | Lev | BE | Cov |
| (HFRO) | Senior Loans | -37.43% | 10.89% | -1.5 | 6.0 | 13% | 1.28% | 102% |
| (BANX) | Sector Equity | -21.98% | 9.40% | -1.1 | 2.4 | 27% | 3.92% | 127% |
| (FLC) | Preferreds | -12.06% | 7.38% | -1.6 | 1.5 | 41% | 1.31% | 128% |
| (FFC) | Preferreds | -10.29% | 7.60% | -1.7 | 1.3 | 40% | 0.90% | 128% |
| (PFO) | Preferreds | -11.41% | 7.08% | -1.6 | 1.3 | 41% | 1.37% | 128% |
| (JPT) | Preferreds | -12.79% | 6.84% | -1.3 | 1.1 | 34% | 1.31% | 107% |
| (HNW) | High Yield | -13.81% | 10.51% | -0.8 | 1.1 | 30% | 1.59% | 101% |
| (JPC) | Preferreds | -11.41% | 8.03% | -1.0 | 1.0 | 37% | 1.34% | 105% |
| (PFD) | Preferreds | -8.67% | 6.85% | -1.5 | 0.9 | 39% | 1.28% | 124% |
| (IHTA) | High Yield | -9.94% | 5.62% | -1.3 | 0.7 | 28% | 1.28% | 116% |
Income Lab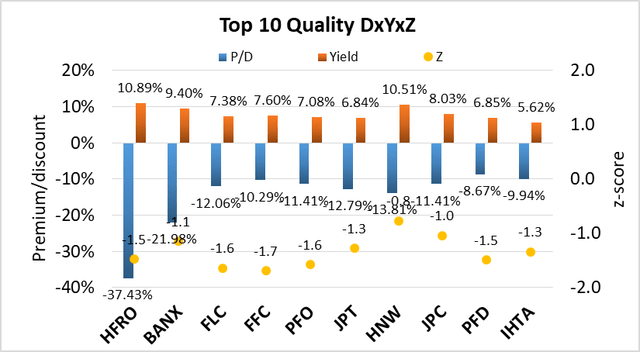
Top DxYxZ funds
The top DxYxZ funds from this month’s Quality report are HFRO, BANX and FLC.
Highland Opportunities and Income Fund (HFRO) is a relatively complex, hedge fund-like CEF that invests in a few, highly-concentrated positions. It has an attractive set of valuation metrics, including a discount of -37.43%, yield of 10.89% and z-score of -1.5, however investors should consider HFRO’s history and management before investing (see HFRO: Thoughts On The Conversion Proposal).
ArrowMark Financial Corp (BANX) is a unique CEF focusing on regulatory capital relief securities and other banking debt securities (see Nick’s latest article on BANX here). It yields 9.40% with a -21.98% discount and -1.1 z-score, however, note that the current discount is based on the 7/31 NAV.
Flaherty & Crumrine Total Return Fund (FLC) is a preferred fund from one of the top managers. It trades at a discount of -12.06% with a 1-year z-score of -1.6, and yields 7.38% with nominal 128% coverage. (It should be noted that the coverage is likely overstated as rising leverage expenses has likely crimped FLC’s income, causing it to adjust its distribution downwards several times over the last year).
Credit: Source link