
ElsvanderGun
Investment Thesis
One of the goals of active investing for any value investor is to find great companies that will outperform the market over time. Taking a note out of Peter Lynch’s approach: to pay attention to popular trends in your everyday life, The Cheesecake Factory (NASDAQ:CAKE) is a popular restaurant chain that is always crowded in my area with long wait times for both in-house dining and online pickup orders. With the company growth outlined for 2024, revenue growth over the last 10 years, and current sector trends, I believe CAKE has potential as a value play. CAKE is a growing fast-casual restaurant chain that recently opened their first location in Thailand, plans to open 22 new restaurants within the next year, and operates other restaurant chains including Flower Child, North Italia, and Fox Restaurant Concepts. However, over the last decade, CAKE has significantly underperformed the market and has some declining fundamentals that may pose a risk to investors if they continue on this trend. Based on my fundamental valuation analysis and comparisons to industry peers, along with their estimated future earnings and revenue growth, I believe CAKE should be considered as a long-term investment at this price.
Company Outline
The Cheesecake Factory is a growing restaurant chain that is in a unique position to outperform in their sector due to projected 2024 store growth and effective business operations that help manage the changing costs in a high inflation environment and highly competitive sector. Over the last few years, companies in the restaurant sector have struggled with increases in food and labor costs due to the rising inflation and this has had an effect on margins which in turn has affected business operations. However, CAKE has done well navigating this environment thus far and is looking to continue their growth.
Over the next year, they plan to open 22 new restaurants, including “3 to 4” Cheesecake Factory restaurants. This number is expanding on growth, in 2023, of 16 new restaurants, of which 5 were Cheesecake Factory restaurants. This brings the total restaurant count domestically up to 213 companies owned locations and 31 international locations, with plans to expand up to 300 restaurants in the domestic market. The fast casual restaurant sector is a highly competitive sector, and The Cheesecake Factory Incorporated faces competition from other national and regional chains as well as independently owned restaurants. However, with their competitive locally tailored menu that is “built around customer preferences and trends,” they have been able to remain competitive during peak lunch and dinner times in local markets.
CAKE is consistently ranked as one of Fortune’s top 100 companies to work for and provides an innovative menu of 235 items. This menu innovation has helped CAKE sell more items per square foot than their competitors in the industry, which in turn has helped with lease negations. As described in their 10-K filing, by offering “freshly made items on the menu,” the company positions themselves at a competitive advantage to other restaurant chains. Additionally, CAKE has the largest unit volumes compared to their peers in the industry, with an average-sized overall check from consumers. With their diverse selection of 45 proprietary desserts such as cheesecakes, 17% of The Cheesecake Factory sales came from dessert in 2023.
Economic Agility
CAKE has had mixed earnings and has struggled to provide capital appreciation to shareholders; however, CAKE has navigated the current economic environment well. In the most recent quarter, cost of sales decreased 170 basis points due to competitive increases in menu pricing. This demonstrates that the company may have some pricing power, given that their store traffic had improved about 1% from Q3. Over the last two quarters, the company has also seen a decline in labor costs as they have focused on retention and optimizing the medical coverage plan. The focus on keeping costs low will help with any delays experienced in new store openings that have caused short-term increases in pre-opening costs as the company continues growing their new restaurants over the next year and the foreseeable future. With a large menu selection, continuous innovation in trends and customer preferences, and pricing power to offset increases in cost of goods, this company is uniquely positioned to outperform in the sector. Now, let’s evaluate the previous 10-year fundamentals of the company to see why I believe CAKE should be considered a long-term investment today.
Fundamentals
CAKE is currently trading at a forward price to earnings (P/E) ratio of 11.18 and a trailing twelve-month P/E ratio of 12.79. They are trading at about a 37% higher EV/EBITDA ratio compared to the sector median at 13.06. Both the forward and trailing price to sales ratio is 0.48, and the stock provides investors with a forward dividend yield of over 3% with a payout ratio of 40%. Looking over the last ten years of data, CAKE has shown a mostly positive free cash flow rate, positive returns on invested capital (ROIC), while keeping weighted costs of capital (WACC) down. Currently, CAKE has a higher return on invested capital than weighted cost of capital (ROIC-WACC) indicating that the company is making smart investments to provide returns for their shareholders and is not expanding past company margins.
CAKE: return on invested capital, weighted cost of capital, and free cash flow over the last 10 years. (GuruFocus)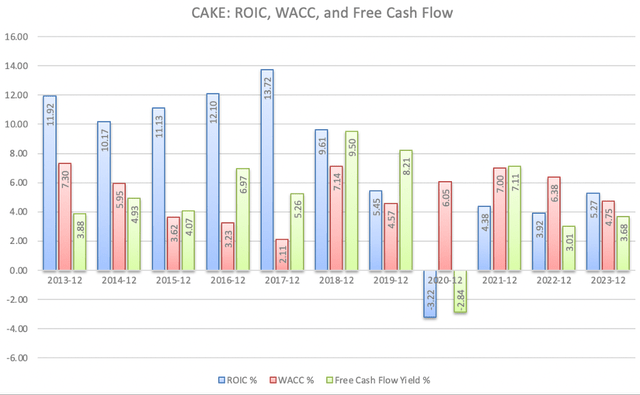
Over the last ten years, the company has continued to grow their revenue consistently, with 83% growth since 2013 while keeping gross margins higher compared to peers in the sector and in an environment where inflation has affected labor costs, costs of food, and logistics in this industry. Examples of peers in the sector that have been affected by the increased costs are other growing companies like CAVA Group (CAVA) and Dutch Bros Inc. (BROS) and a more stagnant company like Brinker International, Inc. (EAT). Declining gross margins will have an impact on long-term fundamentals like ROIC and WACC, which may lead to investment capital risk. In a tough environment and sector, CAKE has done a good job of navigating the developing costs over the last few years, while continuing to grow their business, buy back stock, and pay out a dividend to investors. As you can see in the chart below, margins are normalizing around 40% which is a slight decline from 2015/2016, but still higher than peers in the sector.
Revenue, costs of goods, and gross margins of CAKE over the last ten years. Revenue and costs numbers are displayed on the left vertical axis and gross margin is displayed on the right vertical axis. (GuruFocus)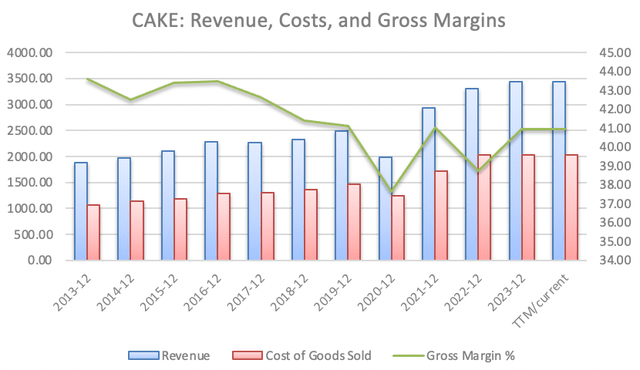
Looking Forward
The fundamentals demonstrate that CAKE should make a good investment over the next ten years given their current valuation in the stock market, positive free cash flow yield, dividend yield, and positive ROIC to WACC ratio (ROIC-WACC). Additionally, with growth margins around 40%, and their plan to grow by 22 additional locations over the next year, I believe this company will begin to outperform sector peers over the next decade as their revenue also continues to grow.
Dividend
CAKE has a current payout ratio of just over 40%, and a forward dividend yield of 3.21%. The company cut the dividend due to the effects of the pandemic at the end of 2020, and resumed 2 years later once business operations normalized. As the company continues to maintain high 40% margins compared to industry peers, and return on investment normalizes back to pre-pandemic levels, I expect the dividend to also return to pre-pandemic levels, which would be around a 4.28% yield at the price (estimated $1.44 dividend per share). This provides a small margin of safety for investors, as the forward-looking estimated yield at this price is close to the 5% risk-free rate in money market or long-term bonds.
Industry Peers
CAVA Group Inc.
Other companies also operating in the consumer discretionary restaurant sector, like CAVA Group Inc., have seen monstrous price returns for investors over the last 12 months, but the stock price appreciation has not been fully supported by the fundamentals but rather by the projection of rapid growth. I previously highlighted this overvaluation in an article on CAVA. CAVA is currently trading at a forward EV/EBITDA ratio of about 81.3 times, at the time of this writing, while CAKE is trading at about 16% of this EV/EBITDA value even though CAKE is projecting to grow their operating restaurants by 45% of CAVA’s projection for 2024 (22 new locations/48 new locations for CAVA).
CAVA and Cake past few years of fundamentals. (GuruFocus)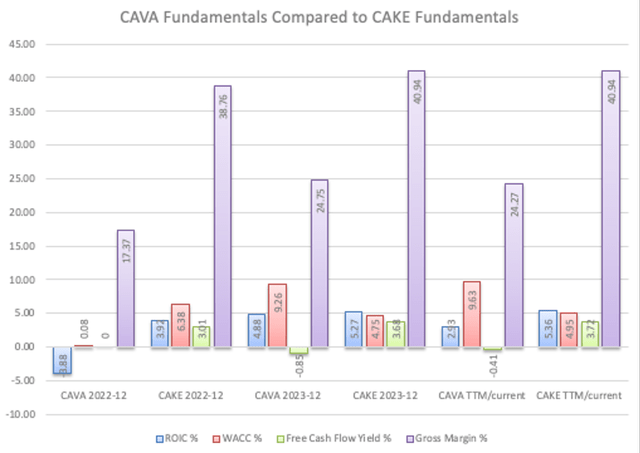
Brinker International, Inc.
At the time of this writing, Brinker International, Inc. has performed relatively okay compared to the market year to date, returning about 8% to investors, and has also returned almost 23% over the last 12 months. Given that they are a direct competitor in fast-casual dining, I wanted to see how they compared to CAKE given that CAKE has only returned 3% to investors in stock appreciation over the last 12 months. Using a multiples analysis approach, we can see that CAKE presents higher gross margins than EAT, at ~40% compared to ~13.5% for EAT over the trailing twelve months. EAT has also struggled to see their ROIC and WACC return to normal after 2020 when the pandemic caused ripples in the food industry; however, the stock has continued to appreciate over the last 12 months as compared to CAKE. Additionally, the Quant rating on Seeking Alpha indicates a strong buy for EAT at this valuation and the fundamental characteristics between these companies are similar. This comparison continues to strengthen the argument for CAKE as a long-term investment.
EAT fundamentals over the last decade, with gross margin and free cashflow yield on the right vertical axis and ROIC and WACC percent on the left vertical axis. (GuruFocus)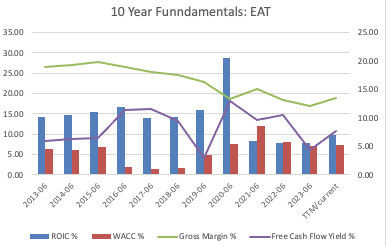
CAKE fundamentals over the last decade, with gross margin and free cashflow yield on the right vertical axis and ROIC and WACC percent on the left vertical axis. (GuruFocus)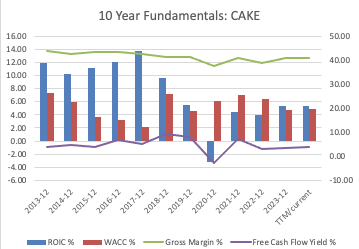
Concerns about CAKE
You can make the argument that CAKE may be a value play in the consumer discretionary restaurant sector; however, there are some concerns given the previous performance of the stock over the last decade, as well as an overall trend of some declining fundamentals. Over the last ten years, while an ETF like the SPDR S&P 500 ETF Trust (SPY) has returned about 185%, CAKE has returned -25%. This may be due to the inconsistent quarter to quarter earnings per share, inconsistent free cash flow, or overall single digit estimated revenue growth.
Additionally, although CAKE has been able to consistently increase their revenue year over year, the company fundamentals were significantly impacted during the COVID-19 lockdowns in 2020. As you can see in the first graph above, ROIC and free cash flow yield were both negative in that year. During this time, the company also had a negative share buyback ratio of -1.9% and -14.5% in 2020 and 2021 respectively. These points highlight some short-term concern where the company needed additional cash for operations, and the ROIC has still not fully returned to pre-pandemic levels (5.45 in 2019 and 5.27 in 2023).
With gross margins remaining around 41%, I would focus on revenue, ROIC, WACC, and free cash flow in the coming quarters to anticipate the future trajectory of the company given that margins are not a concern for CAKE. If they continue to improve these fundamentals from the pandemic lows, and trend higher than in 2019, this company should be a long-term winner.
Fair Value
Given the current fundamentals of CAKE highlighted above, and the multiples analysis compared to peers, I believe CAKE is undervalued based on the currently compressed multiples of the consumer discretionary sector that is still recovering from the pandemic and compared to sector peers that are growing at only slightly higher rates. This, along with the positive free cash flow, positive ROIC-WACC ratio, and dividend yield with a low payout ratio provide some current margin of safety for investors who are considering CAKE as an investment. Additionally, CAKE is trading at about a 35% discount to their 5-year average P/E ratio, and has estimated EPS growth of 28% by the end of 2025. Following Peter Lynch’s guide for earnings growth and valuation, CAKE currently has a PEG GAAP ratio of 0.12 (A- on seeking alpha and 78% lower than the sector) over the last 12 months, and a forward PEG Non-GAAP ratio of 1.03, which is 29% lower than the sector. These factors in aggregate point to an undervaluation of CAKE in consumer discretionary, and if the fundamentals continue to improve, I expect stock price appreciation to follow.
Price Target
Accounting for the 28% EPS growth over the next 2 years, and taking into account that CAKE is trading historically lower than they have, I’m going to follow the conservative formula looking for Graham number to come up with a fair value price for the stock. Using the Graham formula with 3.07 EPS (projected 2024 EPS) and a book value of 6.28 in the following formula; (22.5*3.06*6.28)^.5, the conservative end fair value would be 20.79. However, using a discounted cash flow model with 3.07 EPS, assuming 7% growth over the next ten years (rate of revenue growth over the last 5 years), applying a 10% discount, and projecting terminal growth of 2% (normalized estimated inflation rate), fair value is 42.18 per share. Based on my calculations, CAKE is trading at about a 20% discount to fair value.
DCF based on 2024 estimated EPS (Author’s Calculations)
Conclusion
The Cheesecake Factory is a growing restaurant chain that displays promise as a long-term investment over the next ten years. As they have been able to effectively manage increasing costs due to the changes in the current economic conditions, this current stagnant stock appreciation over the last 12 months presents a unique opportunity for a long-term investment. I anticipate that the fundamentals of the company over the next 5 to 10 years will continue to improve, and we will see a larger positive discrepancy on ROIC compared to WACC, where ROIC will significantly outpace WACC again as it did in 2017. Additionally, with this company trading at a 35% discount to their 5-year P/E ratio, other investors may be over pessimistic of the company, opening up an opportunity for a nice margin of safety for long-term investors. Based on the fundamentals of the company and comparison to peers using the multiples approach of valuation, I am considering this company for a long-term investment in my personal portfolio at this discounted price.
However, I am concerned about the overall trend of the fundamentals over the last decade, with declining ROIC starting before the pandemic back in 2018 and their price performance that significantly underperformed the market returns over this time. I caution other investors to pay attention to the trend of retained earnings, return on invested capital, share buy-back ratio, and free cash flow. If any of these factors continue a downward trend as seen before the pandemic, this company will likely not perform well compared to the market. Additionally, if the economic environment worsens, with less foot traffic and decreasing revenues, this would pose a risk to this investment.
ElsvanderGun
Credit: Source link