
• bitcoinBitcoin(BTC)$77,266.000.33%
  • ethereumEthereum(ETH)$2,383.76-0.63%
  • tetherTether(USDT)$1.000.01%
  • binancecoinBNB(BNB)$689.751.12%
  • rippleXRP(XRP)$1.351.43%
  • usd-coinUSDC(USDC)$1.000.00%
  • solanaSolana(SOL)$100.010.98%
  • tronTRON(TRX)$0.3247961.02%
  • Figure HelocFigure Heloc(FIGR_HELOC)$1.01-3.13%
  • HyperliquidHyperliquid(HYPE)$81.58-0.33%
  • zcashZcash(ZEC)$814.60-0.69%
  • dogecoinDogecoin(DOGE)$0.0821131.67%
  • RainRain(RAIN)$0.016700-3.20%
  • USDSUSDS(USDS)$1.00-0.01%
  • moneroMonero(XMR)$514.471.92%
  • leo-tokenLEO Token(LEO)$9.32-0.16%
  • whitebitWhiteBIT Coin(WBT)$70.68-0.29%
  • chainlinkChainlink(LINK)$11.09-0.31%
  • cardanoCardano(ADA)$0.2041304.74%
  • stellarStellar(XLM)$0.1771121.77%
  • bitcoin-cashBitcoin Cash(BCH)$244.600.26%
  • daiDai(DAI)$1.000.00%
  • CantonCanton(CC)$0.109321-3.78%
  • Ethena USDeEthena USDe(USDE)$1.00-0.01%
  • USD1USD1(USD1)$1.000.00%
  • litecoinLitecoin(LTC)$49.761.45%
  • the-open-networkGram (prev. Toncoin)(GRAM)$1.342.97%
  • uniswapUniswap(UNI)$5.70-2.19%
  • hedera-hashgraphHedera(HBAR)$0.0750642.54%
  • Global DollarGlobal Dollar(USDG)$1.000.04%
  • avalanche-2Avalanche(AVAX)$7.190.67%
  • suiSui(SUI)$0.755.86%
  • shiba-inuShiba Inu(SHIB)$0.0000052.40%
  • paypal-usdPayPal USD(PYUSD)$1.000.03%
  • BlackRock USD Institutional Digital Liquidity FundBlackRock USD Institutional Digital Liquidity Fund(BUIDL)$1.000.00%
  • Circle USYCCircle USYC(USYC)$1.140.01%
  • tether-goldTether Gold(XAUT)$4,406.932.48%
  • crypto-com-chainCronos(CRO)$0.054147-0.72%
  • MemeCoreMemeCore(M)$1.072.13%
  • nearNEAR Protocol(NEAR)$1.861.43%
  • Ripple USDRipple USD(RLUSD)$1.00-0.01%
  • okbOKB(OKB)$104.59-4.07%
  • Ondo US Dollar YieldOndo US Dollar Yield(USDY)$1.140.05%
  • BittensorBittensor(TAO)$216.22-0.45%
  • AsterAster(ASTER)$0.724.64%
  • aaveAave(AAVE)$126.14-0.03%
  • pax-goldPAX Gold(PAXG)$4,417.972.59%
  • mantleMantle(MNT)$0.564.31%
  • World Liberty FinancialWorld Liberty Financial(WLFI)$0.055920-1.56%
  • MorphoMorpho(MORPHO)$2.50-4.41%
TradePoint.io
  • Main
  • AI & Technology
  • Stock Charts
  • Market & News
  • Business
  • Finance Tips
  • Trade Tube
  • Blog
  • Shop
No Result
View All Result
TradePoint.io
No Result
View All Result

The AI Arms Race | Seeking Alpha

September 3, 2026
in Market & News
Reading Time: 8 mins read
A A
The AI Arms Race | Seeking Alpha
ShareShareShareShareShare

Devrimb/iStock via Getty Images

What investors sometimes overlook is that the eye-wateringly large capital investment plans being rolled out to support AI require not just hundreds of billions of dollars, but also molecules in the form of materials such as copper, water, gallium, lithium and concrete. – Gillian Tett, Financial Times


Excessive capex spending

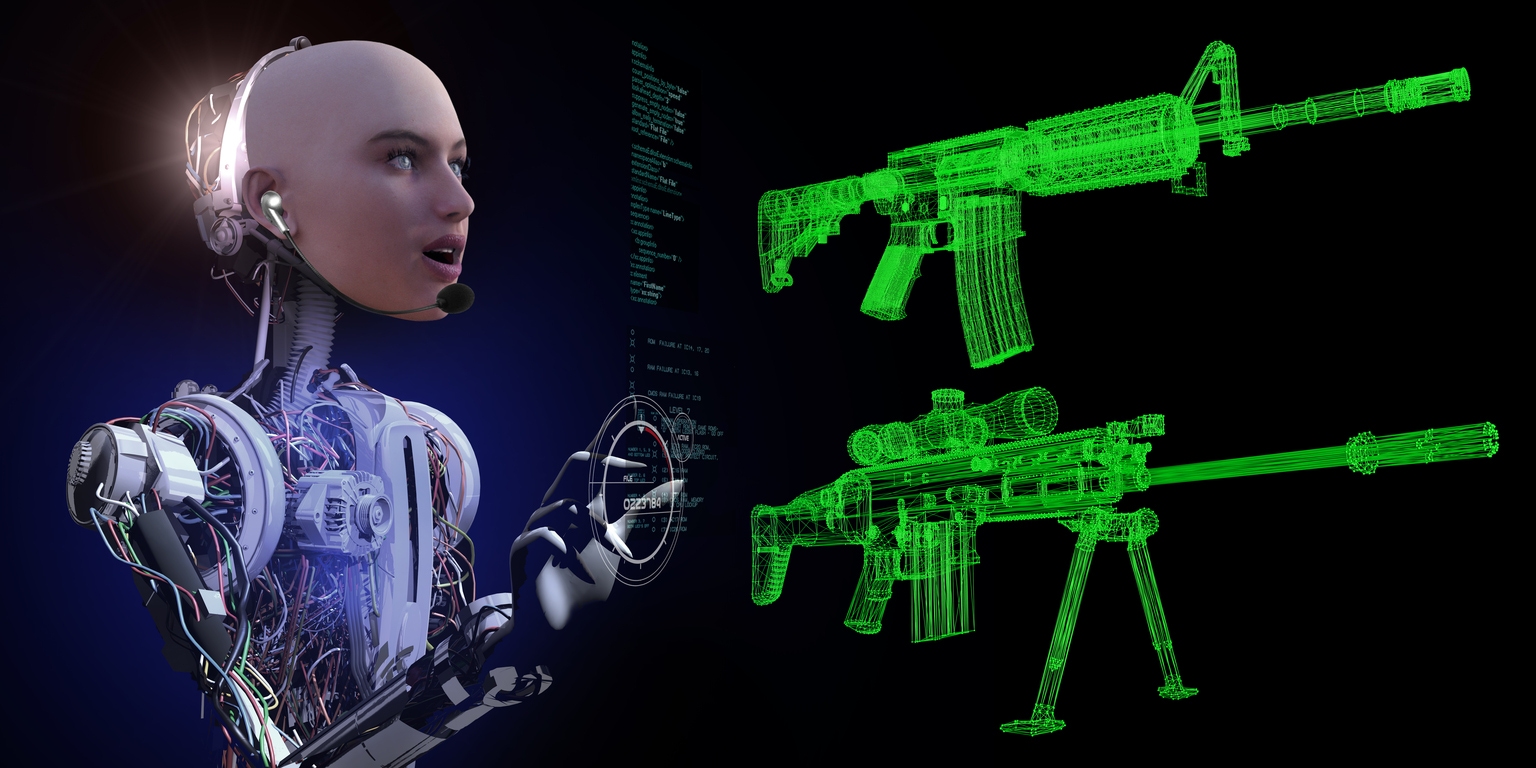
You have proper arms races, and you have the lookalikes. In this case, I am referring to the latter. U.S. hyperscalers have entered into what can best be described as an arms race, even if it is not about outnumbering the enemy in terms of the number of missiles but about gaining superiority in the battlefield of AI.

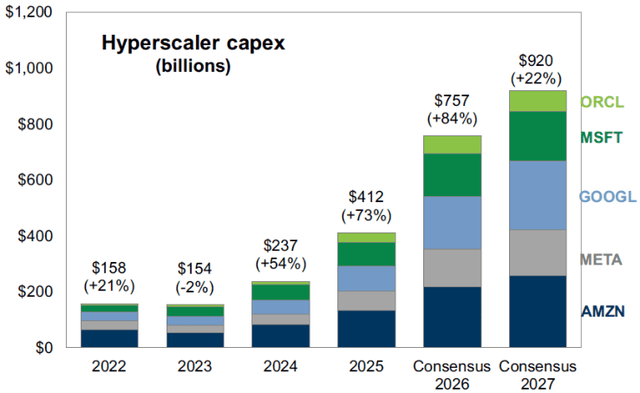
If you take a look at Exhibit 1 below, I am sure you’ll get my point. The chart has been produced by Goldman Sachs Global Investment Research (GS). It is updated regularly and, every time, expectations for 2026 and 2027 go up another notch. The chart was produced in late June. When the previous one was published in late May, the numbers for this year and next were lower.

Exhibit 1: Capex spending by U.S. hyperscalers ($Bn)
Capex spending by U.S. hyperscalers ($Bn)

Source: Goldman Sachs Global Investment Research

As if that isn’t bad enough, only 15 months earlier, GS posted $365Bn of expected capex for 2026, and that number included all seven companies in the Magnificent 7, not just the five listed in Exhibit 1. As you can see, inflation bites in more than one sense!

Here is the problem: the hyperscalers haven’t got that much cash left. As you can see in Exhibit 2, the blue line, a measure of capex spending-to-GDP, continues to accelerate whereas the red line, which measures cash-to-capex spending, has started to decline. This leaves only two options. Either the hyperscalers take on more debt, or they slow down their spending (or pull out altogether).

Exhibit 2: New era capex spending as a % of GDP (blue/LH) vs. ratio of U.S. corporate cash-to-new era capex spending (red/RH)
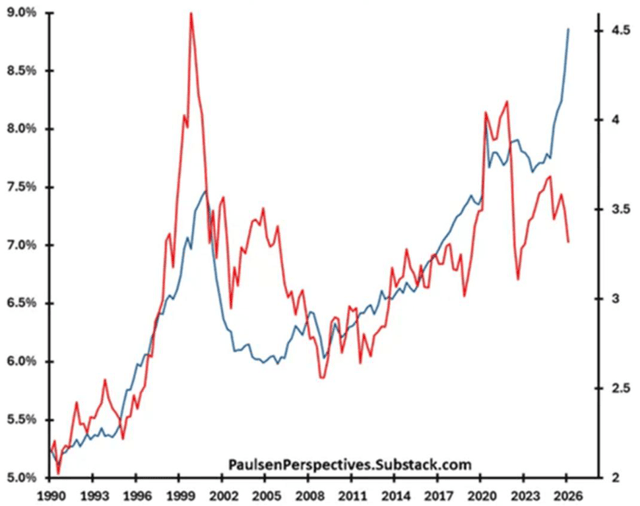
Exhibit 2: New era capex spending as a % of GDP (blue/LH) vs. ratio of U.S. corporate cash-to-new era capex spending (red/RH)

Source: The Felder Report

At least so far, the hyperscalers have opted for the former. As you can see in Exhibit 3 below, all the way up to 2024, megacap tech companies borrowed little; however, in 2025, it changed. With U.S. interest rates no longer close to zero, this cannot continue forever. If managements don’t reach that conclusion themselves, I am pretty sure shareholders will do it for them.

Let’s take another look at Exhibit 2. As you can see, a similar situation unfolded in the late 1990s. Back then, cash also ran out before the tech industry began to reduce capex and what happened? In early 2000, the dotcom boom turned into a bust with all sorts of implications. Do I need to remind you that the Nasdaq 100 index fell 83% from peak to trough in that selloff?

Finally, I should also point out that, from around 2008 to the early 2020s, as you can see, the growth in capex spending broadly matched the growth in cash. It is only in the last few years that a significant gap has opened up. In other words, the desire to outmanoeuvre the competition has taken precedence over some sound governance principles, and that cannot continue.
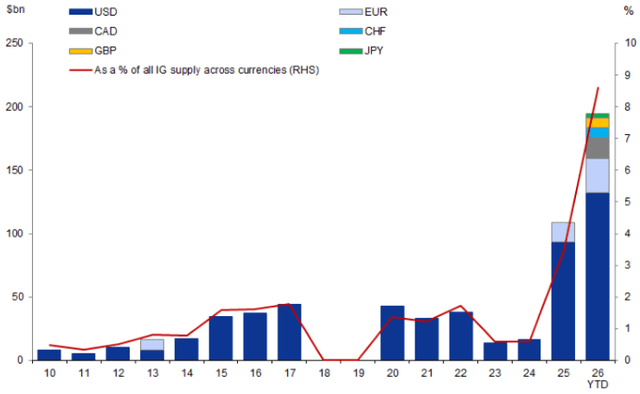
Exhibit 3: IG debt issuance by hyperscalers ($Bn)

Source: Goldman Sachs Global Investment Research

Are we coming to the end of the party?

For a while, I have argued that this will end in tears. Bubbles always do, and this is certainly one. That said, I have also argued, and continue to argue, that to time the peak of a bubble is next to impossible. I vividly remember the two prior 3-sigma bubbles in my career – Japan in the late 1980s and the dotcom bubble in the late 1990s – and there was absolutely no way one could tell when time was up.

This bubble is no different. It could be over tomorrow morning, or AI stocks could keep running for another few years. I wish I could give you a better indication, but I can’t. The only thing I can say with a great deal of conviction is that the 10-year outlook for equity returns is not good.

I have, in my research library, some pretty convincing research which shows that (A) when P/E multiples are as high as they are, and (B) when the stock market is as concentrated (market cap-wise) as it is, annualised 10-year equity returns will be low single digits at best.

Exhibit 4: Stock market concentration at the peak of past bubbles
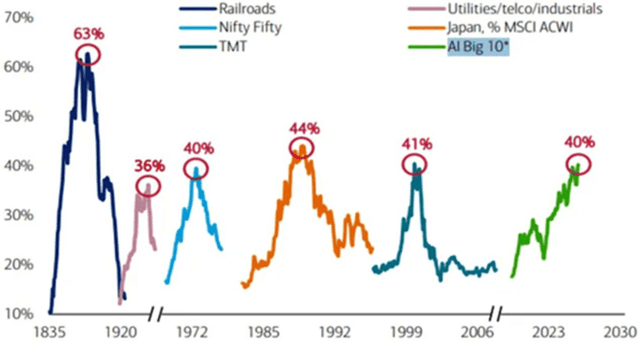
Exhibit 4: Stock market concentration at the peak of past bubbles

Source: The Felder Report

Re the latter point, take a look at Exhibit 4 above. As you can see, the U.S. stock market is now as concentrated as it was when prior bubbles burst. Also, Exhibit 4 does not include SpaceX (SPCX), which has increased market cap concentration levels in the U.S. significantly.

Final few words

Over the summer, Exhibit 5 below caught my attention. The blue bars represent net profit margins (LH box) and operating margins (middle box) in S&P 493, i.e. S&P 500 ex. the Magnificent 7, over the last ten years. In the RH box, operating margins are repeated; however, in addition to those numbers, analysts’ forecasts for the next couple of years – the orange bars – have been added.

As you can see, U.S. analysts are wildly optimistic. Their forecasts for operating margins exceed anything we have seen before, and it is probably that optimism which has driven investors to the same level of optimism. However, as a rational-thinking person (well, not always, according to my wife!), I am entitled to ask the question: Are investors’ expectations unrealistic?

In my many years in the industry, I have never seen a bigger gap between expectations and reality. However, as a good friend said to me recently, that actually makes it easy to make a handsome return on your investment. All you need to equip yourself with is patience.

Exhibit 5: U.S. operating margins, S&P 493, trailing and forecast
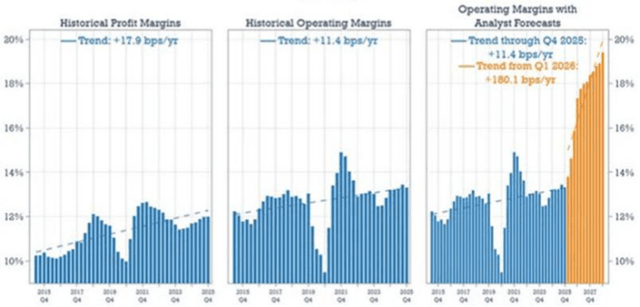
Exhibit 5: U.S. operating margins, S&P 493, trailing and forecast

Source: Hussman Strategy Advisors

Niels


References

Note 1: Concentration is defined as the aggregate market cap of the top-10 stocks as a % of the market cap of the entire market.

Note 2: AI Big 10 include the Magnificent 7 + Broadcom, AMD and Micron Technology


© Absolute Return Partners LLP 2026. Registered in England No. OC303480. Authorised and Regulated by the Financial Conduct Authority. Registered Office: 3rd Floor, 45 Albemarle Street, Mayfair, London W1S 4JL, UK

Important Notice

YOU MAY ALSO LIKE

Dr. Fauci’s attorney removed from Senate hearing

Dr. Fauci’s attorney after being ejected from Senate hearing

This material has been prepared by Absolute Return Partners LLP (ARP). ARP is authorised and regulated by the Financial Conduct Authority in the United Kingdom. It is provided for information purposes, is intended for your use only and does not constitute an invitation or offer to subscribe for or purchase any of the products or services mentioned. The information provided is not intended to provide a sufficient basis on which to make an investment decision. Information and opinions presented in this material have been obtained or derived from sources believed by ARP to be reliable, but ARP makes no representation as to their accuracy or completeness. ARP accepts no liability for any loss arising from the use of this material. The results referred to in this document are not a guide to the future performance of ARP. The value of investments can go down as well as up and the implementation of the approach described does not guarantee positive performance. Any reference to potential asset allocation and potential returns do not represent and should not be interpreted as projections.

Absolute Return Partners

Absolute Return Partners LLP is a London based thematic investment manager committed to megatrend investing. We aim to benefit from long term thematic trends including Climate Change, the Era of Disruption, Last Stages of the Debt Supercycle among others. You can find more information about the megatrend we invest in accordance with on our website.

We are authorised and regulated by the Financial Conduct Authority in the UK.

Visit www. arpinvestments. com to learn more about us.


Original Post

Editor’s Note: The summary bullets for this article were chosen by Seeking Alpha editors.

Credit: Source link

ShareTweetSendSharePin

Related Posts

Dr. Fauci’s attorney removed from Senate hearing
Market & News

Dr. Fauci’s attorney removed from Senate hearing

September 3, 2026
Dr. Fauci’s attorney after being ejected from Senate hearing
Market & News

Dr. Fauci’s attorney after being ejected from Senate hearing

September 3, 2026
LIVE: Fauci testifies before the Senate on the Covid pandemic
Market & News

LIVE: Fauci testifies before the Senate on the Covid pandemic

September 3, 2026
Doctor restores sight at war-torn South Sudan border
Market & News

Doctor restores sight at war-torn South Sudan border

September 3, 2026
Next Post
Doctor restores sight at war-torn South Sudan border

Doctor restores sight at war-torn South Sudan border

Leave a Reply Cancel reply

Your email address will not be published. Required fields are marked *

Search

No Result
View All Result
Column | I’m an oncologist. Every man should know this about prostate cancer. – The Washington Post

Column | I’m an oncologist. Every man should know this about prostate cancer. – The Washington Post

August 31, 2026
Pinterest: Pricing In Disruption That Hasn’t Yet Happened (NYSE:PINS)

Pinterest: Pricing In Disruption That Hasn’t Yet Happened (NYSE:PINS)

August 28, 2026
Voters want a ‘fighter’ says Michigan Democrat in key House race

Voters want a ‘fighter’ says Michigan Democrat in key House race

August 29, 2026

About

Learn more

Our Services

Legal

Privacy Policy

Terms of Use

Bloggers

Learn more

Article Links

Contact

Advertise

Ask us anything

©2020- TradePoint.io - All rights reserved!

Tradepoint.io, being just a publishing and technology platform, is not a registered broker-dealer or investment adviser. So we do not provide investment advice. Rather, brokerage services are provided to clients of Tradepoint.io by independent SEC-registered broker-dealers and members of FINRA/SIPC. Every form of investing carries some risk and past performance is not a guarantee of future results. “Tradepoint.io“, “Instant Investing” and “My Trading Tools” are registered trademarks of Apperbuild, LLC.

This website is operated by Apperbuild, LLC. We have no link to any brokerage firm and we do not provide investment advice. Every information and resource we provide is solely for the education of our readers. © 2020 Apperbuild, LLC. All rights reserved.

No Result
View All Result
  • Main
  • AI & Technology
  • Stock Charts
  • Market & News
  • Business
  • Finance Tips
  • Trade Tube
  • Blog
  • Shop

© 2023 - TradePoint.io - All Rights Reserved!