
hapabapa
In our previous analysis of Texas Instruments Incorporated (NASDAQ:TXN), we expected the company’s growth outlook to remain robust, particularly in the automotive segment (21% exposure) with improved inventory levels. Moreover, we anticipated the company to benefit from the US CHIPS Act benefits on its FCFs.
In this analysis, we focused on the company’s dividends to ascertain their sustainability. Our initial step involved evaluating the company’s status as a dividend-oriented entity by closely examining its capital allocation, particularly in terms of its financing cash flow breakdown. Additionally, we explored the company’s historical dividend yield and payout, identifying the specific dividend strategy it employs. Moving beyond, we analyzed factors such as cash flow generation, revenue growth, and overall financial standing, projecting the trajectory of its dividend performance. Finally, we assessed the impact of dividends on the company’s valuation, utilizing a Dividend Discount Model (DDM) and explaining the implications for our portfolio.
Significance of Dividends to The Company
Firstly, we examined the company’s capital allocation and its dividend history as well as identifying its dividend strategy to determine whether it is a dividend stock.
Capital Allocation
In our previous analysis of Intel, our criteria for a company to be deemed a dividend stock is:
To be considered as dividend stocks, we require that companies’ dividend yields be higher than their annualized stock return. Additionally, we require the 5-year dividend yield to also be higher than the 5-year bond yield of the respective countries of each company. – Khaveen Investments
|
Companies |
Dividend Yield (5-year Average) |
Stock Return (5 years) |
5-yr Annualized |
|
Intel (INTC) |
2.99% |
-21.53% |
-4.73% |
|
Monolithic Power Systems (MPWR) |
0.72% |
265.41% |
29.59% |
|
Lattice (LSCC) |
NA |
837.44% |
56.45% |
|
NVIDIA (NVDA) |
0.17% |
648.88% |
49.58% |
|
Marvell (MRVL) |
0.68% |
182.04% |
23.04% |
|
AMD (AMD) |
NA |
305.78% |
32.33% |
|
Analog Devices (ADI) |
1.83% |
101.48% |
15.04% |
|
Broadcom (AVGO) |
3.01% |
272.68% |
30.10% |
|
Microchip (MCHP) |
1.46% |
124.22% |
17.53% |
|
TI |
2.57% |
47.44% |
8.07% |
|
NXP (NXPI) |
1.25% |
139.01% |
19.04% |
|
QUALCOMM (QCOM) |
2.58% |
63.65% |
10.35% |
|
ON Semi (ON) |
NA |
427.22% |
39.44% |
|
Skyworks (SWKS) |
1.76% |
9.33% |
1.80% |
|
Infineon (OTCQX:IFNNF) |
1.09% |
54.86% |
9.14% |
|
STMicro (STM) |
0.78% |
150.44% |
20.15% |
|
Renesas (OTCPK:RNECF) |
NA |
187.87% |
23.55% |
|
Qorvo (QRVO) |
NA |
24.48% |
4.48% |
|
MediaTek |
4.77% |
306.44% |
32.37% |
|
ams-OSRAM (OTCPK:AMSSY) |
NA |
-79.23% |
-26.97% |
|
Micron (MU) |
NA |
73.78% |
11.69% |
|
Samsung (OTCPK:SSNLF) |
2.91% |
66.83% |
10.78% |
|
SK Hynix |
1.67% |
85.07% |
13.10% |
|
Average |
1.89% |
185.81% |
18.52% |
Source: Company Data, Khaveen Investments
We assessed 17 chipmaker companies and compared their dividend yield with their annualized stock return (5-years). We updated the table above and found Intel remains the only company with a dividend yield above its annualized stock return. However, as its dividend yield is lower compared to the 5-year US government treasury yield of 4.44%, it fails to meet our criteria as a dividend stock. Thus, none of the companies including TI qualified as dividend stocks.
However, while the company does not meet our definition of a dividend stock, other definitions of a dividend stock include:
A dividend stock is an ownership share in a company that regularly distributes a portion of its profits to its shareholders, allowing them to build long-term wealth through a steady stream of income on a systematic basis. – MAC
We compiled the company’s dividends in the table below as well as its debt issued and repaid and share issuance and repurchases.
|
TI ($ mln) |
2013 |
2014 |
2015 |
2016 |
2017 |
2018 |
2019 |
2020 |
2021 |
2022 |
|
Dividends Paid |
(1,175) |
(1,323) |
(1,444) |
(1,646) |
(2,104) |
(2,555) |
(3,008) |
(3,426) |
(3,886) |
(4,297) |
Source: Company Data, Khaveen Investments
Based on the table, in the past 10 years, the company has consistently paid dividends every year, which highlights its regular dividend distribution criteria definition as a dividend stock.
Dividend Policies
According to the CFA Institute, there are 3 types of dividend payout policies which are:
- Stable Dividend Policy: A stable dividend policy maintains consistent dividend payments, relying on long-term sustainable earnings forecasts to ensure gradual growth. This policy aims to maintain a consistent and steady growth rate in dividend payments by adjusting dividends gradually in response to changes in earnings. “A stable dividend policy is one where the dividends paid do not reflect short-term volatility in earnings.”
- Constant Dividend Payout Ratio Policy: Involves using a fixed target dividend payout ratio based on current earnings, resulting in more variable dividend payments compared to a stable dividend policy. This approach ensures that dividends are only paid when there are profits and are not withheld when profits are earned, but it results in more uncertainty for shareholders regarding expected dividends.
- Residual Dividend Approach: Involves setting a target payout ratio for long-term equity requirements using retained earnings and is more volatile than Stable Dividend Policy. Dividends are disbursed when earnings surpass the optimal capital budget, allowing the firm to uphold its desired capital structure at the most efficient cost of capital. Nonetheless, this approach may result in erratic dividends due to fluctuations in both investment opportunities and earnings over time.
TI Dividend Objective

TI
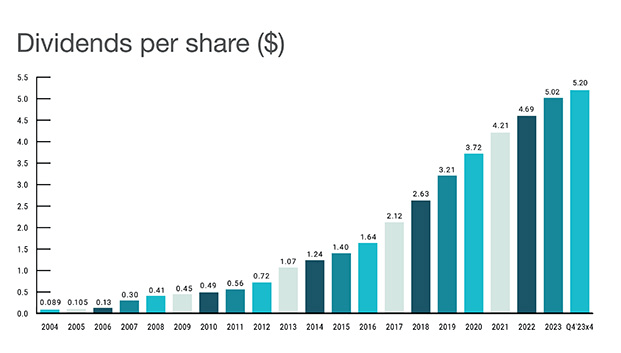
On its website, the company stated its dividend objectives focus both on growth and sustainability. Its increasing trend in dividends per share is also highlighted. In the past 20 years, the company has increased its dividends per share every year as seen in the chart below.
TI
To determine whether the company has a stable dividend policy, we compared its dividend growth with its sales and earnings growth below.
|
Texas Instruments |
2014 |
2015 |
2016 |
2017 |
2018 |
2019 |
2020 |
2021 |
2022 |
2023F |
2024F |
|
Dividends Paid ($ mln) |
1,323 |
1,444 |
1,646 |
2,104 |
2,555 |
3,008 |
3,426 |
3,886 |
4,297 |
4,559 |
4,628 |
|
Growth % |
12.6% |
9.1% |
14.0% |
27.8% |
21.4% |
17.7% |
13.9% |
13.4% |
10.6% |
6.1% |
1.5% |
|
Dividend per Share $ |
1.24 |
1.4 |
1.64 |
2.12 |
2.63 |
3.21 |
3.72 |
4.21 |
4.69 |
5.02 |
5.2 |
|
Growth % |
15.9% |
12.9% |
17.1% |
29.3% |
24.1% |
22.1% |
15.9% |
13.2% |
11.4% |
7.0% |
3.6% |
|
Revenue ($ mln) |
13,045 |
13,000 |
13,370 |
14,961 |
15,784 |
14,383 |
14,461 |
18,344 |
20,028 |
17,923 |
19,069 |
|
Sales Growth % |
6.9% |
-0.3% |
2.8% |
11.9% |
5.5% |
-8.9% |
0.5% |
26.9% |
9.2% |
-10.5% |
6.4% |
|
Net Income ($ mln) |
2,821 |
2,986 |
3,595 |
3,682 |
5,580 |
5,017 |
5,595 |
7,769 |
8,749 |
5,998 |
7,461 |
|
Earnings Growth % |
30.5% |
5.8% |
20.4% |
2.4% |
51.5% |
-10.1% |
11.5% |
38.9% |
12.6% |
-31.4% |
24.4% |
Source: Company Data, Khaveen Investments
Based on the table above, we compiled the past 10 years’ data as well as our forecasts in 2023 and 2024 for revenue and earnings growth. The dividend per share in 2024 is based on the prorated $1.3 quarterly dividend declared by management. We estimated its total dividend paid in 2023 and 2024 based on dividend per share multiplied by our number of shares outstanding forecast based on a 10-year average growth.
Its dividend paid and dividend per share growth have been positive in all years in the past 10 years and are expected to be positive as well in both 2023 and 2024. This contrasts with its revenue and earnings growth trend, which had periods of negative growth. For example, its revenue growth was negative in 2015 and 2019 but its dividend growth was still positive in those years. Additionally, its earnings declined in 2019 but its dividend growth was positive. Furthermore, in 2023, we forecasted both revenue and earnings growth to decline by 10.5% and 31% while dividend growth remained positive. In the total period analyzed, its average dividend growth is higher (15.7%) compared to its average earnings growth (14.2%). Moreover, the range of its earnings growth (-31.4% to 51.5%) is much wider (83%) compared to the range of its dividend per share growth of 3.6% to 29.3% (25.7%). Thus, we believe the company does not adopt the stable dividend policy approach.
|
Dividend vs Stock Price |
2014 |
2015 |
2016 |
2017 |
2018 |
2019 |
2020 |
2021 |
2022 |
2023F |
|
Stock Price Change |
21.76% |
2.52% |
33.13% |
43.13% |
-9.52% |
35.76% |
27.94% |
14.83% |
-12.34% |
4.32% |
|
Average Stock Price ($) |
37.38 |
43.69 |
52.50 |
71.97 |
92.68 |
103.47 |
121.45 |
175.41 |
163.98 |
171.1 |
|
Dividend per Share $ |
1.24 |
1.4 |
1.64 |
2.12 |
2.63 |
3.21 |
3.72 |
4.21 |
4.69 |
5.02 |
|
Growth % |
15.9% |
12.9% |
17.1% |
29.3% |
24.1% |
22.1% |
15.9% |
13.2% |
11.4% |
7.0% |
Source: Company Data, Macrotrends, Yahoo Finance, Khaveen Investments
Furthermore, comparing the company’s dividend growth with its stock price change, the company’s dividend growth had been positive in all years in the past 10 years while its stock price change was negative in 2 years which are 2018 and 2022. Overall, its dividend growth does not reflect its stock price change with an average dividend per share growth of 16.88% which is much higher than its stock price change (2.98%).
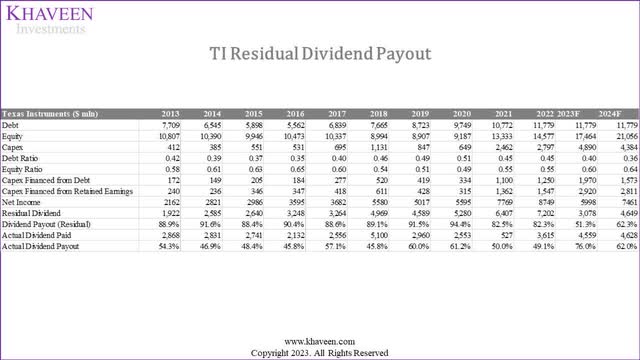
We then examined whether the company adopts a Residual Dividend approach by calculating its residual dividend and payout ratio based on its debt-to-equity ratio and comparing it with its actual dividend paid and payout ratio. To do this, we first compiled its debt and equity in the past 10 years as well as its capex. We calculated its equity ratio based on its equity divided by the total capital (debt and equity). Based on this, we multiplied its capex with the equity ratio to derive the capex financed from retained earnings. Residual income is calculated by deducting capital expenditures from retained earnings, subtracted from net income.
Company Data, Khaveen Investments
As seen from the table, we calculated the company’s residual dividend and dividend payout ratio as higher than its actual dividend paid and payout ratio consistently in the past 10 years.
However, for 2023 and 2024, we calculated its residual dividend payout ratio to decrease significantly. In 2023, we estimate its actual dividend payout ratio to be higher than its residual dividend payout ratio for the first time in 10 years.
This is due to the company’s aggressive increase in capex which increased by 49.6% YoY based on its Q2 TTM capex for fab expansions in Texas and Utah which the company highlighted are to support its capacity increase of 300mm wafers for Automotive and Industrial segments growth. The company is also expanding its backend assembly and test facilities in Malaysia with a goal of 90% of assembly and test activities being in-house by 2030 for greater supply chain control according to the company. From its latest earnings briefing, management expects to continue spending around $5 bln in capex per year but before accounting for subsidies such as from the CHIPS Act.
To support these buildouts and enable future growth, we continue to expect associated capital expenditures to be about $5 billion per year through 2026. – Dave Pahl, Vice President, Investor Relations
Moreover, another reason for the decrease in residual dividend payout ratio is the decrease in earnings in 2023, where we forecasted the company’s earnings contract by 31% for the full year with a slowdown in revenue growth to -10.5% as the semicon industry had declined by 17.7% YoY in YTD Aug 2023 amid the market weakness in PC, smartphone, server, and automotive end markets, thus leading to lower economies of scale and increase in COGS as % of revenue by 2.8% based on Q3 TTM. Another factor for our lower forecast gross margins (63.8% in 2023 vs 68.76% in 2022) is a higher depreciation expense of 19% YoY in Q3 TTM as its fixed assets increase by 20% in 2022 due to an increase in PPE. Additionally, we forecast its operating expenses to increase based on its Q3 TTM where its SG&A and R&D % of revenue had increased by 1.4% and 1.8% respectively, thus contributing to our forecast of a decline in net margins from 43.7% to 33.4% in 2023.
Overall, despite the lower estimated residual dividend payout ratio in 2023 and 2024 that brings it more in line with its actual payout ratio, we believe this does not reflect that the company had changed its dividend payout model approach but instead due to the surge in capex and decline in earnings.
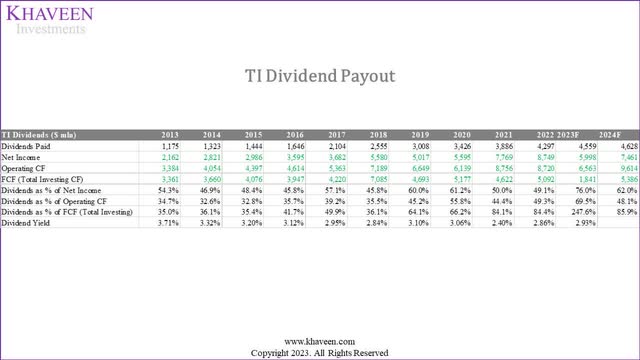
Finally, we compiled the company’s dividends and calculated its dividends as a % of net income, operating CF and FCF.
Company Data, Khaveen Investments
Based on the table, firstly, its dividend as % of net income appears to be very stable in the past 10 years but we estimated it to increase significantly in 2023, as an outlier due to our forecasted decrease in net income of 31%, but we see the ratio moderating down in 2024 as earnings growth recover. On the other hand, its dividends as % of operating income and FCF had been on an increasing trend. Moreover, the average dividend % of net income of TI is 52.8% and the range is also much narrower between 45.8% to 61.2% (15.4%) in the total period excluding 2023. In comparison, the dividend as % of operating income is wider between 32.6% and 55.8% whereas the range for dividend as % of FCF is wider, between 35% to 85.9%. Thus, we believe that the company adopts a Constant Dividend Payout Ratio Policy based on its dividends as a % of net income.
Furthermore, its dividend yield had been on a decreasing trend from 3.71% to 2.86% in 2022, and our forecasted yield of 2.93%. Thus, we believe the company does not adopt a dividend payout model to maintain its yield.
|
Texas Instruments |
2014 |
2015 |
2016 |
2017 |
2018 |
2019 |
2020 |
2021 |
2022 |
2023F |
2024F |
|
Dividend per Share $ (Adjusted) |
1.2 |
1.36 |
1.52 |
2 |
2.48 |
3.08 |
3.6 |
4.08 |
4.6 |
4.96 |
5.2 |
|
Dividend per Share Increase $ |
0.16 |
0.16 |
0.48 |
0.48 |
0.6 |
0.52 |
0.48 |
0.52 |
0.36 |
0.24 |
|
|
Dividends as % of Net Income (Dividend Payout Ratio) |
46.9% |
48.4% |
45.8% |
57.1% |
45.8% |
60.0% |
61.2% |
50.0% |
49.1% |
76.0% |
62.0% |
Source: Company Data, Khaveen Investments
Furthermore, observing the company’s dividend per share increase in $, the company had been raising its dividend increase each year to increase its dividend payout ratio until 2019 when it had achieved a high payout ratio of above 60%, which it then lowered the increase in dividends in 2020 and subsequently again in 2021 which we believe is due to the company trying to maintain the range of its dividend payout ratio. Additionally, in 2023, the company significantly reduced its dividend per share increase as we forecasted the ratio to increase and again in 2024.
Summary
Overall, we believe the company’s highly stable dividend payout ratio indicates that it adopts a Constant Dividend Payout Ratio policy with an average ratio of 52.8% rather than the two other approaches which are Stable Dividend Policy (its dividend growth does not reflect earnings growth) and Residual Dividend Approach (actual dividend payout lower than residual dividend payout). One of the main criteria for a company to adopt a Constant Dividend Payout Ratio policy is it must have positive earnings, which we examine below to determine the sustainability of its dividend outlook.
Sustainability of Dividends
In this section, we determine whether TI’s dividends are sustainable and whether it could continue to increase going forward. Firstly, we examine the company’s business model and its revenue and earnings growth.
Business Model (Revenue)
|
Earnings & Margins |
2013 |
2014 |
2015 |
2016 |
2017 |
2018 |
2019 |
2020 |
2021 |
2022 |
|
Revenue |
12,205 |
13,045 |
13,000 |
13,370 |
14,961 |
15,784 |
14,383 |
14,461 |
18,344 |
20,028 |
|
Revenue Growth |
-4.83% |
6.88% |
-0.34% |
2.85% |
11.90% |
5.50% |
-8.88% |
0.54% |
26.85% |
9.18% |
Source: Company Data, Khaveen Investments
The company’s revenue growth had been positive in most years except in 2013, 2015, and 2019. Nonetheless, it had an average revenue growth of 4.96% in the past 10 years. The positive growth trend indicates that it is positive for stability to generate earnings to be paid out as dividends and maintain its payout ratio.
|
TI Revenues Growth % |
2015 |
2016 |
2017 |
2018 |
2019 |
2020 |
2021 |
2022 |
8-year Average |
|
Industrial |
4,030 |
4,412 |
5,236 |
5,682 |
5,178 |
5,351 |
7,521 |
8,011 |
|
|
Growth % |
-0.3% |
9.5% |
18.7% |
8.5% |
-8.9% |
3.3% |
40.6% |
6.5% |
9.7% |
|
Auto |
1,950 |
2,407 |
2,843 |
3,157 |
3,020 |
2,892 |
3,852 |
5,007 |
|
|
Growth % |
15.0% |
23.4% |
18.1% |
11.1% |
-4.3% |
-4.2% |
33.2% |
30.0% |
15.3% |
|
Personal Electronics |
3,900 |
3,476 |
3,740 |
3,630 |
3,308 |
3,904 |
4,403 |
4,006 |
|
|
Growth % |
3.1% |
-10.9% |
7.6% |
-2.9% |
-8.9% |
18.0% |
12.8% |
-9.0% |
1.2% |
|
Communications Equipment |
1,690 |
1,738 |
1,795 |
1,736 |
1,582 |
1,157 |
1,101 |
1,402 |
|
|
Growth % |
-23.8% |
2.8% |
3.3% |
-3.3% |
-8.9% |
-26.9% |
-4.9% |
27.4% |
-4.3% |
|
Enterprise Systems |
780 |
802 |
898 |
1,105 |
863 |
868 |
1,101 |
1,202 |
|
|
Growth % |
-0.3% |
2.8% |
11.9% |
23.1% |
-21.9% |
0.5% |
26.9% |
9.2% |
6.5% |
|
Other |
650 |
535 |
449 |
474 |
431 |
289 |
367 |
401 |
|
|
Growth % |
24.6% |
-17.7% |
-16.1% |
5.5% |
-8.9% |
-33.0% |
26.9% |
9.2% |
-1.2% |
|
Total |
13,000 |
13,370 |
14,961 |
15,784 |
14,383 |
14,461 |
18,344 |
20,028 |
|
|
Growth % |
-0.3% |
2.8% |
11.9% |
5.5% |
-8.9% |
0.5% |
26.9% |
9.2% |
5.9% |
Source: Company Data, Khaveen Investments
Furthermore, based on the company’s revenue by segment, its growth had been mostly positive for all segments except for Communications Equipment and the Other category which both have negative average growth. However, its main segments Industrial and Auto, had higher growth than the company’s average and as we covered in our previous analysis due to the brighter outlook of Industrial and Automotive end markets, could bode well for TI’s growth outlook and support its dividend sustainability and growth.
IC Insights, Company Data, Khaveen Investments
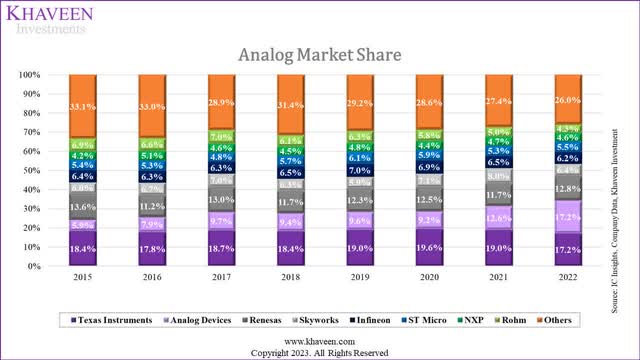
Additionally, as seen by our analog market share chart, the company had consistently maintained its leadership position until 2022 when it was tied with ADI (its share increased due to its acquisition of Maxim). Thus, we believe this reflects the company’s competitive positioning strength, which could bode well for its future revenue prospects and support its dividend sustainability.
|
Texas Instruments ($ bln) |
2022 |
2023F |
2024F |
2025F |
2026F |
2027F |
|
Asset Turnover |
0.81x |
0.85x |
0.85x |
0.85x |
0.85x |
0.85x |
|
Assets |
27,207 |
30,017 |
33,418 |
37,437 |
41,872 |
46,739 |
|
Revenue (Supply) |
20,028 |
23,136 |
25,526 |
28,418 |
31,835 |
35,607 |
|
Growth % |
9.2% |
15.5% |
10.3% |
11.3% |
12.0% |
11.8% |
|
Revenue (Demand) |
20,028 |
17,923 |
19,069 |
20,293 |
21,546 |
22,820 |
|
Growth |
9.2% |
-10.5% |
6.4% |
6.4% |
6.2% |
5.9% |
|
Revenue Projection |
20,028 |
17,923 |
19,069 |
20,293 |
21,546 |
22,820 |
|
Growth |
9.2% |
-10.5% |
6.4% |
6.4% |
6.2% |
5.9% |
Source: Company Data, Khaveen Investments
Nonetheless, we updated our revenue projections from our previous analysis in 2023, which is based on prorated Q1 to Q3 revenues for a total growth decline of -10.5% in 2023. However, we forecast its revenue growth to recover in 2024 and beyond driven by demand from its Auto and Industrial segments.
Overall, the company’s revenue growth with an average of 6.2% is a lot lower than the company’s dividend per share growth (18% average), thus it has to rely on higher earnings growth to support the increase in dividends which we examine further below.
Earnings and Margins
Company Data, Khaveen Investments
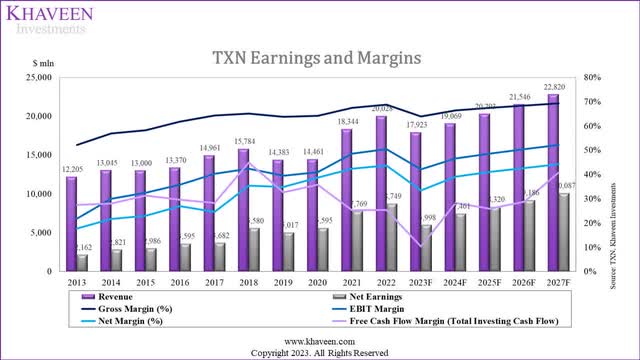
Despite the periods with revenue contraction, its earnings had risen every year except for 2019 in the past 10 years with increasing profitability margins such as gross, EBIT, and net margins as seen in the chart above. Its net income growth had grown by an average of 18.2%, in line with its dividend per share growth of 18%, thus its earnings growth was enough to support its dividend growth.
Company Data, Khaveen Investments
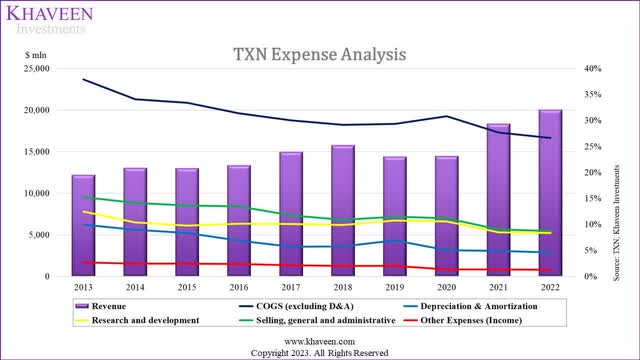
Based on the company’s expense analysis, its margin improvement had been largely attributed to the decline in COGS as a % of revenue. As seen from the chart, its revenues correlate with its COGS as % of revenues, indicating the improvement in COGS as % of revenue due to economies of scale. Moreover, we also previously identified the company’s shift towards 300mm wafers which are lower cost than 200mm wafers supports its margins. Besides that, its operating expenses such as SG&A and R&D as well as depreciation as % of revenue had been decreasing slightly.
Financial Position
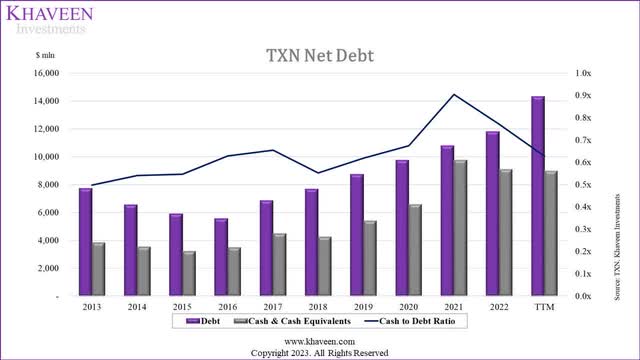
Finally, we also examined the company’s financial position by comparing its debt to cash in the past 10 years below as dividends are paid from the company’s cash balance.
Company Data, Khaveen Investments
While the company’s debt had risen in the past 10 years, so had its cash balances. Its cash-to-debt ratio has trended upward in the past 10 years, which we believe bodes well for its sustainability of dividend payments.
Sustainable Growth Rate
|
Sustainable Growth Rate |
|
|
Dividend Payout Ratio |
52.7% |
|
ROE |
49.9% |
|
Sustainable Growth Rate* |
23.6% |
*(1-Payout Ratio) x ROE
Source: Company Data, Khaveen Investments
Additionally, we calculated the sustainable growth rate of the company, which is the highest rate a company can sustain its growth without raising equity or debt, at 23.6% based on its dividend payout ratio and 10-year average ROE. Compared to its past dividend growth, our derived sustainable growth rate of TI (23.6%) is higher than its average dividend growth (18%), thus we believe its dividends and growth are sustainable.
Outlook
|
Dividend Forecast |
2023F |
2024F |
2025F |
2026F |
2027F |
2028F |
2029F |
2030F |
2031F |
2032F |
|
Expected Earnings ($ mln) |
5,998 |
7,461 |
8,320 |
9,186 |
10,087 |
10,630 |
11,144 |
11,629 |
12,085 |
12,426 |
|
Shares Outstanding (mln) |
908.2 |
890.0 |
873.0 |
857.7 |
842.9 |
827.7 |
813.1 |
800.4 |
789.2 |
777.0 |
|
Expected Earnings per Share ($) |
6.60 |
8.38 |
9.53 |
10.71 |
11.97 |
12.84 |
13.71 |
14.53 |
15.31 |
15.99 |
|
Estimated Payout Ratio |
76.0% |
62.0% |
58.8% |
56.1% |
53.6% |
53.1% |
52.7% |
52.5% |
52.5% |
52.8% |
|
Dividend per Share ($) |
5.02 |
5.2 |
5.61 |
6.01 |
6.42 |
6.82 |
7.23 |
7.63 |
8.04 |
8.44 |
Source: Company Data, Khaveen Investments
Overall, despite the short-term growth headwinds in 2023 for the company, we believe its long-term revenue and earnings growth remain positive driven by its stable market positioning in DAO, high growth automotive and industrial segments, and improving margins due to economies of scale. Therefore, we believe its dividend sustainability and growth remain sustainable in the long term. In the table, we added TI’s 2023 dividend per share ($5.02) and its prorated 2024 dividends ($5.2). We assumed the company would reach its average dividend payout ratio of 52.8% by 2032 and forecasted its dividend per share of $8.44 in that year. Based on our 2032 forecast, we calculated the target ratio based on a prorated dividend per share increase from 2024 to 2032 which is $0.41, thus resulting in a total forward average growth rate of 6%. However, our forward growth is low in comparison to the company’s historical dividend per share growth average of 15.7% and its SGR of 23.6%. Notwithstanding, our forecast shows a consistent dividend growth each year in the forecast period.
Impact of The Company as A Dividend Stock
As we determined TI as a dividend stock despite not fulfilling our criteria, but rather due to its consistent dividend distribution track record, we examined the potential impact the company has on our portfolio being classified as a dividend stock.
Behavior of Dividend Investors
Some characteristics of a dividend investor include long-term focus, risk-averse, income-oriented, value-oriented, and conservative. With a long-term focus, dividend investors hold the dividend stock for a long period due to benefits such as accumulating dividends over time. Another characteristic of dividend investors is risk-averse individuals who prefer stable dividends, requiring them to hold onto their stocks. Dividend investors are also characterized as income-oriented individuals, receiving dividend income over time for such as retirement planning. Furthermore, dividend investors also focus on value and may choose to hold onto their stocks during a market selloff. According to Merrill Lynch, dividend stocks are less volatile. Finally, dividend investors are also conservative in investing, preferring to invest in well-established companies that have a track record of consistent dividends, thus holding onto their stocks for a longer period.
Impact of TI on Portfolio
As we identified dividends investor’s behavior corresponds to the long-term holding of a stock, we examine how this impacts the stock characteristics, and how that benefits our diversified portfolio of investments. we compared the company with the semicon industry and the US market index to determine the impact based on volatility (standard deviation based on their 10-year average price change), liquidity in terms of average volume of shares and value of shares traded, share price support by measuring the average stock decline in major market drawdowns and risk-adjusted return based on annualized 10-year returns divided by standard deviation.
|
Comparison |
TI |
Semicon Industry (SOXX) |
US Stock Market (VTI) |
|
Risk (Standard Deviation) (10-years) |
6.2% |
7.2% |
4.5% |
|
Liquidity (Average Volume of Shares) |
4,691,460 |
886,789 |
3,034,853 |
|
Liquidity (Average Value Traded) ($ mln) |
693.44 |
405.52 |
632.68 |
|
Liquidity (Average Spread) |
0.03% |
0.03% |
0.01% |
|
Average Drawdown (Past 10-years) |
-16.13% |
-27.18% |
-21.28% |
|
Average Risk-adjusted Return |
3.99 |
5.29 |
3.36 |
Source: Seeking Alpha, Yahoo Finance, Khaveen Investments
As seen in the table, TI has displayed a lower risk with a standard deviation of 6.2% compared to the semicon industry which has a higher standard deviation at 7.2% but is higher compared to the overall US stock market risk. The inclusion of TI in our portfolio’s semicon exposure therefore benefits it with lower risk.
Similarly, the performance of TI’s stock had been more resilient in the past 10 years during market selloff periods with an average drawdown in stock price of -16%, outperforming not only the overall semicon industry average but also the US market average. Thus, the inclusion of TI in our portfolio benefits it with lower volatility.
In terms of liquidity, TI has the highest average volume of shares traded followed by the US stock market and the semicon industry VTI. However, VTI has a narrower average spread of 0.01% compared to TI and SOXX which are both tied. Thus, we believe it is unlikely TI as a dividend stock provides liquidity advantages despite its higher volume and value of shares traded.
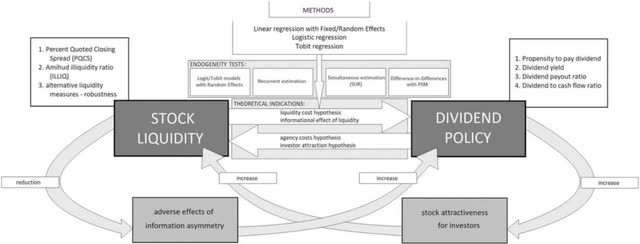
Research in International Business and Finance
Furthermore, the diagram from Research in International Business and Finance illustrates the connection between a company’s stock liquidity and its dividend policy. It highlights the connection between liquidity and dividend policy, attributing it to decreased information asymmetry. Additionally, it underscores the positive impact of dividend policy on stock liquidity. However, the study also highlighted the negative relationship between dividend policy and liquidity such as in the case of a homemade dividend where investors sell their stock for cash flow which increases liquidity. Hence, as these factors counterbalance each other, the association between dividend policy and liquidity remains inconclusive. Therefore, while TI having a relatively high liquidity is a positive, we cannot attribute the reason for this due to it being a dividend stock.
Moreover, TI has a higher average risk-adjusted return at 3.99 than the US stock market average but is still lower than the semicon average, thus we believe it as a dividend stock does not provide an advantage in terms of risk-adjusted returns.
DDM
Based on the first point, we believe the company adopts a Constant Dividend Payout Ratio policy by maintaining its dividend payout ratio based on net income, we valued the company based on a DDM model below based on our dividend forecasts.
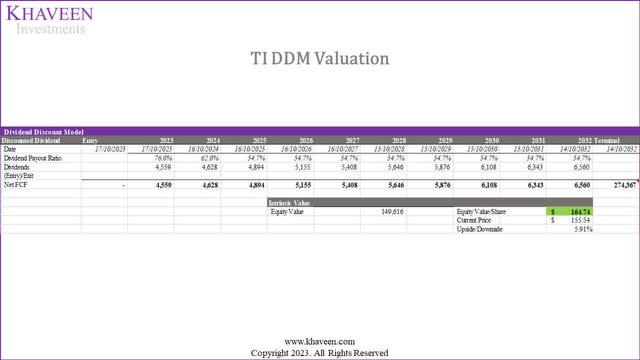
Khaveen Investments
As the company’s sustainable growth rate of 24% is higher than its cost of equity (10.3%), we could not calculate its terminal value based on its sustainable growth rate due to a negative discount rate. Therefore, we instead applied a terminal value based on the chipmaker’s average P/B multiple of 4.41x multiplied by our 2032 book value forecasts for the company ($62.2 bln), which is $274.4 bln. Thus, our DDM model shows an upside of 5.91% with a discount rate of 10.3% (cost of equity).
Summary
Overall, we believe there are several benefits that TI as a dividend stock on our portfolio including offering lower risk (volatility) compared to the semiconductor industry, as well as lower drawdown than both SOXX and the overall US stock market due to its better resilience over the past decade during market selloffs. Additionally, our DDM valuation shows its shares are undervalued with a terminal value based on book value and industry average P/B.
Risk: Market Headwinds
As mentioned, we expect the company’s full-year revenue growth to decline by 10% in 2023 amid the weak semicon market growth. Based on its earnings briefing, management highlighted that it continued “to operate in a weak environment” and guided its Q4 2023 revenues to be down 12% YoY. Specifically, the company highlighted “industrial weakness broadened” during the quarter, which is its largest segment (40% of revenue). On the other hand, some of its key competitors such as ADI (2.19%) and STMicro (7.5%) are expected to have positive growth in 2023 based on analysts’ revenue consensus, indicating the company could lose market share against these competitors.
Valuation
DCF
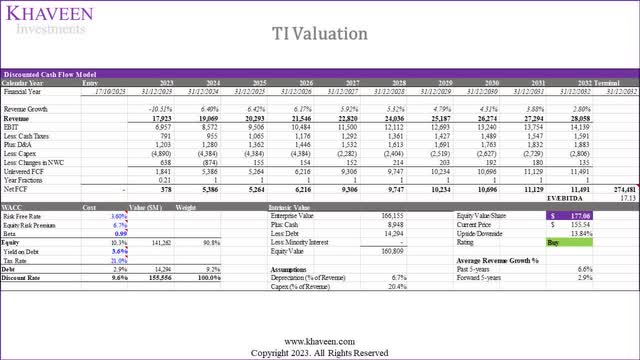
Khaveen Investments
Notwithstanding our DDM model, we continue to value the company with a DCF valuation as we do not primarily invest in the company for its dividends. Instead, the company has strong FCFs with an average FCF margin of 30.9% in the past 10 years. Nonetheless, we believe the benefits of TI’s stock in our portfolio such as lower risk and reduced volatility are positive factors for holding its stock. Based on a discount rate of 9.6% (company’s WACC) and terminal value based on the average chipmaker EV/EBITDA of 17.13x, our model shows an upside of 13.84%.
|
Valuation |
Price Target ($) |
Upside % |
|
DDM Valuation |
164.74 |
5.91% |
|
DCF Valuation |
177.06 |
13.84% |
Source: Khaveen Investments
Verdict
In summary, we believe the company follows a Constant Dividend Payout Ratio policy, maintaining a stable dividend payout ratio of 52.8% on average which we used as our long-term dividend payout ratio target as an assumption to project its dividends. Despite short-term challenges in 2023, we believe the company’s long-term outlook remains positive, driven by its strong position in the DAO market, growth in automotive and industrial segments, and improving margins from economies of scale. Consequently, we expect its long-term dividend sustainability and growth to continue, with a projected forward average dividend per share growth of 6%. Furthermore, we believe TI offers benefits in our portfolio, including lower risk and reduced volatility compared to the semiconductor industry and strong fundamentals. While we value the company through DDM and DCF models, we believe the primary attraction is not just dividends but also its strong FCFs and positive attributes such as lower risk and volatility. Therefore, we rate the company as a Buy with a price target of $177.06, which is lower compared to our previous analysis due to a slightly lower forward growth average, but still provides a 14% price upside
Credit: Source link