This article updates my outlook for 2024 with the latest Momentum Gauge® signals and a revisit of the January Investing Experts Podcast interview with Rena Sherbill at Seeking Alpha. This past April 2nd marked an early negative Momentum Gauge® test signal followed by an official negative daily signal on April 12th. This article builds on prior signal events with more insights on how to benefit from changes in the market momentum conditions.
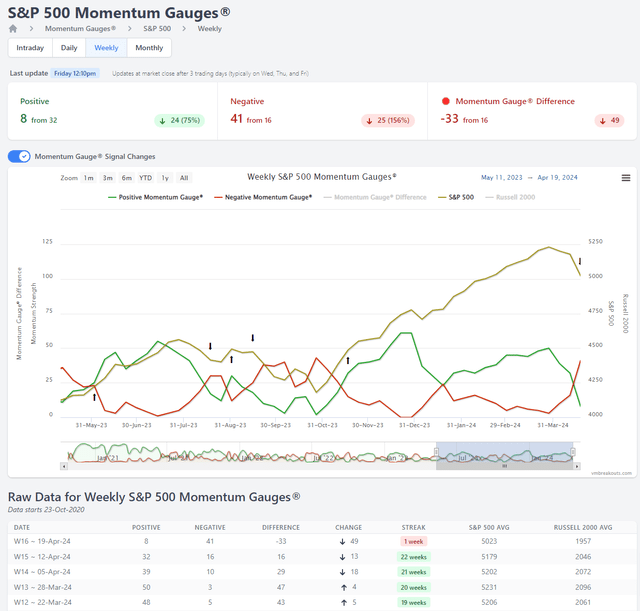
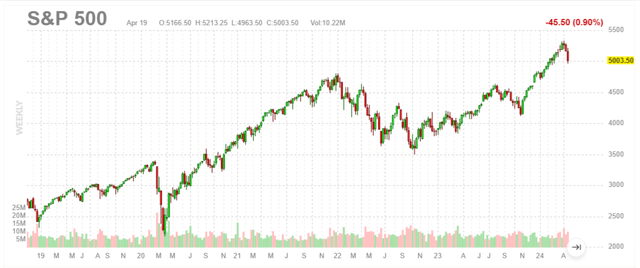
S&P 500 weekly gauges
www.vmbreakouts.com
Last year I shared market topping signals from July that led to the lows in October as illustrated on the S&P 500 weekly gauges above:
Head And Shoulders Everywhere As Technology And Real Estate Breakdown
That was followed by a November breakout signal and a strong rally to recent March highs.
Breakouts Everywhere As Buffett Moves To Record High $157 Billion Cash
We will revisit these signals, but more importantly discuss where the market may be headed in an uncertain election year.
Technology Hitting The Peak Of The 2024 Market Cycle With Rotation To Value
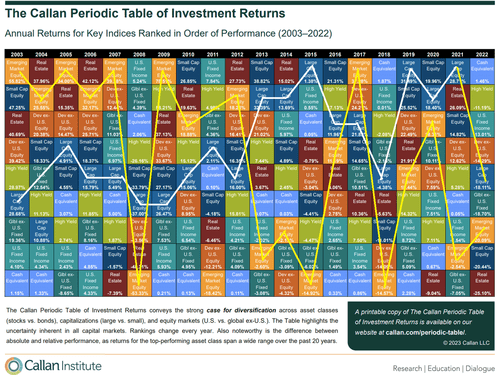
The thing to consider is that we rarely ever see market leaders from the prior year be market leaders for the coming year. ~ JD Henning, January Podcast
Callan Institute
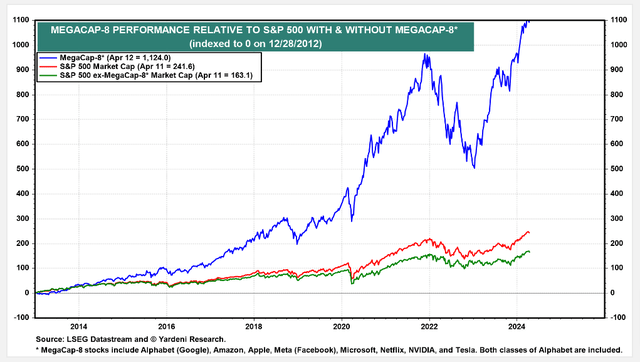
And by that, I look at the Magnificent Seven over the past two years, they’re back to where they were in 2022 at the peak and they had quite the ride. ~ JD Henning, January Podcast
Yardeni.com
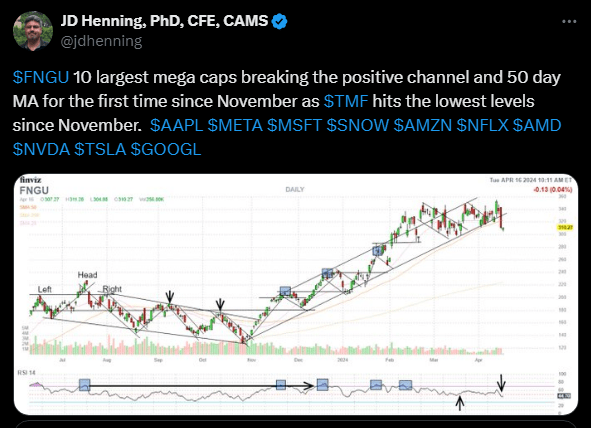
The mega cap giants have an enormous weighting on the market indices. They are also concentrated in the Technology sector where Apple (AAPL), Microsoft (MSFT), Nvidia (NVDA) and the rest of the semiconductors like Broadcom (AVGO), Advanced Micro Devices (AMD), Intel (INTC), Qualcomm (QCOM), Micron (MU) and many others have much larger market caps than other sectors combined. As a result I find it very important to follow and chart the technical indicators of BMO REX MicroSectors FANG+ Index 3X Leveraged ETN (FNGU) representing the 10 largest stocks in the US stock market.
Twitter.com
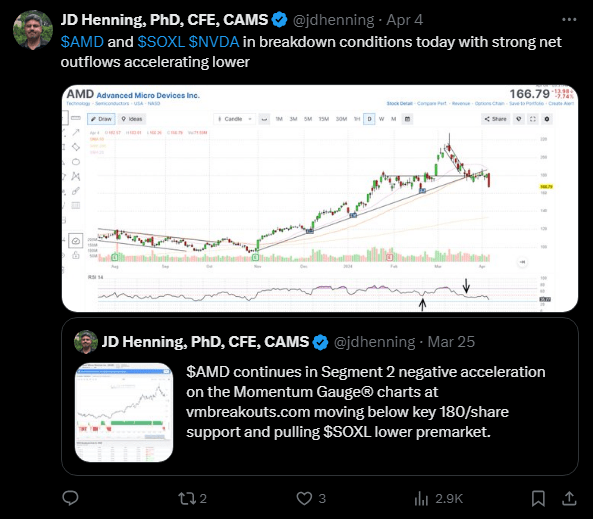
These early breakdown signals combined with the AMD and NVDA stock alerts and the Technology sector gauges began to turn negative as early as March.
We see a lot of great numbers from NVIDIA (NVDA), but investors often forget that last year it lost 67% from the peak. And those kinds of rides can show up again. They’re not just one-time events and people take profits and momentum works in both directions. ~ JD Henning, January Podcast
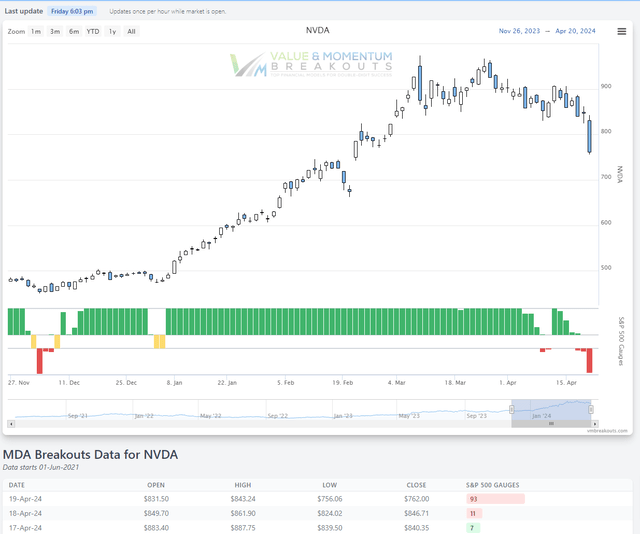
On the Momentum Gauge chart for Nvidia the signal first turned negative on April 10th and then again on April 17th indicating selling signals after months of very strong buy signals. Traders also use the declining positive MDA values as early warning indicators of weakening momentum.
www.vmbreakouts.com
Twitter.com
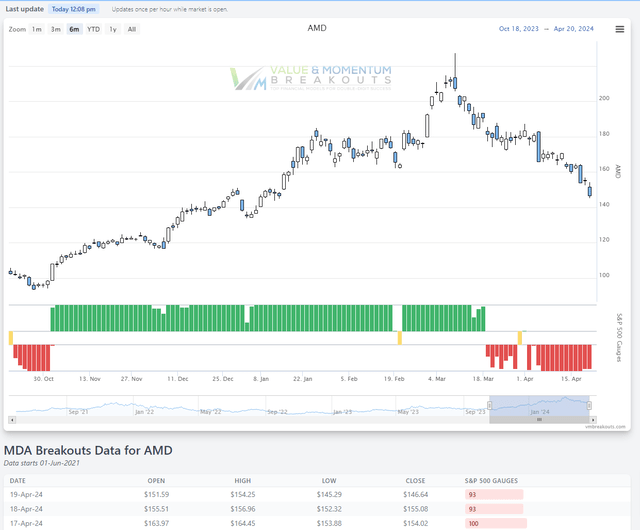
Similarly, the indicators were turning negative on AMD back on March 19th. This was when Micron had a large earnings beat and the overall Semiconductor picture had not yet turned negative.
www.vmbreakouts.com
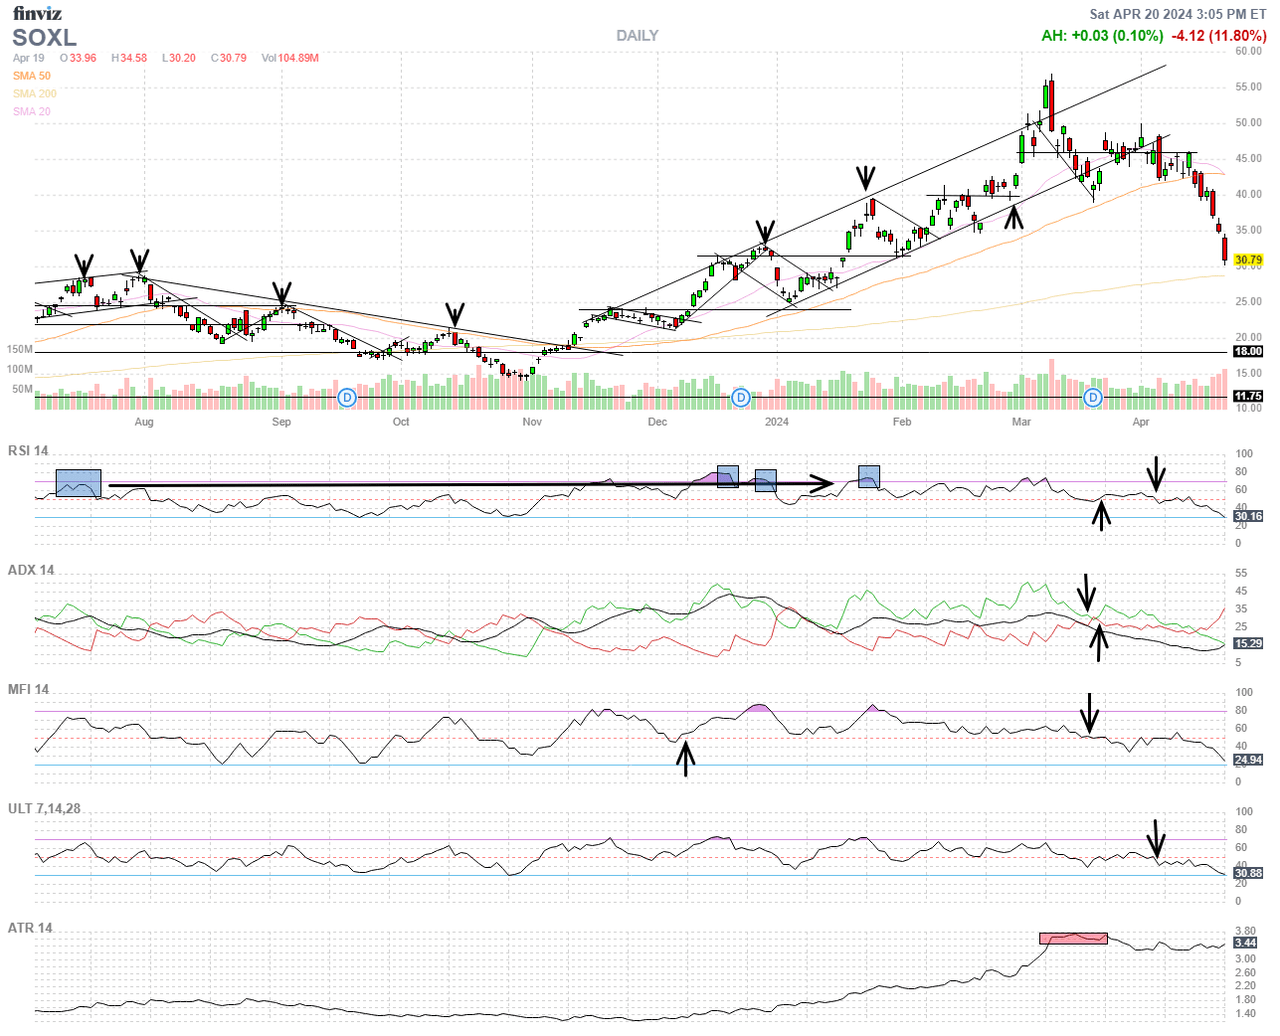
Since then Semiconductors have completely broken the positive channel from November with (SOXL) down -25.83% in one of the worst weeks ever for semiconductors.
FinViz.com VMBreakouts.com
So where is the rotation to value?
Long term portfolios are based on successful value models from published financial research with additional enhancements using the MDA methodology. These value strategies were covered in a recent Seeking Alpha Webinar with Daniel Snyder here:
Webinar Replay: JD Henning’s Momentum Breakout Models For 2024
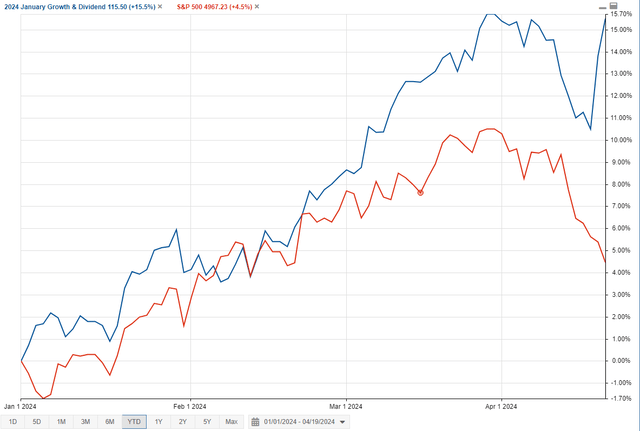
The January Growth & Dividend long term buy/hold portfolio is up +15.5% YTD adjusted for dividends and has no representation in the semiconductor stocks. This portfolio is invested in low P/E, low valuation energy and financial stocks with high dividends above 2%.
StockRover.com
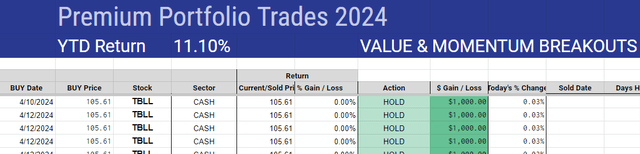
The actively traded Premium Portfolio is up +11.1% YTD and moved to cash on April 12th following the negative S&P 500 gauge signal as part of the rules to avoid major market downturns as it did last week.
VMBreakouts.com
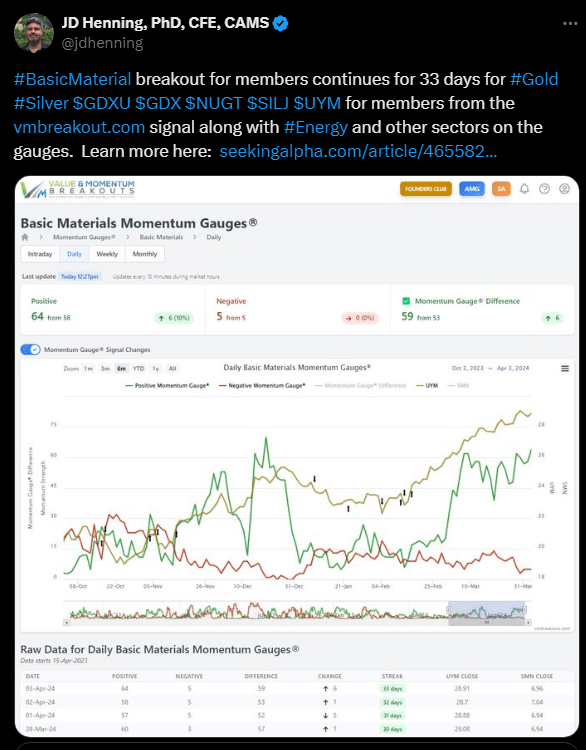
Prior to moving to cash the portfolio was heavily weighted toward Energy and Basic Materials following the Sector Gauge breakout signals from February 15th of these two sectors. Some of the stocks recently held over a week ago have started to show signs of recovery on Friday despite the large market declines.
When the Premium Portfolio restarts on the next S&P 500 positive signal it is likely to return to the most positive sectors and stocks with good valuations for long term growth.
Twitter.com
More on the different types of portfolios offered in 2024 is available here:
Part 2: New Selections For 2024 Long-Term Portfolios And Their Performance Vs. The S&P 500 Since 2018
Part 1: 5 Stock Portfolios And Their Performance Vs. The S&P 500 Since 2018, And A Huge Gap
So where are the markets headed in 2024?
In 2024, there are things happening that we have not seen in decades. One is we have the largest ongoing quantitative tightening program from the Federal Reserve that we’ve seen — ever seen, and combined with the highest interest rates, Fed funds rates in 22 years. ~ JD Henning, January Podcast
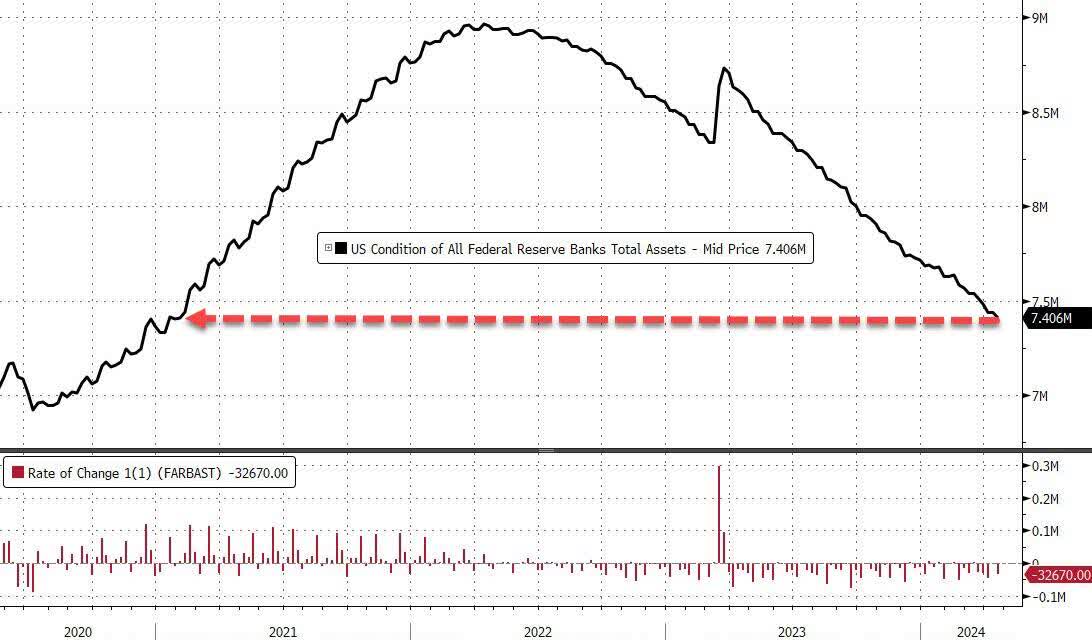
Fed Balance Sheet tightening liquidity back to the lowest level since February 2021 at $7.4 trillion.
Bloomberg
Over the years, I have studied and written at length about the quantitative tightening program and its market effects since its first major implementation in 2018. In short, this Fed balance sheet tightening drains liquidity and at some threshold creates significant market volatility as it did in 2018.
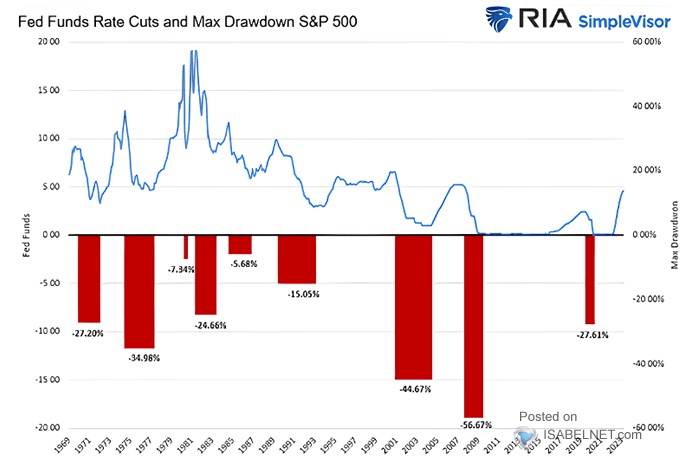
It isn’t the hiking that leads to a market downturn, but it’s the period of time when the Federal Reserve keeps the rates higher for longer that has led to market corrections every single time after a rise in the Fed funds rate. ~ JD Henning, January Podcast
RIA SimpleVisor
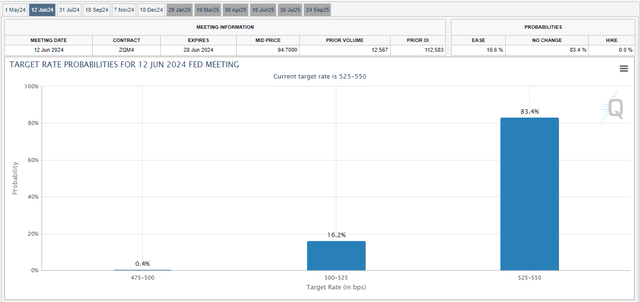
Back in January there was a 100% certainty of a Fed rate cut by the June FOMC meeting. To the surprise of many, the odds of ANY rate cut in June are now down to 16.6%. This is definitely an unexpected “higher for longer” scenario that is adverse to markets. Many companies and consumers have been banking on lower rates and it is especially difficult for smaller businesses and companies burdened to refinance CRE loans at much higher rates.
CMEgroup
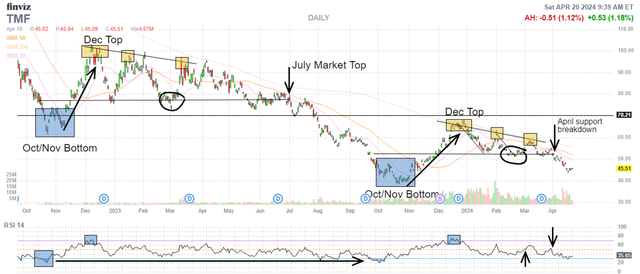
Another indicator that I think is really substantial for 2024 are the long-term bond funds. If you look at (TMF), I would encourage listeners to take a look at that chart and just look at the amazing similarities to 2022. ~ JD Henning, January Podcast
Look at the April breakdown in support of the Direxion Daily 20+ Year Treasury Bull 3X Shares bond fund (TMF) this month and you can see again the strong effects on the stock market. When bonds were rising from the October lows and yields were falling this was favorable to a strong Q4 market rally in 2022 and 2023. Now that yields are rising sharply again to November levels the market has begun to pull back.
FinViz.com VMBreakouts.com
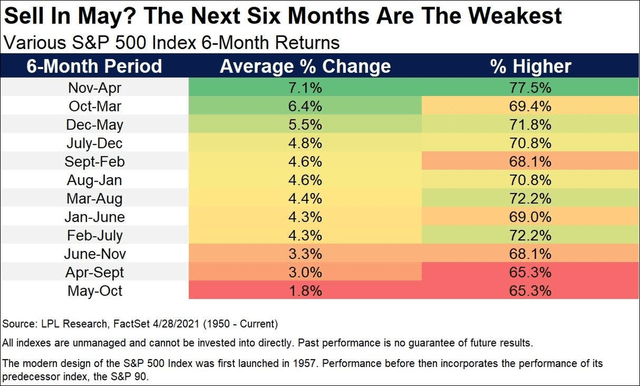
Historically from 1950 the weakest 6-month return period of the S&P 500 is from May to October. You can see that pattern clearly in the bond chart above that also closely resembles market performance. Conversely the best 6-month return period has been from November to April. If the pattern follows again for 2024, expect chop with some gains into the summer and another decline into October.
LPL Research
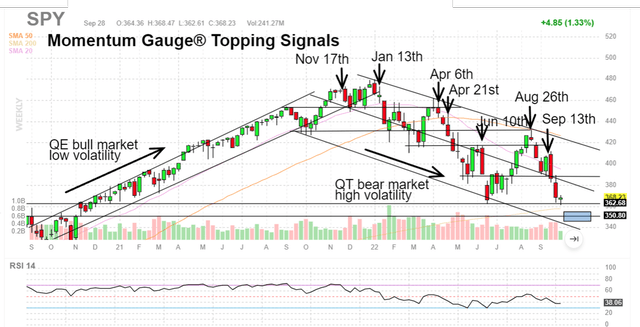
So looking one last time at the S&P 500 (SPY) (SPX) Is this a major market top with rapid downward acceleration coming? Initially the weekly chart of the S&P 500 certainly looks ominous like the start of a major decline, but it could be quite similar to the start of 2022. We’re starting to see more market outflows and rotations to value sectors.
FinViz.com
A close examination back to the 2022 top shows that the Fed ended QE 4 and was just beginning the first tightening cycle since 2018. The market volatility changed dramatically when QE was ended. Despite a sharp decline on the January 13th signal the S&P 500 continued to rebound in bearish stair steps with a sequence of frequent lower highs and lower lows that lasted through the lows of November 2022 shown above.
SPDR S&P 500 ETF for 2022 topping signals
FinViz.com VMBreakouts.com
My outlook for 2024 is that the market is heading for more negative choppiness as the Fed continues to hold rates “higher for longer” with diminishing odds of a rate cut toward September. We will see many bear bounces and sector rotations similar to 2022 while tightening liquidity and high rates continue to dampen initial market enthusiasm.
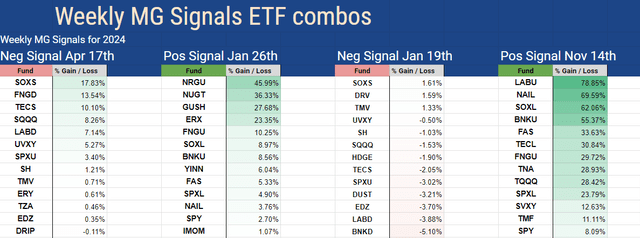
Our best strategy is to follow the money flows and the best valuations in the market to avoid the largest market downturns and capture the best gains wherever possible. Sometimes that is in Bull funds and sometimes in Bear funds following the signal changes either daily or weekly.
VMBreakouts.com
Conclusion
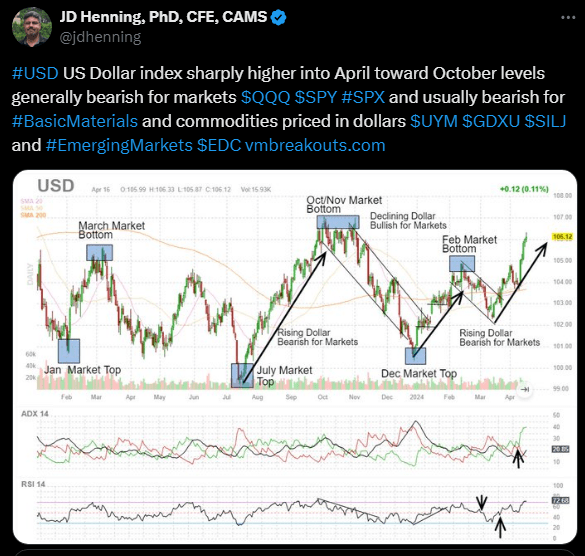
The US Dollar is one of the best indicators of money flow and investors’ desire for safety. As I always say,
I never know what the future holds, but I do know that if the money flows are going out, it’s a good time to be a little bit more cautious and concentrate on the more positive sectors. ~ JD Henning, January Podcast
Twitter.com
I wish you the very best in all your trading decisions and I am here to help.