

Editor’s note: Seeking Alpha is proud to welcome Wise Bull as a new contributor. It’s easy to become a Seeking Alpha contributor and earn money for your best investment ideas. Active contributors also get free access to SA Premium. Click here to find out more »
oatawa
Introduction
ProShares S&P Technology Dividend Aristocrats ETF (BATS:TDV) is an ETF that tracks the performance of the S&P® Technology Dividend Aristocrats® Index. The fund uses a dividend metric to select companies with a strong dividend history in the technology space among the S&P 500 companies.
The ETF strategy sounds simple and may be very appealing to many investors as it is based on dividend growth which is traditionally one strong measure for quality companies.
However for technology companies, I believe dividend metric is not an effective measure for quality in technology growth. Our analysis shows that technology companies typically don’t have a reliable dividend history. Furthermore tech dividend growth is very difficult to achieve due to the technology life cycle that is much shorter than in the non-technology industries. So I don’t recommend TDV as a long term buy in the technology space.
What is TDV ETF about?
According to the ProShares website, TDV is an ETF used to track the performance of the S&P® Technology Dividend Aristocrats® Index. It claims
The only ETF focusing on the S&P Technology Dividend Aristocrats—well-established, technology-related companies that have consistently raised their dividends for at least seven years.
TDV’s holdings are quality names that, as a group, generally have had stable earnings, solid fundamentals, and strong histories of profit and growth.
More specifically the fund targets companies from the U.S. technology sector but may also include technology-related companies from the communication services and consumer discretionary sectors, which may cover: Internet direct marketing retail, Interactive home entertainment and Interactive media and services.
TDV is a relatively new ETF with 4.5 years of history. It was initiated on November 5, 2019. It is currently still a small ETF with AUM of $281.92M and a total of 36 holdings as of 2024-04-08.
The following break-down chart from SA shows 88.27% is in technology as of 2024-04-08.
SA Data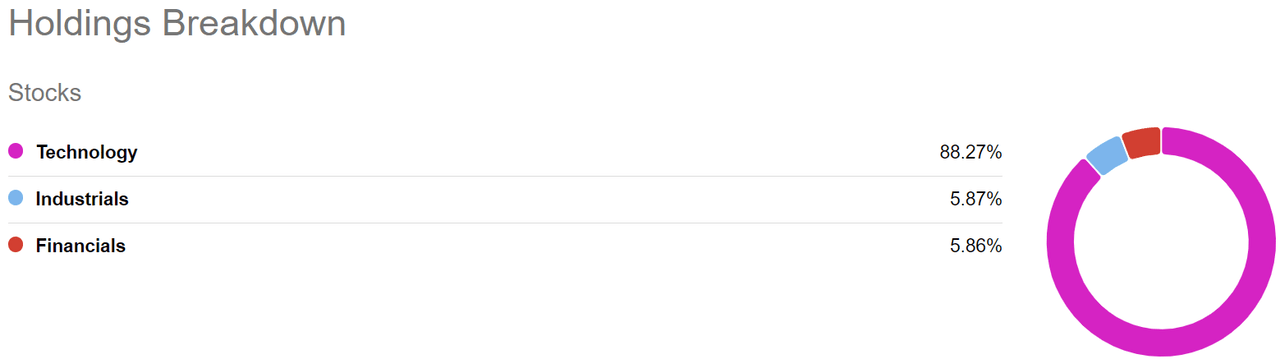
Also as shown below from the ETF factsheet, the fund has more weight in Semiconductors at about 20%, most of the top 10 holdings such as Qualcomm Inc, Broadcom Inc, are in the Semi industry.
TDV FACT SHEET (TDV FACT SHEET from ProShares.com)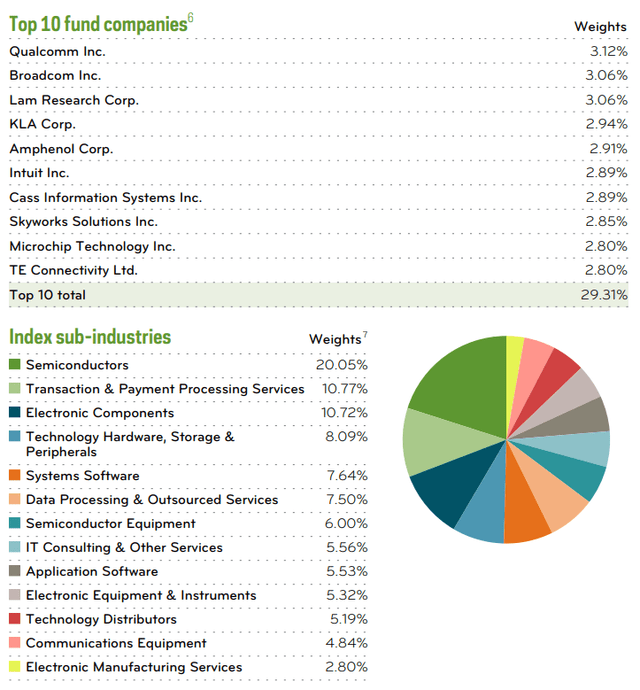
The Semi top weight is not surprising because Semiconductors represents one of the most profitable tech businesses. One can certainly find a few Semi companies with decent dividend history such as the ones in the TDV top holdings. However I find it very difficult to discover other tech companies that can pay stable growing dividends. This probably explains why the total number of holdings is 36 currently. I consider 36 to be a very small holding total for an index ETF. Although 36 holdings do not really lose much diversification in theory for an equal weighted portfolio according to Modern Portfolio Theory, I believe it may have a rather high risk of missing tech companies that can better meet the “quality names” target simply because dividend growth for at least “7 years” is simply too limiting.
As a dividend ETF, TDV currently has a yield of 1.16% with no evident dividend growth history in its 5-year history. So TDV is not attractive to dividend investors. As a comparison the benchmark S&P 500 SPY is paying a higher dividend with 1.3% yield. The top two holding companies in TDV pay better dividends. QUALCOMM Incorporated pays a 1.83% dividend and Broadcom Inc. pays a 1.52% dividend. Investors may find both companies are more attractive dividend holdings in their investment portfolio.
Dividend paying has not been a reliable indicator for quality technology companies historically. In fact most tech companies that are growth companies pay nominal dividends or not at all. Take one of the best technology companies Apple Inc. as an example. As recorded from Investopedia, Apple Inc. has paid a quarterly dividend since 2012. The company paid a quarterly dividend from November 1988 to November 1995 before suspending it for seventeen years. So during these years when Apple did not pay a dividend, I would argue that it is very debatable if one would consider it as a less quality technology company to be a long holding.
The other good example is Cisco Systems (CSCO). Cisco was a top technology company during the internet boom time with peak growth occurring from 1998 to 2001. Cisco only started to pay dividend in 2011 and has a pretty consistent dividend history since. Again I think it will be hard to tell if Cisco is considered a better quality before dividend or after. It is still pretty questionable today if investors would consider CSCO as a top holding for technology. The latest holding list of TDV has AAPL sitting at the bottom while CSCO is not included.
In my view a stable dividend growth is too hard to sustain for technology companies because the modern technology products are much short-cycled in nature. John Chambers, CEO of Cisco Systems from 1995 to 2015 once concluded that
businesses used to have to reinvent themselves every decade to remain viable. Now, they have to be ready to do that “every three to four” years
The short modern technology cycle certainly explains why it is hard to find so-called dividend “Aristocrats” in the tech space. I can even further argue that the technology companies that thrive for paying a growing dividend may not be deploying a winning strategy for long-term business growth. Companies instead should re-investing their money in new businesses, new products etc.
I view the dividend paying as an indicator of slowing business growth for the increasingly mature technology companies that may grow only at low single digit. It is a sign of reaching an end and this may well be the turning point for a “high (growth) ” tech to become a “low (growth)” tech. The technology stock with such (slow) growth expectation typically means substantial multiple-contraction. It will take much more (re)-investing in newer technologies to get the growth back if at all. I find many such stories in tech stocks and companies like CSCO as mentioned above, Intel Corporation (INTC), and International Business Machines Corporation (IBM). Cisco’s growth has been in a steady incline since 2011 since it starts to pay dividend. As show in the SA database its last 10-year revenue growth average is 1.8% while in 2011 (when starting dividend) it was growing at 8% over 2010 as shown in its 2011 annual report. In 2010 it showed a much higher double-digit 11% revenue growth over 2009.
Tightening cycle is not helping. It is common knowledge that the tightening cycle is bad for business expansion as well as profit margin. I think this will work the worst against particularly those technology companies that have to maintain their dividend growth. This is clearly indicated by the following tables with the fund fundamental metrics:
Author Self-Compiled ETF metrics (Author self-maintained data sheet)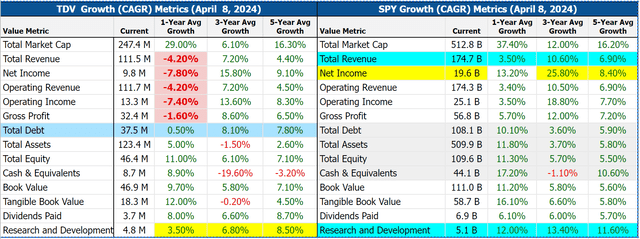
Here I compare TDV with SPY (S&P 500 ETF Trust). As shown in the table, one can clearly see that SPY has all these top line (Revenues) and bottom line (Incomes) in green for the 1-year average growth while TDV has all metrics in red showing negative growth in both revenue and income numbers. Keep in mind that the last 12 months are right in the middle of the current tightening cycle. TDV is doing really badly in this cycle. Over 3 years and 5 years. SPY still shows larger growth in the top line (revenues). It should also be pointed out that the 3-year income growth average for SPY (25.8%) is also much higher than TDV (15.8%).
Notice that TDV has a slightly higher income growth average over the last 5 years. This seems to support the dividend growth strategy. However the fund is relatively new and has not enough historical data to validate it. On the other hand, one can clearly see the alarming trend that TDV companies are having much more de-accelerated business than the rest of S&P companies on average, as they are making less money as the years move on, with the recent 12 months in complete red. It bears a question if TDV has selected the better ones in the S&P for the last 5 years. In fact, using the data above one can even argue the fund strategy has probably picked up a bunch sitting pretty slow in the tech stack in their industries during its short history since November 5, 2019, a few months shy of 5 years. This makes the above data (1-Year, 3-Year and 5-year averages) all relevantly convincing.
The subpar return for TDV stock price performance can also be illustrated by comparing SPY. The chart below shows that the S&P 500 SPY has gained 25.2% while TDV is up 20.21% in the last 3 years.
3-Year stock price comparison: TDV and SPY (SA charting for TDV)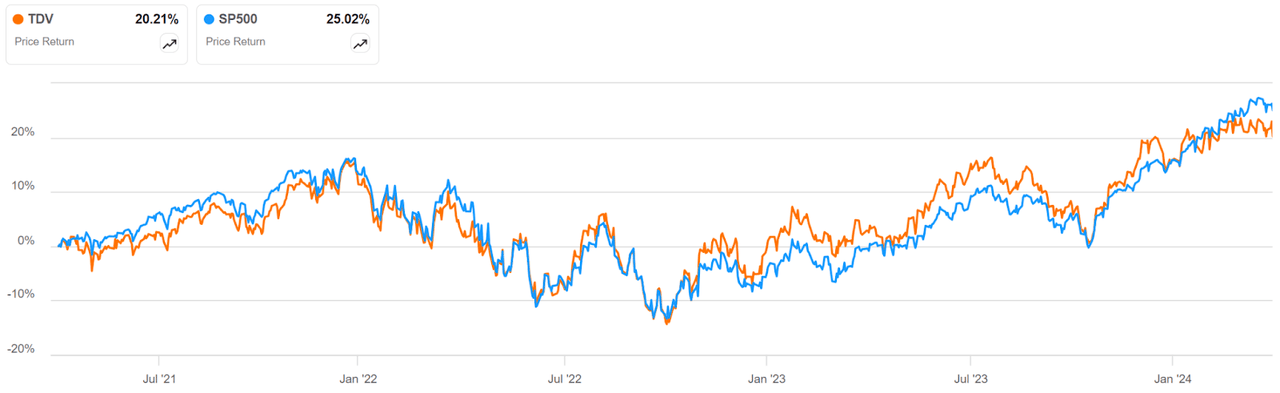
Peer Comparison
The following chart also shows the comparison with iShares Core S&P 500 ETF (IVV) and ProShares S&P 500 Dividend Aristocrats ETF (NOBL).
SA Charting on TDV adding IVV and NOBL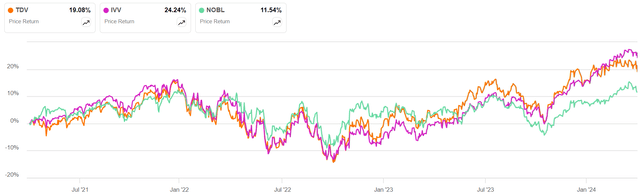
IVV is iShares Core S&P 500 ETF. I has the gain of 24.24% in the last 3 years. NOBL is ProShares S&P 500 Dividend Aristocrats ETF that shows a smallest 11.54% gain. NOBL pays a 2.07% dividend currently and has a very impressive dividend growth with 5 Year Growth Rate (CAGR) of 7.15%. NOBL has more attractive dividend history than its technology sister fund TDV which pays only a 1.16% dividend with no 5-year div growth.
Compared to tech-heavy Invesco QQQ Trust ETF (QQQ) and Technology Select Sector SPDR Fund ETF (XLK), TDV’s performance is much worse. The chart below shows the time duration since TDV interception, XLK is up 143.79% which is almost a double of TDV’s 78.99%. QQQ also beats TDV handily by about 50%.
Stock price comparison: TDV, QQQ, XLK (SA charting for TDV, add QQQ, XLK.)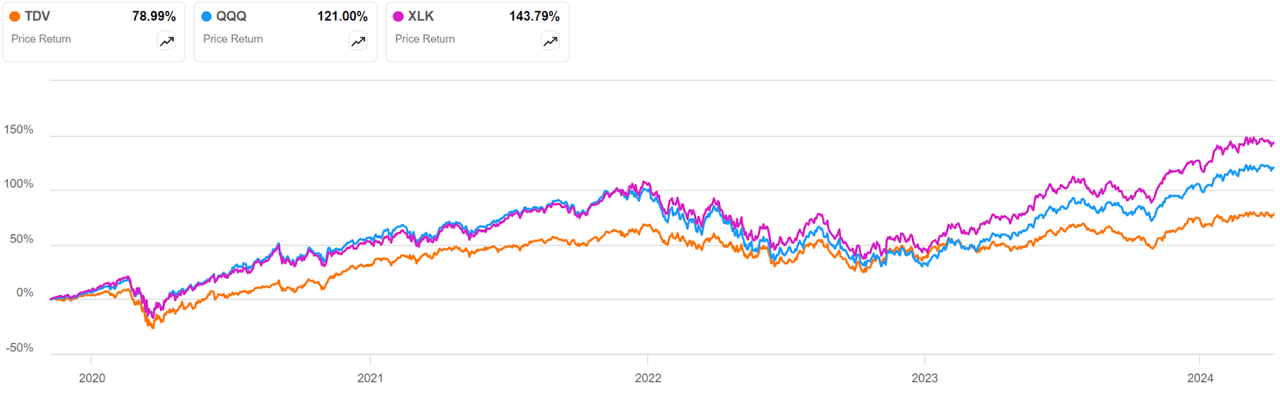
Upside Risks
Upside risks for my current thesis and rating of TDV are that if the macro economical conditions improve significantly, many technology companies will be able to make more steady profits and it is possible for more companies to pay dividend consistently during some years. Dividend investors may find TDV more attractive. Also the possible rate cut by FED in 2024 may also boost the expansion opportunities for the technology companies. Under these conditions the technology stocks and ETFs such as TDV tend to do better than the overall market.
Conclusion
Due to the nature of technology life cycle, it is unlikely the current TDV strategy would produce an outperforming portfolio in the technology space in the longer time horizon. It has been proven that dividend-paying is not a reliable indicator for good technology companies. The recent TDV growth metrics have shown a much worse growth deceleration and worse quality growth metrics compared to other tech companies. The faster pace of modern technology change will also make re-investing in R&D for new products and new business a far superior growth strategy and much wiser cash usage for the long term prosperity of a technology company. I believe TDV using dividend growth for technology portfolio construction is not a very attractive approach for long term investment seeking for great performance in equity capital returns. For the same reason, due to unreliable tech dividend TDV is neither a solid long holding for dividend investors. I rate TDV as a Hold.
Credit: Source link