

TERADAT SANTIVIVUT
By Raffaele Savi and Jeff Shen, PhD
As we look ahead, our systematic analysis continues to support the case for an eventual “soft landing” economic scenario, where inflation falls to central bank targets without causing a recession.
But the macroeconomic and market backdrop isn’t without uncertainty, and there are several unknowns facing equity investors in the months ahead. What are the implications of policymakers approaching the cutting cycle with caution? Is all the positive macro news priced in after the recent rally, or is there more room for equities to run? And are there any opportunities or risks that markets may not be fully pricing? In this outlook, we take a data-driven approach to answering these questions and discuss how they’re influencing our portfolio positioning in the months ahead.
Soft landing still on track… but will the Fed fall behind the curve?
In recent months, declines in official inflationary data, largely driven by goods prices have increasingly aligned with our view that a soft landing is playing out. Now, the question is whether monetary policy will keep up with how the macro backdrop has been evolving.
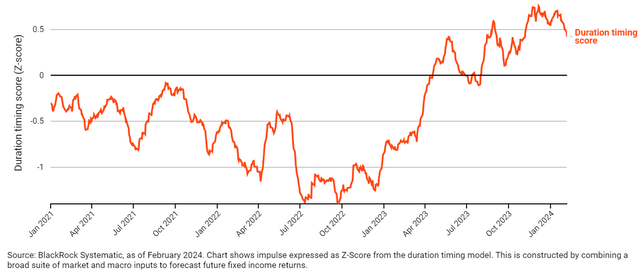
Figure 1 shows our systematic duration timing model, which uses a combination of real-time economic, policy, and market indicators to forecast the direction of interest rates. The model turned constructive on bonds (rates falling) as inflation rapidly declined, and policy sentiment became increasingly dovish over the last six months. While the model remains long duration, largely driven by inflation dynamics, recent pushback from Chair Powell on the timing of the first rate cut has reduced the level of conviction in that view. And because markets continue to price in significant expectations for rate cuts later this year, the Fed’s cautiousness against a backdrop of continued economic resilience raises the possibility that monetary policy will lag both the pace of disinflation and market expectations for rate cuts. As a result, the potential for a growing disconnect between inflation and policy dynamics is becoming increasingly important in our model.
Figure 1: Duration timing model points to downward pressure on yields, but policy sentiment is pushing back on that view
Duration timing model (positive: yields down, negative: yields up)
More room for equities to price in disinflation
For equity investors, the pace of disinflation and strength of the recent equity market rally raises the question of whether all the potential “good news” on the economy is already reflected in market pricing.
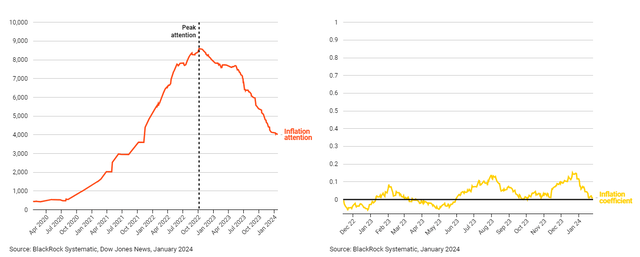
To answer this, we examine the strength of the cross-sectional market rotation observed since attention to higher inflation versus lower inflation peaked in Q4 2022 and compare these moves with what would be required to return pricing fully to the last point at which inflation dynamics appeared normal. We used this same conceptual framework during the COVID-19 reopening phase to determine whether the market had rotated enough following the price movements observed during the earlier lockdown period. Figure 2 shows the strength of the rotation in the period since attention to higher inflation peaked, as measured by the coefficient (a coefficient of 1 would imply that a rotation has fully taken place). We find that close to none of the cross-sectional price action that took place during the abnormally high inflation period has since reversed – even with peak price pressures far behind us and substantial progress on inflation normalization.
This suggests that markets may be behind in pricing the magnitude of recent declines in inflation and presents an opportunity to generate alpha in the cross-section of markets as pricing dynamics reverse.
Figure 2: The decline from peak inflation attention hasn’t coincided with a reversal of cross-sectional price action
Left chart: News articles discussing “high” versus “low” inflation, Right chart: Inflation rotation coefficient (1 = full rotation)
Assessing global equity opportunities and risks
Beyond the constructive macroeconomic backdrop that has remained a key focus of markets, there is a range of other opportunities and risks influencing our global equity views and positioning. In this section, we’ll cover two of these topics – our approach to navigating the Red Sea crisis and the evolving outlook for China.
1. Mapping the impact of Red Sea risks
Supply chain disruptions and shipping curtailment driven by the Red Sea crisis have the potential to influence cross-sectional pricing dynamics and could pose an upside risk to inflation should they continue to escalate.
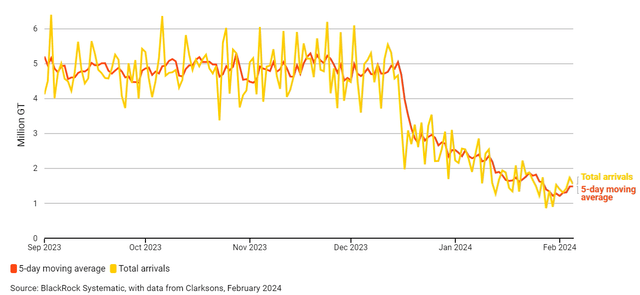
Figure 3 shows how higher frequency shipping data helps us closely monitor the evolving crisis and what it may mean for the global economy and markets in real-time. At a high level, the five-day moving average of vessel arrivals to the Gulf of Aden is now 68% below 2023 average levels in terms of gross tonnage. Looking at the details, we see disruptions which were first concentrated in containerships (largely transporting goods) and car carriers, now increasingly affecting ships carrying oil, food, and gas. This has coincided with a significant escalation of attacks in recent weeks.
Figure 3: Shipping data provides real-time insight into evolving Red Sea risks
Vessel arrivals to Gulf of Aden in gross tonnage
We complement our suite of in-house data sources with insight from an elite panel of subject matter experts known as “superforecasters” who have a proven track record of forecasting geopolitical events with a high degree of accuracy. These expert views have validated our assessment that Red Sea risks are accelerating and not fully reflected in market pricing.
In mapping these risks to company exposures, large language models allow us to leverage the massive volume of text that tends to surround market-relevant themes – including news articles, conference call transcripts, and broker reports – to create bespoke equity baskets. Used alongside the above insights, this text analysis helps to uncover even the most subtle company connections that inform our long and short security positioning. Our analysis suggests that certain retail, automotive, manufacturing, and airline companies are most vulnerable to ongoing challenges, whereas certain freight and logistics and energy companies may experience tailwinds.
2. Reassessing the China opportunity
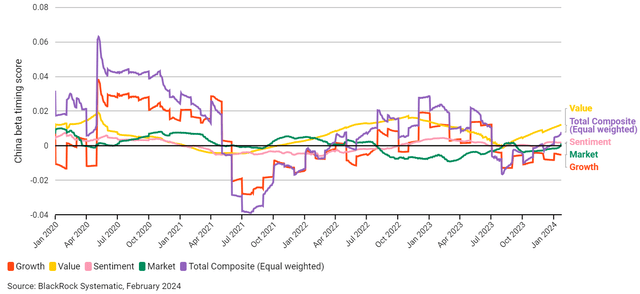
Along the country dimension, Chinese equities struggled in 2023 as sentiment continued to deteriorate. However, signs of Chinese policymakers aiming to shift that narrative have been surfacing in recent weeks with more pro-growth/pro-market actions and a change in the tone of policy announcements. Our systematic timing model for China has recently turned positive, driven largely by valuation and sentiment insights (Figure 4). Given how negative sentiment and positioning have been, a continuation of these trends could potentially present opportunities for investors who are considering adding China exposure.
Figure 4: Systematic models have turned positive on China relative to recent history
China beta timing score
Putting it all together
Our conviction in the soft landing outcome and the opportunity to exploit related equity pricing dynamics remains intact. In terms of broad portfolio positioning, our largely pro-risk stance is reflected in a favorable outlook for cyclical value across consumer discretionary and industrial sectors. At the same time, duration timing insights referenced above remain supportive of rate-sensitive growth exposures within the information technology sector – albeit to a lesser degree than at the end of 2023.
While the pace of disinflation should allow expectations for rate cuts in 2024 to play out, the timing and magnitude of cuts remains less certain. Additionally, we’re closely monitoring market-relevant risks, including macroeconomic and geopolitical uncertainty. Our systematic approach to navigating these dynamics helps us remain nimble in harnessing emerging alpha opportunities and managing risks.
This post originally appeared on the iShares Market Insights.
Credit: Source link