
designer491/iStock via Getty Images
Investment Thesis
Reaching a balance between dividend income and dividend growth is one of the main objectives of the portfolios I am documenting here on Seeking Alpha.
Disproportionally overweighting high dividend yield companies in your dividend portfolio may limit the growth perspective of your dividend payments and lead to underperformance relative to the broader stock market. This can particularly be the case if one of the high dividend yield companies experiences a dividend reduction, thereby significantly impacting the Total Return of your investment portfolio.
Disproportionally overweighting dividend growth companies on the other side may result in insufficient dividend income to meet your current financial needs.
For these reasons, a balanced portfolio mix between dividend income and dividend growth can be the solution.
Therefore, in this article, I will present you with a carefully balanced dividend portfolio which consists of one ETF, one closed-ended equity mutual fund, 5 dividend growth companies and 5 high dividend yield companies. Through a careful selection process, I have ensured a balanced approach of dividend income and dividend growth.
The portfolio provides you with a reduced risk level, a Weighted Average Dividend Yield [TTM] of 4.50% and a 5-Year Weighted Average Dividend Growth Rate [CAGR] of 8.01%, providing proof of its ability to combine dividend income and dividend growth.
I have selected the following dividend growth companies for this portfolio:
- Visa (NYSE:V)
- Microsoft (NASDAQ:MSFT)
- American Express (NYSE:AXP)
- BlackRock (NYSE:BLK)
- Apple (NASDAQ:AAPL)
Visa has been predominantly chosen due to its strong competitive position, its financial health (EBIT Margin [TTM] of 67.26%) and its capacity to provide dividend growth (3-Year Dividend Growth Rate [CAGR] of 16.84%).
Microsoft is part of the portfolio thanks to its strong competitive advantages. This includes its own ecosystem, financial health (Aaa credit rating from Moody’s), and growth outlook (Revenue Growth Rate [FWD] of 12.19%).
I am convinced that American Express is also an excellent choice for generating dividend growth, as evidenced by the company’s 5-Year Dividend Growth Rate [CAGR] of 10.46% and its low Payout Ratio of 20.59%.
BlackRock is a great choice for this portfolio as I believe it will perform well in different market conditions. In addition to that, the company’s excellent market position can be highlighted, as well as its financial health (Aa3 credit rating from Moody’s), and growth metrics (EPS Diluted Growth Rate [FWD] of 9.68%).
I have selected Apple for this portfolio as I am convinced that it can provide additional stability. I firmly believe that the company is still one of the world’s best investment choices when it comes to risk and reward, primarily a result of its strong competitive advantages and wide economic moat.
I have selected the following high dividend yield companies for this dividend portfolio:
- U.S. Bancorp (NYSE:USB)
- BHP Group (NYSE:BHP)(OTCPK:BHPLF)
- Imperial Brands (OTCQX:IMBBY) (OTCQX:IMBBF)
- Realty Income (NYSE:O)
- Ares Capital (NASDAQ:ARCC)
U.S. Bancorp has been selected for this dividend portfolio given the company’s attractive mix of dividend income and dividend growth: while U.S. Bancorp provides investors with a Dividend Yield [FWD] of 5.10%, its 5-Year Dividend Growth Rate [CAGR] stands at an attractive level of 6.59%.
Like U.S. Bancorp, BHP Group offers an appealing mix of dividend income and dividend growth. The Australian based company from the Diversified Metals and Mining Industry exhibits a Dividend Yield [FWD] of 5.07% in combination with a 5-Year Dividend Growth Rate [CAGR] of 7.63%.
Imperial Brands has been included in this dividend portfolio due to its enormous ability to decrease portfolio volatility. This is evidenced by the company’s 24M and 60M Beta Factors of 0.16 and 0.36.
Realty Income has been chosen for this portfolio given the company’s strong financial health (A3 credit rating from Moody’s), and attractive Valuation (P/AFFO [FWD] Ratio of 12.52, which is 14.48% below the Sector Median), allowing you to invest with a margin of safety. It is further worth highlighting that Realty Income remains among the largest positions of The Dividend Income Accelerator Portfolio.
Ares Capital has been particularly selected for this dividend portfolio due to its strong capacity to produce dividend income, evidenced by its Dividend Yield [FWD] of 8.97%. This makes the company an important strategic component of this portfolio, significantly contributing to income generation through dividend payments.
The following ETF has been selected for this dividend portfolio:
- Schwab U.S. Dividend Equity ETF (NYSEARCA:SCHD)
SCHD has been chosen for this dividend portfolio, due to its low Expense Ratio of 0.06%, attractive Dividend Yield [TTM] of 3.45% (which is above the Median of all ETFs of 2.60%), and appealing 10-Year Dividend Growth Rate [CAGR] of 10.87% (which is significantly above the Median of all ETFs of 6.67%), in addition to its low risk-level (its Standard Deviation of 13.80 stands below the Median of all ETFs of 15.16).
The following closed-ended equity mutual fund has been selected for this dividend portfolio:
- Cohen & Steers Qty Inc Realty (NYSE:RQI)
I have included RQI into this dividend portfolio due to its enormous ability to produce dividend income (its Dividend Yield [TTM] stands at 8.41%), and its compatibility and complementation with SCHD (this is particularly the case since their positions do not overlap), making the company an attractive choice for this portfolio.
Overview of the Selected Picks
|
Symbol |
Name |
Sector |
Industry |
Country |
Market Cap in $B |
Dividend Yield [TTM] |
Payout Ratio |
Dividend Growth 5 Yr [CAGR] |
P/E [FWD] |
Allocation |
Amount |
|
SCHD |
Schwab U.S. Dividend Equity ETF |
ETF |
ETF |
United States |
3.45% |
11.80% |
50.00% |
50000 |
|||
|
RQI |
Cohen & Steers Qty Inc Realty |
closed-ended equity mutual fund |
closed-ended equity mutual fund |
United States |
8.41% |
0.00% |
20.00% |
20000 |
|||
|
V |
Visa |
Financials |
Transaction & Payment Processing Services |
United States |
549.61 |
0.73% |
21.36% |
15.93% |
28.2 |
3.00% |
3000 |
|
AAPL |
Apple |
Information Technology |
Technology Hardware, Storage and Peripherals |
United States |
3180 |
0.52% |
14.93% |
5.56% |
31.49 |
4.00% |
4000 |
|
MSFT |
Microsoft |
Information Technology |
Systems Software |
United States |
3220 |
0.68% |
25.37% |
10.23% |
36.66 |
3.00% |
3000 |
|
AXP |
American Express |
Financials |
Consumer Finance |
United States |
161.51 |
1.11% |
20.59% |
10.46% |
17.35 |
3.00% |
3000 |
|
BLK |
BlackRock |
Financials |
Asset Management and Custody Banks |
United States |
112.58 |
2.67% |
50.68% |
9.45% |
18.29 |
3.00% |
3000 |
|
USB |
U.S. Bancorp |
Financials |
Diversified Banks |
United States |
60 |
5.05% |
64.24% |
6.59% |
10.32 |
3.00% |
3000 |
|
O |
Realty Income |
Real Estate |
Retail REITs |
United States |
45.58 |
5.94% |
73.56% |
3.55% |
12.52 |
4.00% |
4000 |
|
BHP |
BHP Group |
Materials |
Diversified Metals and Mining |
Australia |
146.52 |
5.35% |
43.68% |
7.63% |
19 |
2.00% |
2000 |
|
ARCC |
Ares Capital |
Financials |
Asset Management and Custody Banks |
United States |
13.16 |
8.97% |
80.00% |
4.24% |
8.69 |
3.00% |
3000 |
|
IMBBY |
Imperial Brands |
Consumer Staples |
Tobacco |
United Kingdom |
21.43 |
7.36% |
60.14% |
-5.59% |
7.84 |
2.00% |
2000 |
|
4.50% |
8.01% |
100% |
100,000 |
Source: The Author, data from Seeking Alpha
Risk Analysis of The Current Composition of This Dividend Portfolio
Risk Analysis of the Portfolio Allocation per Company/ETF
With a proportion of 50%, SCHD is the largest position of the dividend portfolio I am presenting today, followed by RQI, which represents 20%.
The largest individual positions of this portfolio are Apple and Realty Income, both accounting for 4% of the overall portfolio.
Visa, Microsoft, American Express, BlackRock, U.S. Bancorp and Ares Capital each represent 3%.
BHP Group and Imperial Brands represent a smaller percentage when compared to the overall portfolio, accounting for 2% each.
Source: The Author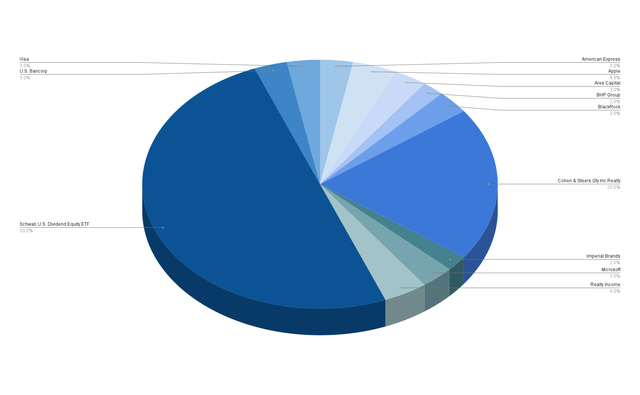
This allocation indicates a reduced risk level, evidenced by the fact that no individual position represents more than 4% of the overall portfolio and the positions with the largest proportions exhibit excellent risk-reward metrics.
Risk Analysis of the Company-Specific Concentration Risk When Allocating SCHD and RQI Across the Companies they Are Invested in
Below you can see the company allocation of this dividend portfolio when distributing SCHD and RQI among the companies they are invested in.
It is worth highlighting that no company represents more than 5% of the overall portfolio, showcasing its lowered risk level.
With a proportion of 4.89%, BlackRock represents the largest position of the overall portfolio. I believe the company is an excellent choice as the largest position given its strong competitive advantages, excellent competitive position, financial health and mix of dividend income and dividend growth.
Realty Income is the second largest position of this portfolio, representing 4.86% of the total portfolio, ahead of U.S. Bancorp with 4.27%, and Apple with 4%.
The elevated shares of BlackRock, Realty Income, and U.S. Bancorp result from their inclusion in this portfolio both through direct investments and indirectly via SCHD (BlackRock and U.S. Bancorp) or RQI (Realty Income). Through the careful selection process of the individually selected companies, I have ensured that no positions represent more than 5% of the overall portfolio, as highlighted in the chart below.
Source: The Author, data from Seeking Alpha and Morningstar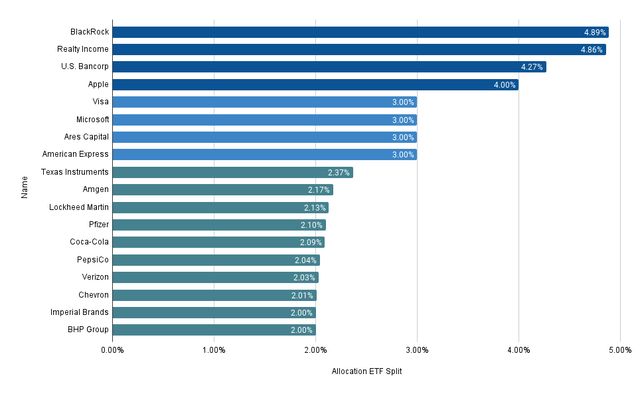
Risk Analysis of the Portfolio’s Sector-Specific Concentration Risk When Distributing RQI and SCHD Across their Sectors
The chart below illustrates the portfolio’s sector allocation when distributing RQI and SCHD across the companies they are invested in.
The Financials Sector accounts for the largest proportion of the overall portfolio, representing 25.16%.
The second largest is the Real Estate Sector with 18.08%, followed by the Information Technology Sector with 12.53% and the Consumer Staples Sector with 10.11%.
The fifth largest is the Health Care Sector, which makes up 8.42% of the overall portfolio. This is followed by the Industrials Sector with 7.28%, the Energy Sector with 6.97%, and the Consumer Discretionary Sector with 5.73%
The remaining sectors account for less than 5% of the overall portfolio (the Materials Sector with 3.16%, the Communication Services Sector with 2.54%, and the Utilities Sector with 0.02%).
Source: The Author, data from Seeking Alpha and Morningstar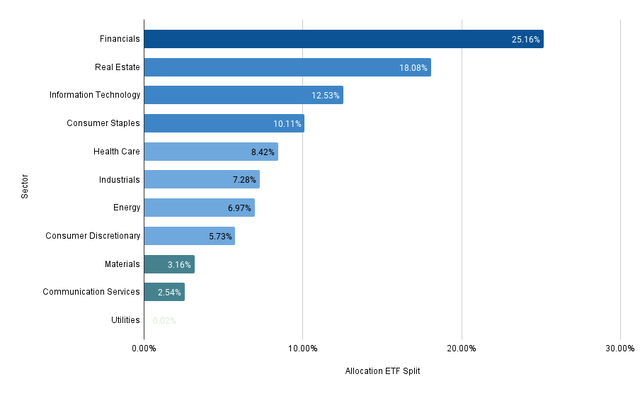
This sector allocation further underscores the portfolio’s reduced risk level, increasing the chances of achieving positive investment results.
Risk Analysis: Analyzing the 10 Individual Positions of This Dividend Portfolio
Analysis of the Market Capitalization of the 10 Individual Positions
The chart below illustrates the Market Capitalization of the 10 individually selected companies of this dividend portfolio.
The companies with the largest Market Capitalization are by far Microsoft ($3,220B) and Apple ($3,180B). The third largest in terms of Market is Visa ($549.61B), followed by American Express ($161.51B), BHP Group ($146.52B), and BlackRock ($112.58B).
Source: The Author, data from Seeking Alpha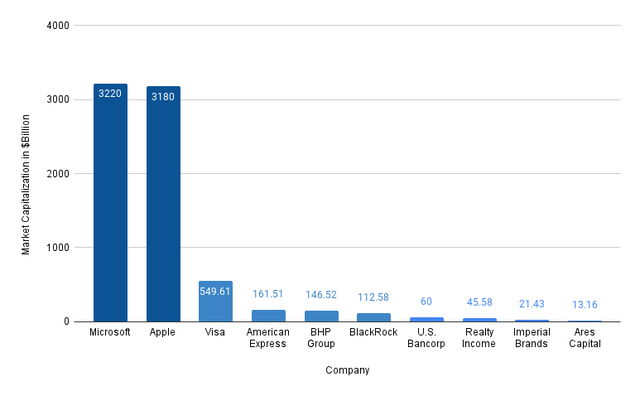
It is worth highlighting that companies with a larger Market Capitalization tend to have a lower risk level, as they often possess stronger competitive positions.
Microsoft and Apple’s large Market Capitalizations and their attractive risk-reward profiles highlight that they are attractive choices for this dividend portfolio, even though they provide a relatively low Dividend Yield. I am convinced that both can be important key positions to help reach an attractive Total Return when investing over the long term.
Analysis of the Dividend Yield [TTM] of the 10 Individual Positions
The companies that contribute most to the generation of income for this dividend portfolio are Ares Capital (with a Dividend Yield [TTM] of 8.97%), Imperial Brands (7.36%), Realty Income (5.94%), BHP Group (5.35%), and U.S. Bancorp (5.05%), as illustrated in the chart below.
Source: The Author, data from Seeking Alpha![Dividend Yields [TTM]](https://static.seekingalpha.com/uploads/2024/6/15/55029283-17184556260762398.png)
While the remaining companies do not generate significant income right now, they are still important elements of this dividend portfolio, particularly due to their contribution for dividend growth and their capacity to provide attractive Total Returns when investing over the long term.
The chart underlines that this portfolio provides investors with a balanced mix of dividend income and dividend growth, indicating its attractiveness for investors looking to combine dividend income and dividend growth.
Analysis of the Payout Ratio of the 10 Individual Positions of This Dividend Portfolio
The chart below illustrates that the majority of companies in this dividend portfolio provide investors with elevated chances for dividend enhancements.
Due to their low Payout Ratios, companies such as Apple (with a Payout Ratio of 14.93%), American Express (20.59%), Visa (21.36%), and Microsoft (25.37%) provide investors with strong dividend growth potential in the year ahead. I am convinced that these companies will contribute to significant dividend enhancements in the coming years.
Source: The Author, data from Seeking Alpha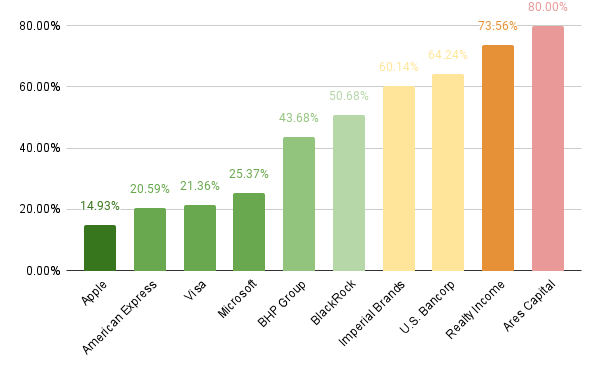
It is worth highlighting Ares Capital’s elevated Payout Ratio of 80.00%. Given the company’s EPS Diluted Growth Rate [FWD] of 22.73% and its limited proportion of the overall portfolio (3%), this does not pose a significant risk for investors.
Analysis of the Equity Style of the 10 Individual Positions of This Dividend Portfolio
29% of the selected picks are large-cap companies with a value focus, while 27% are large-cap companies with a core focus (combining value and growth).
18% are mid-cap companies with a core-focus and 14% are mid-cap companies with a value-focus.
Only 7% of the selected picks are large-cap companies with a growth-focus. 2% of the portfolio is represented by small-cap companies with value focus and 2% by small-cap companies with core focus.
Source: The Author, data from Morningstar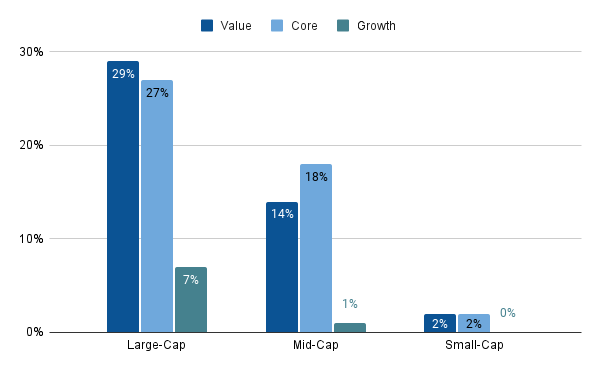
The equity style of this dividend portfolio further highlights its reduced risk level, as large-cap companies with a focus on value tend to provide investors with a lower risk profile.
Conclusion
The dividend portfolio presented in today’s article brings a lot of benefits for investors. It not only merges dividend income with dividend growth, evidenced by its Weighted Average Dividend Yield [TTM] of 4.50% and its 5-Year Weighted Average Dividend Growth Rate [CAGR] of 8.01%, it also offers a broad diversification and reduced risk level. This increases the chances of achieving successful investment outcomes.
For this dividend portfolio, I have carefully selected five high dividend yield companies, five companies with a focus on dividend growth, one ETF that combines dividend income and dividend growth (SCHD) and one closed-ended equity mutual fund (RQI).
Each of the selected picks is a strategically important component to reach a balanced approach between dividend income and dividend growth.
RQI is a key-position for this dividend portfolio due it its complementation with SCHD (since their positions do not overlap) and its ability to produce a significant amount of income via dividend payments (Dividend Yield [TTM] of 8.41%).
To further decrease the portfolio’s risk level, you could also include U.S. government bonds. This would help to decrease the portfolio’s volatility, making it more resilient to any market condition.
This portfolio not only helps you to produce significant income for today (evidenced by its Weighted Average Dividend Yield [TTM] of 4.50%), it can also serve as an additional source of income for your retirement, thanks to its additional focus on dividend growth (underscored by a 5-Year Weighted Average Dividend Growth Rate [CAGR] of 8.01%).
Editor’s Note: This article discusses one or more securities that do not trade on a major U.S. exchange. Please be aware of the risks associated with these stocks.
Credit: Source link