

RapidEye
The surge in technology stocks echoes past market euphoria, yet concerns arise amid current economic challenges. This article analyzes historical parallels and potential implications for the SPDR S&P 500 Trust ETF (NYSEARCA:SPY), stressing caution and prudent risk management. Focusing on key indicators and macroeconomic elements, this article offers insights into the state of significant indexes in the US financial markets. It also explores relevant economic indicators that help frame discussions surrounding SPY. The decision to downgrade SPY to a sell position reflects a proactive response to shifting market dynamics. As we await insights from forthcoming events like the FOMC meeting, maintaining vigilance and adaptability remains crucial for investors.
A Macro Perspective
Following the 2008 economic downturn and the gradual recovery from the COVID-19 pandemic, American consumers have significantly ramped up their reliance on debt. Household debt surged by $212B in just the fourth quarter of 2023, reaching a staggering $17.5T. Non-housing debt, particularly credit card debt, has ballooned to $1.13 trillion, marking a 136% increase since 1999 and highlighting the substantial dependence on borrowed funds for consumer spending. Meanwhile, interest rates on new credit cards have soared to an average of 24.66%, a considerable portion exceeding even 30%.
Simultaneously, alternative credit payment methods like “buy now, pay later” [BNPL] have gained traction, particularly among non-white millennials and older Generation Z individuals with household incomes below $75,000. However, this surge in debt has coincided with a decline in the personal saving rate, which hit a multi-year low of 3.8% in January 2024, akin to levels seen in March 2000. This is down from 8.5% before the pandemic and a peak of 32% in April 2020, raising concerns about consumers’ financial stability.
FRBNY Consumer Credit Panel/Equifax, FRED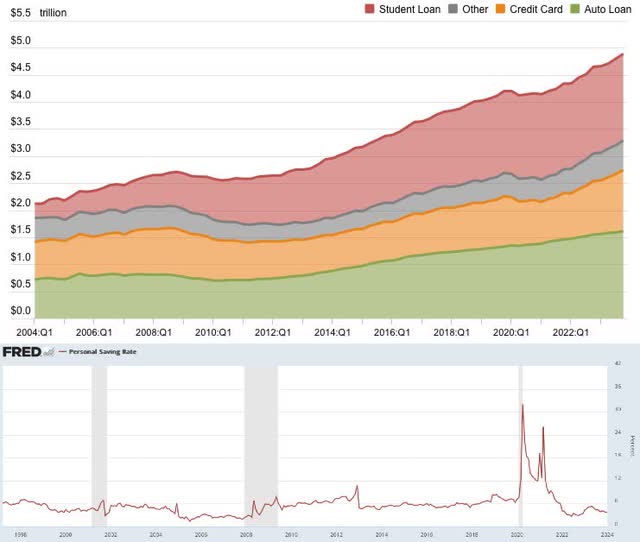
The core Consumer Price Index [CPI], excluding food and energy prices, gives a more reliable picture of inflationary pressure in the economy without more volatile elements. Although cooling down significantly from its peak observed during 2022, the index again gives signs of resilience, despite the Federal Funds rates standing at levels not observed since 2001.
Bloomberg Financial L.P.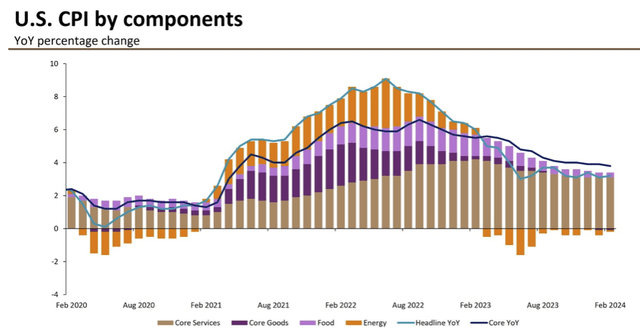
In February, the core Consumer Price Index [CPI] increased by 0.4% month-over-month [MoM] and a slightly softer 3.8% year-over-year [YoY]. This rise was primarily fueled by increased owner’s equivalent rent and medical care services prices. As depicted in the chart above, core services inflation continues to show resilience, with the shelter component serving as the primary driver, comprising one-third of the overall CPI.
Headline inflation, as measured by the overall Personal Consumption Expenditures [PCE] index, reflects the prices U.S. consumers pay for a wide array of goods and services, including cars, food, clothing, housing, and healthcare. The latest YoY reading of 2.4% remains significantly above the Federal Reserve’s [FED] 2% symmetric target level defined since 2012. This suggests that for this metric to weaken substantially, there needs to be a decline in shelter prices.
The Federal Reserve, in its proactive role, closely monitors the employment market, particularly wage growth, as another crucial element of the economy. The FED aims for a “soft landing” scenario where it achieves its target inflation without causing significant disruption in employment and thereby avoiding major negative impacts on the economy. However, to reduce inflationary pressure, the economy must cool down, and the Fed can only directly influence the demand within the U.S. economy. In other words, consumption must be moderated until price stability is achieved. This conundrum recurs with each rate cycle.
Looking at the past 24 years, while excluding the COVID-induced global crisis, significant similarities and differences can be observed before the recessions that hit the U.S. economy in March 2001 and December 2007.
FRED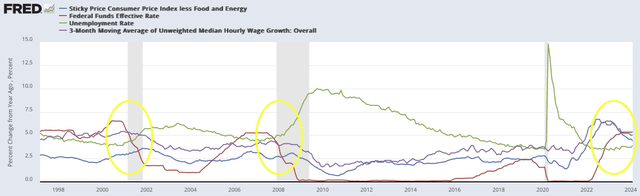
In both previous scenarios, inflationary pressure was significantly lower, but it’s crucial to note that the Federal Funds rate has remained close to zero for many consecutive years since 2009, following the financial crisis. This prolonged low-interest rate environment has not just contributed to but significantly exacerbated the substantial accumulation of debt, as discussed earlier. This situation has distorted the US consumer’s purchasing power and nominal wealth, essentially deferring the inevitable moment when the consequences must be faced and debts repaid.
In both historical scenarios, wage growth had to decrease significantly below actual levels, while a surge in unemployment has been an inevitable consequence of the negative catalyst triggering the economic downturn. Today, both measures remain at unfavorable levels, making it challenging for the Fed to achieve its goals, prompting the central bank to maintain interest rates at higher levels. It appears that a significant cooldown in the labor market is not just necessary but an imminent possibility for other metrics to follow suit and reach the inflation target. The pressing question is not if, but when and how severe this cooldown will occur, potentially in the form of a recession.
Of particular relevance in this analysis is the potential impact on the US stock market, which is currently at historically high levels. A recession could potentially lead to a downturn and a significant plunge in stock prices as investor sentiment weakens and corporate earnings come under severe pressure. However, the exact magnitude and duration of such an impact would depend on various factors, including the severity of the recession, the effectiveness of policy responses, and broader market dynamics.
One of the primary drivers of the actual surge in the equity market is the emergence of Artificial Intelligence [AI] and the derived forecasts of future profits for significant market participants in relevant industries such as chip makers, cloud computing companies, tech giants, and cutting-edge hardware and software manufacturers. The surge in technology-centric mega caps known as “The Magnificent Seven,” including Microsoft Corporation (MSFT), Apple Inc. (AAPL), NVIDIA Corporation (NVDA), Alphabet Inc. (GOOGL) (GOOG), Amazon.com, Inc. (AMZN), Meta Platforms, Inc. (META), and Tesla, Inc. (TSLA), which have outperformed the S&P 500 (SP500) by 2 to 108 times in the past ten years, has led to some perplexity, if this recent parabolic bull market isn’t facing a similar euphoric expansion observed during the dotcom bubble, while the underlying economy is dealing with challenges discussed earlier. Financial stability is facing significant concerns. The SP500, the Nasdaq Composite (IXIC), and the Nasdaq 100 (NDX) are market capitalization-weighted indexes, which means that the performance of larger companies has significantly more impact on the index’s overall returns than smaller companies. These seven stocks comprise about 30% of the S&P 500’s total weighting, although they comprise just 1.6% of the stocks in the index. To establish if the indexes are driven higher by just a few stocks, observing the market participation is essential.
The Market Breadth, gauged by the MMFI and represented as the percentage of stocks trading above their 50-day moving averages [MAV], has dropped from its peak reported at the end of December 2023, now standing close to the 50% mark. Focusing on the 200-day MAV, the MMTH has also dropped from its peak, with 59% of stocks standing above their long-term moving average. Both indicators are close to critical support levels, with MMTH price action reflecting higher indecision but trending lower. Both indicators reject the thesis of broad market participation, hinting at a higher dependency of the current rally on a relatively minor number of stocks.
Author, using TradingView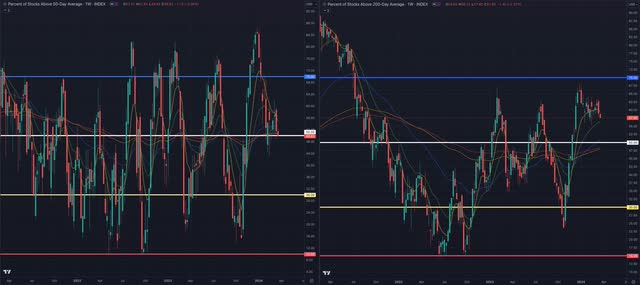
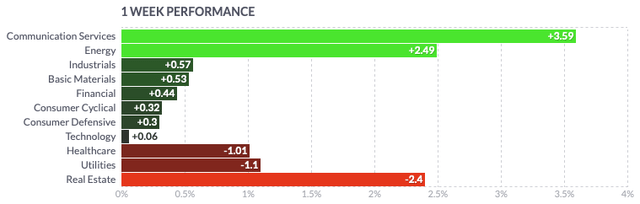
Over the past year, nearly all sectors of the US economy have performed positively, with particularly notable gains seen in the technology, communication services, and financial sectors. Only utilities sector companies have experienced slight losses.
Of late, the energy sector has been on an upward trajectory, propelled by a surge in crude oil prices. This resurgence in gas prices, bouncing back from their January lows, has posed inflation reduction challenges.
In the past week, there have been signs of broader weakness, particularly in the real estate sector and among companies in the utilities, healthcare, and technology groups.
Finviz Finviz
The CBOE Volatility Index (VIX) tends to be moderate during bull markets and higher in bear markets. Spikes in the VIX are often observed during extreme uncertainty or unexpected significant events, typically viewed as negative catalysts for the stock market. Although this benchmark alone isn’t an indicator for future developments, and VIX could float around these low levels for an extended time, the index is standing at similar levels as before significant events have been observed, triggering high volatility in the equity market. Statistically, in the past 34 years, the index has spent significantly more time above the current levels than below, suggesting a higher probability of increased volatility ahead.
Author, using TradingView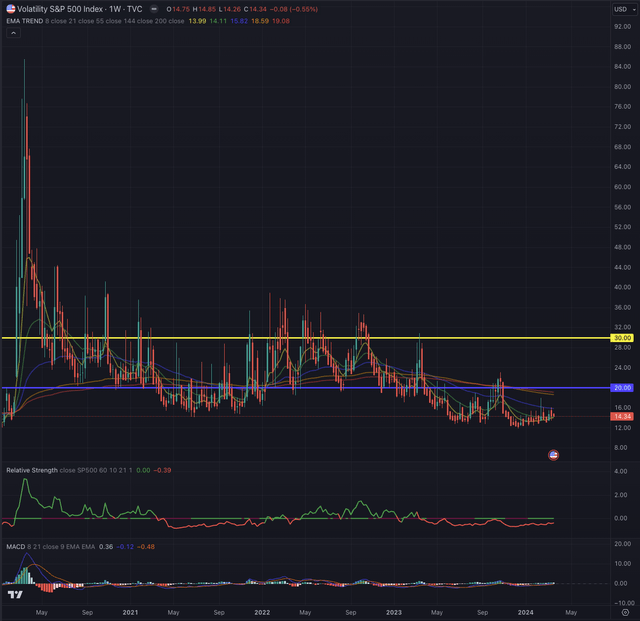
The SPDR Bloomberg Barclays High Yield Bond ETF (JNK), which monitors highly liquid, high-yield, US dollar-denominated corporate bonds, is consolidating around the yearly high while still standing at significantly lower levels as observed before and immediately after the pandemic crash. This reflects investors’ relatively cautious risk appetite in a high-interest-rate environment, where low-risk bonds and other assets offer attractive returns while decreasing rate expectations push money managers to reshuffle their portfolios accordingly. While it is still early to confirm any hypothesis, JNK lacks the momentum to overcome the overhead resistance and could retrace toward the low-90s reading.
Author, using TradingView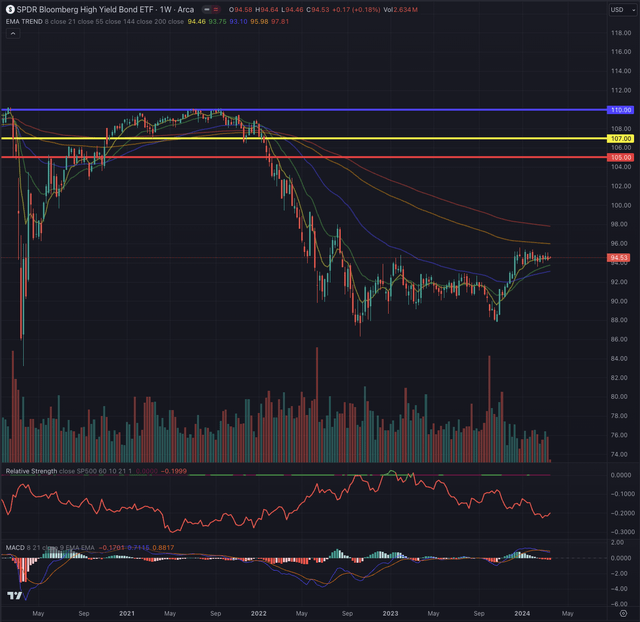
Where are we now?
In my analysis on January 17, 2024, I suggested a higher probability of seeing SPY advancing, estimating $490.50 as the first target and sequentially $500 as the second target.
I evaluate the likelihood of the buildup of potentially more positive momentum, defined by the MACD and the relative strength against the IWM. Both indicators suggest an early upward swing, while volume has also been decreasing, which is another hint to a possible significant move incoming.
On the other hand, I also underscored the higher risk represented by the SP500 forming a new all-time high [ATH], and consequently, I expected a likely breakout to happen in a second attempt while seeing SPY consolidating further.
SPY broke out the week after my article was published, reaching my suggested targets with significant momentum. This led me to reevaluate the situation and update my contingency plan.
On the weekly chart, SPY demonstrates a robust breakout from its previous all-time high [ATH], nearing the formation of a cup-and-handle pattern, albeit slightly dislocated. This benchmark has exhibited notably more robust performance than the broader US equity market, as represented by the iShares Russell 2000 ETF (IWM). The significant upward movement suggests the potential formation of a new impulse wave, indicating investors may encounter wave four shortly. The MACD is currently at record-high extended levels, signaling a possible reversal.
Author, using TradingView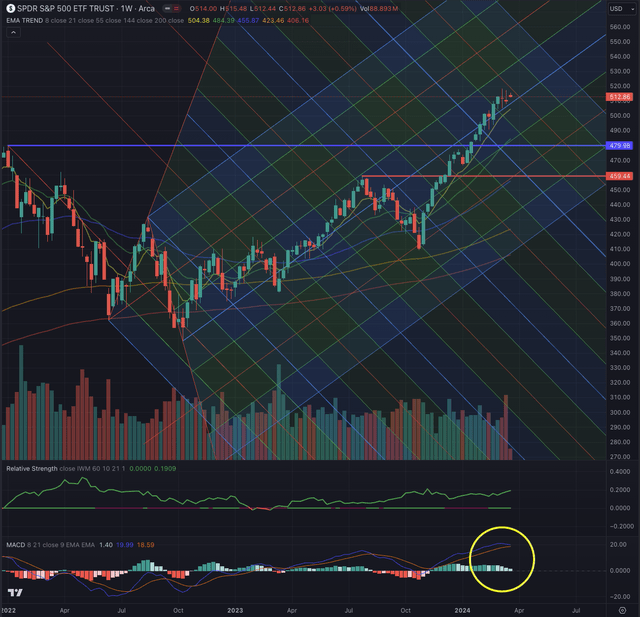
Short interest on the SPY has reported a significant spike, with a massive surge in days to cover, leading the indicator to its highest levels in the past three months.
CapEdge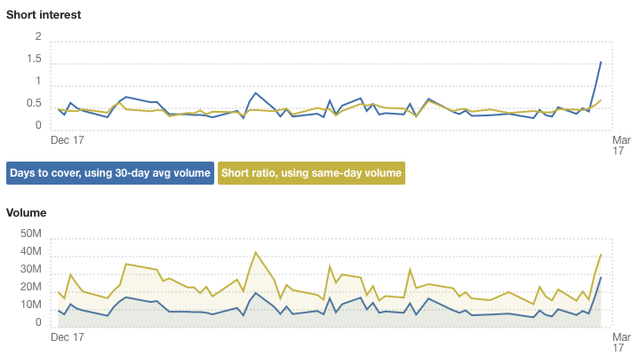
The SPY fund flows show a net inflow of $3.44B in the past three months, down from the previously reported amount of $43.92B two months earlier, signaling a possible peak in funds flows, in line with the observed price action.
VettaFi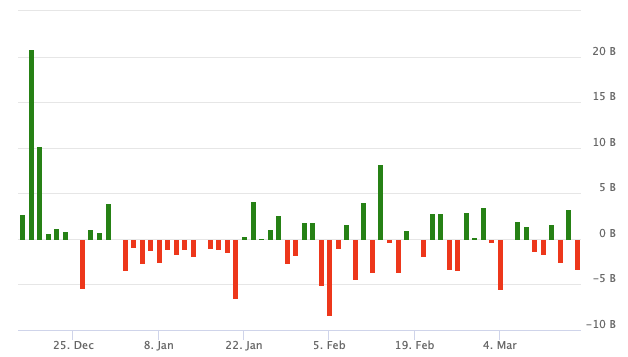
What is coming next?
Looking at the daily chart, the strong uptrend is trailed by the short-term EMA8 and EMA21, while the index is performing significantly better than the broader US equity market, as observed in its relative strength. The movement happened with only minor retracements, underscoring the powerful momentum.
However, SPY is showing signs of forming a top, as observed in the recent price action, which hints at distribution days. When compared to its moving averages, the extension of its actual price underscores the higher likelihood of this assumption.
Author, using TradingView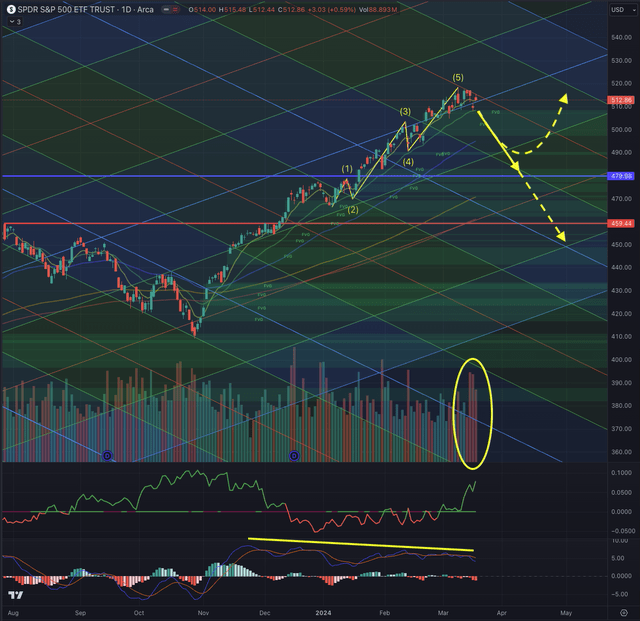
In the first market session of this week, SPY opened with a gap-up, primarily driven by growth and AI-centered stocks, with notable contributions from “The Magnificent Seven,” particularly NVDA, GOOG, and AAPL, as the latter is reportedly in talks with Google over a Gemini AI system licensing, that would build on their search agreement, which has made Google the default search engine in Apple’s Safari browser since 2002. SPY has formed an upward five-wave impulse sequence starting from the consolidation observed during January and extending until Friday, March 8, with waves 3 and 5 showing extensions.
It’s noteworthy that the MACD indicates a negative divergence, while SPY has left gaps open between $512.44 and $511.70 and between $503.02 and $497.37. These gaps partially converge with significant daily and weekly Fair Value Gaps [FVG]. Considering this, it is anticipated that SPY will balance out as it fills the gaps and aligns with the divergence suggested by the MACD indicator.
In the event of a correction, SPY could test support levels around $503, $490, and even down towards its breakout level at $480. SPY might target $434 in the short term in a more pessimistic scenario. This latter outcome could be triggered by an adverse event causing a significant surge in volatility, as suggested earlier in this article. Additionally, a considerable recession or unexpected negative catalyst could have an even more detrimental impact on SPY, given its current high levels.
After carefully considering the extended price levels and the underlying conditions, I am downgrading SPY to a sell position. For risk-averse investors, waiting for the FOMC meeting this week and the subsequent conference expected on Wednesday, March 20, may be prudent. These events are anticipated to provide further insights and signals to the markets regarding the tactics the Fed may be considering in the coming months.
At this stage, I would not enter any new long positions, as the risk-reward ratio does not appear favorable despite the possibility of continuing the parabolic ascent, which cannot be completely ruled out. In the eventuality of SPY forming a new impulse sequence as observed on the weekly chart, investors would have to face wave four first, which I would estimate retracing until the discussed price levels, favoring the $480 scenario, before forming wave five, which could lead SPY to reach levels around $561-$567. It’s crucial to be cautious and aware of the potential risks, as such an assumption carries its risk of failure.
The bottom line
Technical analysis is a valuable tool for investors, augmenting their chances of success by guiding the intricacies of listed securities. Like consulting a map or using GPS for an unfamiliar journey, employing technical analysis in investment decisions offers a strategic guide. I integrate techniques grounded in the Elliott Wave Theory and utilize Fibonacci’s principles to evaluate probable outcomes based on probabilities. This approach assists in validating or challenging potential entry points, considering factors such as sector, industry, and price action. My technical analysis endeavors to thoroughly assess an asset’s situation and calculate likely outcomes informed by these theories.
The present situation does share some similarities with the conditions observed in 2000 and 2007. On the one hand, the euphoric run in US equities related to AI bears a resemblance to the surge in internet-related stocks during the dot-com bubble. On the other hand, the bloated debt levels, fragile consumer financial health, and uncertainties surrounding the global economy echo aspects of the financial crisis.
Moreover, macroeconomic indicators preceding the recessions in 2000 and 2007 exhibit some parallels with the current economic landscape, hinting at a potential similar pattern. However, this doesn’t necessarily imply that panic selling is the appropriate response at these price levels. Instead, caution is warranted as warning signs are present.
While past performance doesn’t guarantee future results, disregarding lessons from the past can incur significant costs. Typically, when something breaks, it occurs at extremes, and the current situation is undoubtedly stretched in many aspects. Therefore, it’s prudent to exercise caution and carefully manage risks in the current market environment.
Based on the considerations discussed and the assessment of the current market conditions, I am downgrading SPY to a sell position.
Credit: Source link