

hatman12
Direxion Daily S&P 500 Bull 2X Shares ETF (NYSEARCA:SPUU) is an instrument magnifying the broad market performance for trading purposes. However, its daily 2X leverage factor is a source of drift. It must be closely monitored to detect changes in the drift regime. This article explains what “drift” means, quantifies it in 22 leveraged ETFs, and focus on SPUU drift history.
Why do leveraged ETFs drift?
Leveraged ETFs often underperform their underlying index, leveraged by the same factor. The decay has essentially four reasons: beta-slippage, roll yield, tracking errors, management costs. Beta-slippage is the main reason in equity leveraged ETFs. To understand what is beta-slippage, imagine a very volatile asset that goes up 25% one day and down 20% the day after. A perfect double leveraged ETF goes up 50% the first day and down 40% the second day. On the close of the second day, the underlying asset is back to its initial price:
(1 + 0.25) x (1 – 0.2) = 1
And the perfect leveraged ETF?
(1 + 0.5) x (1 – 0.4) = 0.9
Nothing has changed for the underlying asset, and the ETF price is down 10%. It is not a scam, just the normal behavior of a leveraged and rebalanced portfolio. In a trending market, beta-slippage can be positive. If the underlying index goes up 10% two days in a row, on the second day, it is up 21%:
(1 + 0.1) * (1 + 0.1) = 1.21
The perfect 2x leveraged ETF is up 44%:
(1 + 0.2) * (1 + 0.2) = 1.44
Beta-slippage is path-dependent. If the underlying index gains 50% on day 1 and loses 33.33% on day 2, it is back to its initial value, like in the first example. However, the 2x ETF loses one third of its value, instead of 10% in the first case:
(1 + 1) x (1 – 0.6667) = 0.6667
Without a demonstration, it shows that the higher the volatility, the higher the decay. Hence, its name: “beta” is a statistical measure of volatility. However, it is a bit misleading because the decay cannot be calculated from beta.
Monthly and yearly drift watchlist
There is no standard or universally recognized definition for the drift of a leveraged ETF. Some are quite complicated. Mine is simple and based on the difference between the leveraged ETF performance and Ñ times the performance of the underlying index on a given time interval, if Ñ is the leveraging factor. Most of the time, this factor defines a daily objective relative to an underlying index. However, some dividend-oriented leveraged products have been defined with a monthly objective (mostly defunct ETNs issued by Credit Suisse and UBS: CEFL, BDCL, SDYL, MLPQ, MORL…).
First, let’s start by defining “Return”: it is the return of a leveraged ETF in a given time interval, including dividends. “IndexReturn” is the return of a non-leveraged ETF on the same underlying asset in the same time interval, including dividends. “Abs” is the absolute value operator. My “Drift” is the drift of a leveraged ETF normalized to the underlying index exposure in a time interval. It is calculated as follows:
Drift = (Return – (IndexReturn x Ñ))/ Abs(Ñ)
“Decay” means negative drift. “Month” stands for 21 trading days, “year” for 252 trading days.
|
Index |
Ñ |
Ticker |
1-month Return |
1-month Drift |
1-year Return |
1-year Drift |
|
S&P 500 |
1 |
SPY |
6.48% |
0.00% |
18.45% |
0.00% |
|
2 |
SSO |
12.61% |
-0.18% |
27.86% |
-4.52% |
|
|
-2 |
SDS |
-10.86% |
1.05% |
-29.29% |
3.81% |
|
|
3 |
UPRO |
19.12% |
-0.11% |
33.68% |
-7.22% |
|
|
-3 |
SPXU |
-16.15% |
1.10% |
-44.65% |
3.57% |
|
|
ICE US20+ Tbond |
1 |
TLT |
0.22% |
0.00% |
-7.01% |
0.00% |
|
3 |
TMF |
-0.92% |
-0.53% |
-34.65% |
-4.54% |
|
|
-3 |
TMV |
0.23% |
0.30% |
13.33% |
-2.57% |
|
|
NASDAQ 100 |
1 |
QQQ |
6.30% |
0.00% |
31.10% |
0.00% |
|
3 |
TQQQ |
18.36% |
-0.18% |
67.14% |
-8.72% |
|
|
-3 |
SQQQ |
-16.87% |
0.68% |
-65.84% |
9.15% |
|
|
DJ 30 |
1 |
DIA |
4.58% |
0.00% |
13.14% |
0.00% |
|
3 |
UDOW |
12.71% |
-0.34% |
20.67% |
-6.25% |
|
|
-3 |
SDOW |
-11.64% |
0.70% |
-32.65% |
2.26% |
|
|
Russell 2000 |
1 |
IWM |
8.07% |
0.00% |
11.51% |
0.00% |
|
3 |
TNA |
23.73% |
-0.16% |
6.55% |
-9.33% |
|
|
-3 |
TZA |
-21.42% |
0.93% |
-41.15% |
-2.21% |
|
|
MSCI Emerging |
1 |
EEM |
4.40% |
0.00% |
0.47% |
0.00% |
|
3 |
EDC |
11.71% |
-0.50% |
-17.74% |
-6.38% |
|
|
-3 |
EDZ |
-11.43% |
0.59% |
-8.63% |
-2.41% |
|
|
Gold spot |
1 |
GLD |
-2.22% |
0.00% |
5.18% |
0.00% |
|
2 |
UGL |
-5.19% |
-0.38% |
1.71% |
-4.33% |
|
|
-2 |
GLL |
5.65% |
0.61% |
-7.12% |
1.62% |
|
|
Silver spot |
1 |
SLV |
-3.33% |
0.00% |
9.14% |
0.00% |
|
2 |
AGQ |
-7.45% |
-0.40% |
4.42% |
-6.93% |
|
|
-2 |
ZSL |
6.47% |
-0.10% |
-32.72% |
-7.22% |
|
|
S&P Biotech Select |
1 |
XBI |
-0.86% |
0.00% |
11.23% |
0.00% |
|
3 |
LABU |
-5.01% |
-0.81% |
-13.97% |
-15.89% |
|
|
-3 |
LABD |
2.74% |
0.05% |
-61.39% |
-9.23% |
|
|
PHLX Semicond. |
1 |
SOXX |
6.55% |
0.00% |
44.93% |
0.00% |
|
3 |
SOXL |
17.58% |
-0.69% |
85.06% |
-16.58% |
|
|
-3 |
SOXS |
-18.49% |
0.39% |
-84.17% |
16.87% |
The leveraged biotechnology ETF (LABU) shows the worst monthly decay of this list, with a drift of -0.81%. The leveraged semiconductors ETF (SOXL) has suffered the worst 12-month decay: -16.58%.
The highest positive drift in one month is +1.10% for the inverse leveraged S&P 500 ETF (SPXU). The inverse leveraged semiconductors ETF (SOXS) has the highest 12-month drift: +16.87%, in a large loss.
Positive drift follows a steady trend in the underlying asset, whatever the trend direction and the ETF direction. It means positive drift may come with a gain or a loss for the ETF. Negative drift comes with daily return volatility (“whipsaw”). For example, leveraged ETFs in silver and biotechnology (bull and bear) show a significant 12-month decay, because the underlying assets have been very volatile.
SPUU drift history
Since inception on 5/28/2014, SPUU has gained 326% (17.3% annualized), while SPY is a +172% (11.7% annualized) in the same time. Even if it is less than twice the daily leveraging factor, it still looks great. However, a simulation with synthetic prices starting in January 2000 is much less attractive: SPUU is at +305.9% (6.1% annualized) vs. +368.6% (6.8% annualized) for SPY. On two decades and through two market cycles, the leveraged ETF (simulated) has lagged the non-leveraged underlying index. Moreover, its maximum drawdown would have been -89%.
The next chart plots the 12-month drift since January 2000 using synthetic prices based on the underlying index. The historical average is -1.88%, which is not much better than -2.04% for the 3x ETF UPRO.
12-month drift of SPUU, simulated with synthetic prices before inception (chart: author; data: Portfolio123)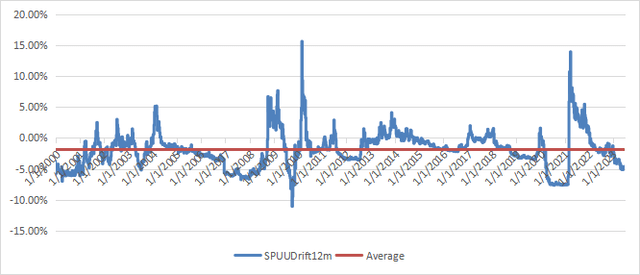
12-month drift of UPRO, simulated with synthetic prices before inception (chart: author; data: Portfolio123)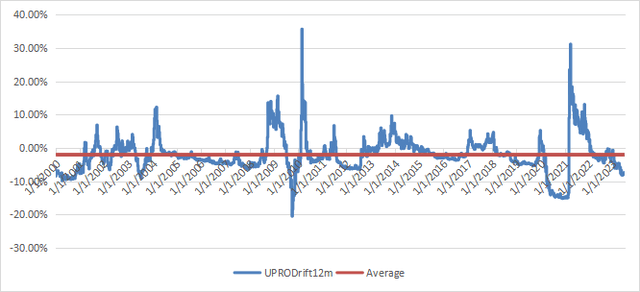
The difference of a few basis points looks immaterial, but on the 23-year period, UPRO (simulated) would have returned only 95.8% (2.9% annualized).
Takeaway
Direxion Daily S&P 500 Bull 2X Shares ETF is an efficient trading instrument in a market rally. However, it suffers a significant decay when the S&P 500 is whipsawed between positive and negative daily returns. The VIX index (implied volatility) is not directly related to decay, but it may be a warning. Even if SPUU is less tricky than UPRO or SPXL, it has been designed for seasoned traders with a good understanding of its behavior behind the advertised leveraging factor. If you have a doubt, stay away.
Credit: Source link