
Bill Oxford
Spire Inc. (NYSE:SR) is a regional regulated natural gas utility that provides service to customers in three states in the American Great Plains and Deep South. These three states are Missouri, Mississippi, and Alabama:
Spire Inc.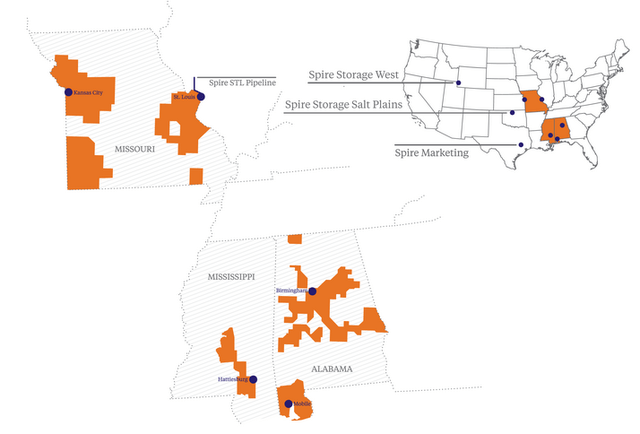
As is the case with a few of the larger natural gas utilities, Spire also has a midstream operation that markets, transports, and stores natural gas. This is shown in the map above. This operation is much smaller than the utility operation, so the company should be considered a natural gas utility. As I pointed out in my last article on this company, Spire enjoys remarkably stable revenue and cash flows over time regardless of the conditions in the broader economy. This is something that has long made utilities popular among retirees and other very conservative investors. Spire continued to exhibit this characteristic stability in its most recent quarter.
This is something that could make the company an attractive investment right now considering that the economy is showing numerous signs that it may soon enter a recession. Unfortunately, the stock is not especially cheap right now as Spire is trading at a significant premium to its peers.
About Spire Inc.
As stated in the introduction, Spire is a regulated natural gas utility that operates in Missouri, Mississippi, and Alabama. While none of these are among the most densely populated states in the country, natural gas utilities do not have to provide universal service. Unlike electric utilities, their infrastructure is not constructed in rural areas or areas of relatively low population density. As we can see in the map above, Spire’s natural gas service is generally limited to the largest cities in each of these three states and their surrounding suburbs. The company did not provide a customer count in its most recent earnings report, but its webpage states that it serves approximately 1.7 million customers. That would make the company one of the largest natural gas utilities in the United States.
In my previous article on the company, I stated that a utility’s customer count is not necessarily that important:
“As I have pointed out numerous times in the past, the size of a utility’s customer base matters very little when it comes to the characteristics of the business. The most important characteristic for our purposes is that Spire tends to have remarkably stable cash flows over time, regardless of the conditions in the broader economic environment.”
Spire’s continued to show its general stability in the most recent earnings report. This chart shows the company’s revenues during each of the past eleven twelve-month periods:
Seeking Alpha
As we can clearly see, the company’s revenues did not vary much from period to period, although they do exhibit a positive growth trend. That is likely to continue going forward as we will discuss later in this article. The most important thing is that they were not really affected by the changes in the economic environment that occurred over the period.
The same thing is generally true of the company’s operating cash flows. Here they are for each of the same twelve-month periods:
Seeking Alpha
There is admittedly more variation here, but we can still see a certain amount of consistency over time. The reason for this is that the company’s services are a necessity, so people will prioritize paying their natural gas bills ahead of making discretionary expenses.
The fact that people will generally prioritize paying their natural gas bills ahead of making discretionary expenses could be very important right now considering that there are signs that consumers in general are getting weaker. I pointed out that a growing number of people are struggling to pay off their credit card balances in full in a recent article. The Bureau of Labor Statistics earlier today stated that the number of job openings fell to under nine million for the first time since March 2021:
Zero Hedge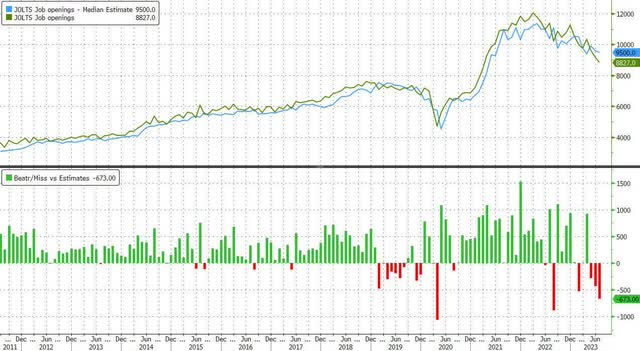
For quite some time now, I and numerous other analysts have been stating that nearly every economic indicator except for jobs and consumer spending has been pointing to a recession for months. Now, we see that even the jobs market is showing signs of breaking. It seems almost certain that consumers will at some point considering the growing revolving credit card balances, and now the weakening job market will likely make it difficult for consumers to get new jobs and boost their discretionary spending power in that way.
Spire’s non-cyclical revenues and cash flows are exactly the kind of thing that we want to have in such an environment. After all, this company should not be as affected by an economic slowdown as one that is highly dependent on the ability of American consumers to keep spending money with wild abandon.
Growth Prospects
Any investor in the company is not likely to be satisfied with mere stability. It is important that any company in which we invest grow and prosper with the passage of time. Spire is well-positioned to accomplish this goal.
As I discussed in my previous article on Spire, the primary way through which the company will deliver on its growth ambitions is by increasing its rate base:
“The primary way that the company will accomplish this is by expanding its rate base. The rate base is the value of the company’s assets upon which regulators allow it to earn a specified rate of return. This rate of return is usually around 10%, but it varies by jurisdiction. As this rate of return is a percentage, any increase in the size of the rate base allows the company to increase the price that it charges its customers in order to earn this regulatory-allowed rate of return. The usual way that a company will grow its rate base is by investing money into upgrading, modernizing, and possibly even expanding its utility-grade infrastructure.”
Spire has presented a plan to invest approximately $7.0 billion into its infrastructure over the 2023 to 2032 period to achieve rate base growth:
Spire Inc.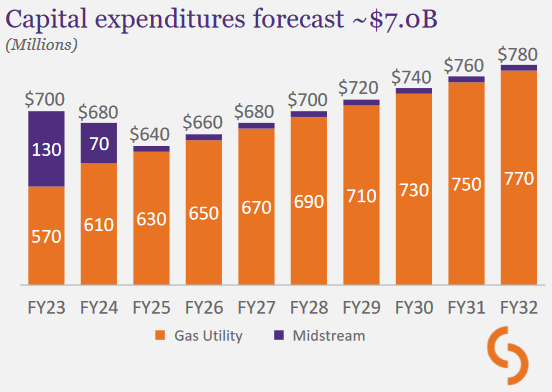
This is a much longer projection horizon than most other utilities have provided, which is a good thing. The long projection horizon should allow us to more accurately determine where the company is likely to be at a given future period of time. That is something that any long-term investor should appreciate as we attempt to determine the total return potential from the investment.
Spire’s capital investment plan as outlined should allow it to grow its rate base at a 7% to 8% rate over the period. However, the company’s earnings per share growth is unlikely to be nearly as high due to the need to finance its growth. The company has guided to a 5% to 7% earnings per share growth rate over the ten-year projection period. When we combine that with the current 4.88% dividend yield, we get a projected total return of 10% to 12% annually on average. That is a bit better than many of the company’s peers are likely to deliver, but it is only in line with the long-term average total return of the S&P 500 Index (SP500).
Financial Considerations
As of June 30, 2023, Spire had a net debt of $4.5122 billion compared to shareholders’ equity of $2.9325 billion. This gives the company a net debt-to-equity ratio of 1.54 today. This is a bit higher than the last time that we looked at the company, which is concerning as it indicates that the company may be increasing its reliance on debt to finance itself. As interest rates have been rising recently, a high debt load could very quickly lead to rising interest expenses that drag on the company’s earnings. As I mentioned in a previous article, New England’s Eversource Energy (ES) is already starting to suffer from the impact of rising interest expenses.
Here is how Spire’s net debt-to-equity ratio compares with its peers:
|
Company |
Net Debt-to-Equity Ratio |
|
Spire Inc. |
1.54 |
|
Atmos Energy (ATO) |
0.61 |
|
NiSource, Inc. (NI) |
1.65 |
|
New Jersey Resources (NJR) |
1.59 |
|
Southwest Gas Holdings (SWX) |
1.50 |
|
Northwest Natural Holding (NWN) |
1.22 |
As we can see here, Spire’s leverage does not appear to be especially out of line relative to its peers. Thus, despite the fact that its leverage appears to be going up, it is not overly reliant on debt to finance its operations at the present time. Thus, we probably do not need to worry too much about its debt right now, but we should still remain cognizant as the company’s interest expenses will increase as it starts to roll over debt. That is especially true today as Chairman Powell’s Jackson Hole speech last Friday implied that the central bank will not be cutting interest rates anytime soon.
Dividend Analysis
One of the biggest reasons why many investors purchase shares of utility companies like Spire is because of the high yields that they pay out. As of the time of writing, Spire yields 4.88%, which is substantially higher than the 1.47% yield of the S&P 500 Index. Spire’s current yield is also well above the 2.66% yield of the U.S. Utility Index (IDU). As is the case with many utilities, Spire has a long history of increasing its dividend on an annual basis:
Seeking Alpha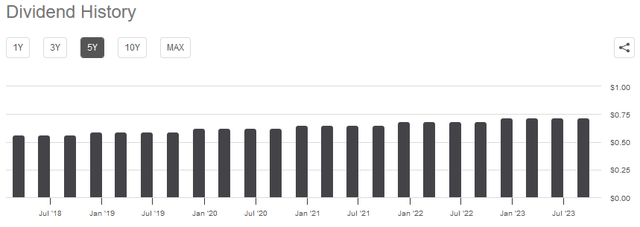
This is something that is very nice to see in today’s inflationary environment, as the annual dividend increases should at least partially offset the loss of purchasing power that the company’s dividend suffers due to inflation. As is always the case though, we should ensure that the company can actually afford the dividend that it pays out. After all, we do not want to be the victims of a dividend cut that reduces our incomes and probably causes the company’s stock price to decline.
The usual way in which we judge a company’s ability to pay its dividends is by looking at its free cash flow. Unfortunately, we see only disappointment here as the company had a negative levered free cash flow of $249.1 million during the twelve-month period that ended on June 30, 2023. This was nowhere close to enough to cover the $163.3 million that the company actually paid out over the same period. That is rather concerning as it implies that the company is not generating enough cash to cover its dividends.
As I have pointed out in previous articles, it is common for utilities to finance their capital expenditures through the issuance of equity and debt. These companies will then pay their dividends out of operating cash flow. During the trailing twelve-month period, Spire had an operating cash flow of $254.5 million. That was sufficient to cover the $163.3 million that was paid out in dividends during the period with quite a bit of money left over for other purposes. Overall, the dividend is probably pretty safe, and we should not have to worry too much about a cut. This is especially true when we consider the company’s inherent stability.
Valuation
The market’s recent realization that the Federal Reserve is serious about keeping rates at today’s levels or higher for an extended period of time has caused utility stocks in general to decline. Over the past month, the U.S. Utility Index is down 5.44%:
Seeking Alpha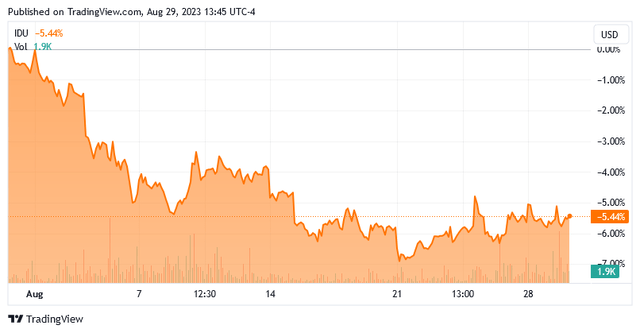
Spire has done even worse. The stock is down 6.82% in the past month alone:
Seeking Alpha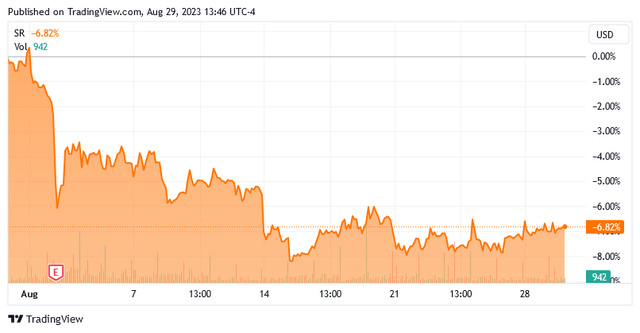
This is probably because the company is generally considered to be a safe way to get a high yield. After all, we have already seen that it is not likely to deliver especially rapid growth. As of right now, an investor can get somewhere around 5% in a money market fund. These funds are considered to be as close to risk-free as you can get, and they are offering higher yields than Spire right now. As such, risk-averse investors may opt to park their money in a money market fund or in U.S. Treasuries as opposed to taking the risk on a utility like Spire. While Spire could deliver a higher total return, that is dependent on the stock actually going up along with the company’s earnings and there is no guarantee of that actually happening.
As might be expected, the fact that the company’s stock has declined has made the company’s current valuation more attractive than it was the last time that we discussed the company. According to Zacks Investment Research, Spire will grow its earnings per share at a 4.22% rate over the next three to five years. This seems a bit low considering what the company should be able to accomplish through rate base growth. We discussed that earlier in this article. Nevertheless, the Zacks estimate gives Spire a price-to-earnings growth ratio of 3.34 at the current price. Here is how that compares to the company’s peers:
|
Company |
PEG Ratio |
|
Spire Inc. |
3.34 |
|
Atmos Energy |
2.66 |
|
NiSource, Inc. |
2.42 |
|
New Jersey Resources |
2.70 |
|
Southwest Gas Holdings |
3.81 |
|
Northwest Natural Holding |
3.99 |
As mentioned in the introduction to this article, Spire looks a bit expensive relative to its peers. We can clearly see that here, as half of the companies on this list have a more attractive valuation. However, it is important to keep in mind that all of the ratios above were calculated based on the Zacks growth rate estimates. In the case of Spire, that estimate may be a bit low. If we use the 6% earnings per share growth midpoint that the company should be able to deliver based on its rate base growth, Spire will have a price-to-earnings growth ratio of 2.34, which makes it look cheap relative to its peers. I am inclined to declare this company fairly valued right now, but if it does manage to achieve the high end of the rate base growth estimate, a case could be made for it being undervalued today.
Conclusion
In conclusion, Spire is a somewhat underfollowed natural gas utility that appears to have a lot to offer an investor right now. As the economy looks likely to be heading into a recession, the non-cyclical nature of the company’s revenues and cash flows is a huge advantage for shareholders. The company is not sacrificing return for safety either, as it should be able to deliver a reasonably attractive total return over the next few years.
Unfortunately, Spire Inc. stock does not appear to be significantly undervalued, despite the steep decline that it has suffered over the past month. It might be worth dollar cost averaging in, but if inflation does not slow down and the Federal Reserve has to raise rates, the stock could decline further and give a better entry price.
Editor’s Note: This article discusses one or more securities that do not trade on a major U.S. exchange. Please be aware of the risks associated with these stocks.
Credit: Source link